


Abstract
Replicative senescence is associated with telomere shortening. In native kidneys, obtained prior to transplantation, we recently described and validated a significant association between shorter intrarenal telomere length and renal arteriosclerosis. After renal transplantation, animal experiments suggested that ischaemia–reperfusion injury, acute rejection episodes and cytomegalovirus disease associate with accelerated renal allograft senescence. The association between post-transplant events and replicative senescence has not yet been evaluated in a human setting.
In a cohort of 134 kidney allograft recipients, we performed protocol-specified renal allograft biopsies at 3 months, 1 year, 2 years and 5 years after transplantation (n = 579 biopsies). We used quantitative real-time polymerase chain reaction to measure intrarenal relative average telomere length (T/S ratio). The association between donor and recipient demographic factors, post-transplant clinical/histological events, renal allograft histological evolution by 5 years post-transplant and intrarenal telomere length at 5 years after transplantation was studied using multiple regression models.
At 5 years after transplantation, shorter intrarenal telomere length was associated with male donor gender, older donor age, donor history of hypertension and donor cardiovascular risk, which confirms the associations observed in native kidneys. Recipient characteristics and post-transplant events like delayed graft function, acute rejection episodes, presence of donor-specific antibodies, cytomegalovirus disease and immunosuppressive regimen did not associate with alterations of intrarenal telomere length at 5 years. Independent of donor age and donor cardiovascular risk, intrarenal arteriosclerosis in protocol biopsies obtained at 5 years after transplantation and progressive arteriosclerosis over time after transplantation associated with shorter telomere length, while this was not the case for other histological lesions. Moreover, telomere attrition augments the association between older donor age and the presence of severe arteriosclerosis. In the group with the oldest donor age and shortest telomere length, there was significantly more severe arteriosclerosis (43%) in protocol biopsies at 5 years after transplantation, compared with other combinations (13–28%) (P = 0.001). Intrarenal arteriosclerosis at 5 years after transplantation did not associate with post-transplant clinical events.
We demonstrate that intrarenal telomere length at 5 years after transplantation, as a marker for replicative senescence, associates with renal arteriosclerosis and reflects kidney donor characteristics, but not post-transplant events.
What is already known about this subject?
• Replicative senescence is associated with telomere shortening. In native kidneys, we recently described and validated a significant association between shorter intrarenal telomere length and renal arteriosclerosis. After renal transplantation, animal experiments suggested accelerated renal allograft senescence.
What this study adds?
• We demonstrate that intrarenal telomere length at 5 years after transplantation, as a marker for replicative senescence, associates with renal arteriosclerosis and reflects kidney donor characteristics, but not post-transplant events.
What impact this may have on practice or policy?
• Donor age proves to be the most important factor in accelerated ageing of the renal graft, and thus is more important than post-transplant events.
INTRODUCTION
Telomeres are complexes of tandem TTAGGG repeats of 5000–15 000 base pairs that reside at the ends of chromosomes [1]. Their main function is to cap these chromosome ends and prevent chromosomal instability [2]. Telomeres shorten by each cell division until a critical length is reached, which leads to permanent and irreversible growth arrest, referred to as replicative senescence [3]. Telomere length is a well-established marker of biological age [4]. Although telomere length is partly heritable, there are major differences in telomere length even among monozygotic twins, which illustrates thatenvironmental factors are important in telomere attrition rate [5].
Accelerated telomere attrition plays a leading role in the development of age-related pathologies like atherosclerosis and cardiovascular disease, as was shown in large epidemiological studies [6]. Obesity and smoking are associated with leucocyte telomere attrition, as well as hypertension, insulin resistance and diabetes, male gender and lower socio-economic status [6–12].
Recently, in a cohort of native kidneys used for transplantation, we illustrated that telomere attrition associates with histology of arteriosclerosis [13]. Arteriosclerosis of the smaller intrarenal arteries was associated with shorter telomere length, independent of potential confounders, including calendar age and cardiovascular risk, which suggests a central role of replicative senescence in the progression of renovascular disease.
Accelerated senescence after transplantation, caused by the cumulative burden of injury and the intrinsic donor characteristics, has been suggested to be one of the main drivers of graft deterioration. In animal studies, there is some evidence that ischaemia–reperfusion injury, acute rejection, drug toxicity and viral infections in the peri- and post-transplant period lead to accelerated senescence [14–16]. In addition, animal models illustrated that renal allograft senescence plays a role in the ability to repair and remodel the transplanted kidneys in order to maintain tissue integrity and function [17]. It remains unclear, however, whether these animal data can be translated to the human situation [18].
Therefore, in the current study in human renal allograft recipients, we evaluated the association between intrarenal telomere length late after transplantation, as a marker of biological age, renal allograft histology, pretransplant donor/recipient demographics and post-transplant clinical events.
MATERIALS AND METHODS
Inclusion and exclusion criteria
All prospective adult recipients of a single kidney transplant, performed between January 2006 and July 2009 at the University Hospitals Leuven (Leuven, Belgium), were eligible for this study. In the University Hospitals Leuven, renal allograft biopsies are routinely performed at time of transplantation and at 3, 12, 24 and 60 months after transplantation, in addition to clinically indicated biopsies. We included all patients with a 5-year protocol biopsy and with a sufficient amount of good-quality kidneyDNA available for the evaluation of telomere length (see below). In this 5-year protocol biopsy cohort, no baseline (time of transplantation) biopsies were available. The start of our baseline biopsy programme started after 2009. The Ethics Committee/Institutional Review Board of the University Hospitals Leuven (Leuven, Belgium) approved this study (OG032; ML7499 and ML9785; ClinicalTrials.gov NCT01331668).
Donor clinical data collection
We obtained clinical donor data from the Eurotransplant database (‘Eurotransplant Donor Report’), which is maintained prospectively and is the central source of donor data for organ transplantation in the Eurotransplant region (www.donordata.eu). We collected the following data: calendar age, gender, cause of death, weight and length, living versus deceased donor, brain death versus cardiac death donor, body mass index, history of hypertension, diabetes mellitus, smoking, history of cardiovascular events prior to donation (including reason for death in deceased donors) and terminal serum creatinine levels before organ recovery. We estimated renal function using the four-variable Modification of Diet in Renal Disease (MDRD) equation [estimated glomerular filtration rate (eGFR)] [19].
Recipient clinical data collection
Clinical demographics of the renal allograft recipients were prospectively collected in electronic clinical patient records and transferred to SAS data files (SAS Institute, Cary, NC, USA). The following data were collected: calendar age at time of transplantation, gender, weight and length, body mass index, new-onset diabetes mellitus after transplantation (defined as the need to start insulin treatment or oral anti-diabetic medication after transplantation), smoking after transplantation, cardiovascular events after transplantation (defined as the occurrence of a cardiovascular event post-transplantation), treated cytomegalovirus (CMV) disease, CMV status as a positive CMV polymerase chain reaction (PCR) (<600 IU/mL/<2.78 log IU/mL) after transplantation, the presence of one or more treated acute rejection episode after transplantation, delayed graft function after transplantation (defined as the need for dialysis in the first 7 days after transplantation), immunosuppressive protocol, serum creatinine levels at 3, 12, 24 and 60 months after transplantation, presence of donor-specifichuman leucocyte antigen (HLA) antibodies (either pretransplant or de novo after transplantation). Post-transplant renal function was estimated by the four-variable MDRD equation (eGFR) [19].
Kidney biopsies and histologic evaluation
One pathologist (E.L.) evaluated all kidney biopsies. We stained the core biopsies with slides containing 4–10 paraffin sections (2 μm) with haematoxylin & eosin, periodic acid–Schiff and a silver methenamine staining method (Jones). An immunohistochemical C4d stain (monoclonal antibody, dilution 1:500, Quidel Corporation, Santa Clara, CA, USA) was performed on frozen tissue. The severity of histologic lesions (tubulitis, interstitial inflammation, intimal arteritis, glomerulitis, interstitial fibrosis, tubular atrophy, arteriolar hyalinosis, vascular intimal thickening, transplant glomerulopathy and increase in mesangial matrix) were scored semiquantitatively according to the updated Banff criteria [20]. In addition, the total number of glomeruli in each biopsy and the number of globally sclerosed glomeruli were calculated separately (0 = <25%; 1 = >25%). Peritubular capillaritis was scored based on the score described in the Banff 2007 classification [21]. C4d deposition in the peritubular capillaries was scored from 0 to 3 (with 0 = negative; 1 = <25%; 2 = 25%–75%; and 3 = <75% of peritubular capillaries positive), given the use of immunohistochemistry on frozen tissue for this marker. Biopsy adequacy was assessed according to the Banff 1997 criteria. Only biopsies with >10 glomeruli were included for the evaluation of glomerulosclerosis.
We calculated delta (Δ) histology as the semiquantitative Banff score of the histological lesion in the 5-year protocol biopsy (range 0–3)—the semiquantitative Banff score of the histological lesion in the 3-month biopsy. Positive values represented biopsies with progression. Zero values represented biopsies without histological progression.
Telomere length in kidney biopsies
We stored half a core of the biopsies performed at 5 years after renal transplantation immediately in Allprotect Tissue Reagent (Qiagen, Venlo, The Netherlands) until extraction. We extracted DNA with the Allprep DNA/RNA/miRNA Universal Kit (Qiagen, Venlo, The Netherlands) on a QIAcube instrument (Qiagen, Venlo, The Netherlands). We determined both DNA yield (ng/µL) and purity ratios A260/280 and A260/230 using a nanodrop ND-1000 spectrophotometer (Isogen Life Science, De Meern, The Netherlands). DNA quality needed to be within strict quality limits (yield 50 ng/µL; purity ratio range 1.5–2 and 1.5–2 for A260/280 and A260/230, respectively) for inclusion. We stored extracted DNA samples at −80°C until further use.
We measured telomere length in renal tissue samples based on a modified quantitative real-time PCR protocol [22]. Telomere lengths were expressed as the telomere repeat copy number relative to a single-copy gene (36B4). DNA samples were diluted to 5 ng and checked using the Quant-iT PicoGreen dsDNA Assay Kit (Life Technologies) to ensure uniform DNA input for PCR quantification. The telomere reaction mixture contained 1× Qiagen QuantiTect SYBR Green Mastermix, 2.5 mM of dithiothreitol, 300 nM of telg primer (5′-ACACTAAGGTTTGGGTTTGGGTTTGGGTTTGGGTTAGTGT-3′) and 900 nM of telc primer (5′-TGTTAGGTATCCCTATCCCTATCCCTATCCCTATCCCTAACA-3′). Telomere PCR conditions were: 1 cycle at 95°C for 10 min, followed by 2 cycles of 15 s at 94°C and 2 min at 49°C, and 30 cycles of 15 s at 94°C, 20 s at 62°C and 1 min 40 s at 74°C. The single-copy gene (36B4) reaction mixture contained 1× Qiagen QuantiTect SYBR Green Mastermix, 300 nM 36B4U primer (5′-CAGCAAGTGGGAAGGTGTAATCC-3′) and 500 nM 36B4D primer (5′-CCCATTCTATCATCAACGGGTACAA-3′). Single-copy gene PCR conditions were: 1 cycle at 95°C for 10 min, followed by 40 cycles at 95°C for 15 s and 58°C for 1 min 10 s. Samples were run in triplicate on an Applied Biosystems 7900HT Fast Real-Time PCR system in a 384-well format. We calculated PCR efficiency based on a six-point serial dilution (20 ng–0.08 ng) of pooled kidney tissue DNA. PCR efficiency was accepted between limits of 90–110%. We calculated relative average telomere lengths using qBase software (Biogazelle, Zwijnaarde, Belgium). Relative telomere length was expressed as the ratio of telomere copy number to single-copy gene number (T/S), relative to the average T/S ratio of the entire population (n = 134). We achieved a coefficient of variation within telomere and single-copy gene triplicates of 0.70% and 0.51%, respectively. All biopsies included passed quality control for assessment of intra-renal telomere length. The results for T/S ratio were normally divided and in the same order of magnitude as the results of our recently published paper [13], where the results were 10log transformed because T/S ratios were not normally distributed in this prior publication. In the current analyses, no log transformation of the data was necessary.
We evaluated accelerated biological ageing by calculating delta (Δ) renal biological age − donor calendar age. Δ (range −3 to 3) was calculated using the difference of quartile telomere length (0 = longest telomere length; 3 = shortest telomere length) − quartile calendar age (0 = youngest age group; 3 = oldest age group). Positive values represented biopsies with older biological than calendar age. Negative values represented biopsies with younger biological age than calendar age.
Statistical analysis
We assessed the associations between the clinical donor and recipient demographics, telomere length and renal histology by linear or regression analysis, as well as Spearman’s correlations. We used multiple linear regressions, with backward parameter selection, to model the determinants of intrarenal telomere length at 5 years after transplantation. For backward parameter selection, we considered the following variables for entry into the model for the determinants of intrarenal telomere length at 5 years: donor calendar age, donor gender, donor history of hypertension, donor history of diabetes mellitus and donor body mass index, donor history of cardiovascular events, living versus deceased donor, brain-death versus cardiac death and renal function (eGFR), recipient calendar age, recipient gender, recipient history of diabetes mellitus, recipient history of cardiovascular events, cold ischaemia time, delayed graft function, treated CMV disease, the presence of one or more treated acute rejection episodes after transplantation (either T-cell-mediated or antibody-mediated), biopsy-proven T-cell-mediated rejection, biopsy-proven antibody-mediated rejection, renal function at 3, 12, 24 and 60 months after transplantation [eGFR (mL/min/1.73 m2)], presence of donor-specific antibodies (pretransplant or de novo post-transplant) and immunosuppressive protocol. We used multiple linear regressions, with backward parameter selection, to model the determinants of the different chronic histological lesions, including the same explanatory parameters.
All tests were two-sided and P-values of <0.05 were considered to indicate statistical significance. The results are expressed as numerical values and percentages for categorical variables and as mean ± standard deviation (SD) for continuous variables, unless otherwise specified. We performed the analyses with SAS (version 9.2; SAS Institute, Cary, NC, USA) and GraphPad Prism (version 5.00; GraphPad Software, San Diego, CA, USA) software.
RESULTS
Population characteristics
Between January 2006 and July 2009, 487 renal transplantations were performed at the University Hospitals Leuven, of which 213 underwent a 5-year protocol biopsy. Of these biopsies, 134 had a sufficient amount of good-quality renal DNA available for the evaluation of telomere length. In this cohort, 579 (n = 125, 3 months; n = 126, 12 months; n = 134, 24 months; and n = 134, 60 months and 73 indications) biopsies were available for histological evaluation. Table 1 summarizes the characteristics of our cohort and the histology of the biopsies that were included. In total, 11/579 biopsies (1.9%) were inadequate according to these criteria and the individual histological features that were not interpretable were excluded from the analyses. All the patients included in this study had an adequate 5-year protocol biopsy.
Demographics and histology of the subjects and biopsies included in this study
| Demographics | Percentage (n) or mean ± SD | ||||
|---|---|---|---|---|---|
| n | 134 | ||||
| Donor characteristics | |||||
| Donor calendar age (years) | 44.5 ± 14.8 | ||||
| Male gender, % (n) | 53.7 (72) | ||||
| Deceased donor, % (n) | 92.6 (124) | ||||
| Brain death/cardiac death, % (n) | 83.0 (103)/14.0 (21) | ||||
| History of hypertension, % (n) | 18.7 (25) | ||||
| History of diabetes mellitus, % (n) | 2.2 (3) | ||||
| History of smoking, % (n) | 25.7 (34) | ||||
| Body mass index (kg/m2) | 25.5 ± 4.3 | ||||
| History of cardiovascular events, % (n) | 38.1 (51) | ||||
| Cold ischaemia time (h) | 14.5 ± 6.4 | ||||
| Recipient characteristics | |||||
| Recipient calendar age (years) | 51.4 ± 12.8 | ||||
| Male gender, % (n) | 53 (71) | ||||
| Repeat transplantation, % (n) | 8.1 (11) | ||||
| Pretransplant donor-specific antibodies, % (n) | 13.4 (18) | ||||
| Post-transplant factors | |||||
| Delayed graft function, % (n) | 10.4 (14/134) | ||||
| Immunosuppressive protocol (CsA-MMF-Cs/ TAC-MMF-Cs/other) | 56/74/4 | ||||
| Presence of one or more treated acute rejection episodes after transplantation, % (n) | 14.9 (20) | ||||
| Biopsy-proven acute cellular rejection, % (n) | 23.8 (32) | ||||
| Acute antibody-mediated rejection, % (n) | 2 (3) | ||||
| Post-transplant diabetes mellitus, % (n) | 27.6 (37) | ||||
| Body mass index at 5 years post-transplant (kg/m2) | 24.9 ± 5.5 | ||||
| Post-transplant cardiovascular events, % (n) | 26.1 (35) | ||||
| Serum creatinine at 3 months (mg/dL) | 1.62 ± 0.45 | ||||
| eGFR at 3 months (mL/min/1.73 m2)a | 46.8 ± 15.0 | ||||
| Serum creatinine at 12 months (mg/dL) | 1.44 ± 0.38 | ||||
| eGFR at 12 months (mL/min/1.73 m2)a | 52.8 ± 15.3 | ||||
| Serum creatinine at 24 months (mg/dL) | 1.46 ± 0.23 | ||||
| eGFR at 24 months (mL/min/1.73 m2)a | 53.0 ± 17.1 | ||||
| Serum creatinine 60 months (mg/dL) | 1.53 ± 0.44 | ||||
| eGFR at 60 months (mL/min/1.73 m2)a | 49.3 ± 14.9 | ||||
| CMV disease, n (%) | 12 (3.4) | ||||
| CMV PCR (<600 IU/mL/<2.78 log IU/mL) , n (%) | 35 (9.9) | ||||
| Biopsy characteristics | 3 months | 1 years | 2 years | 5 years | Indications |
| n | 125 | 126 | 134 | 134 | 73 |
| Telomere length (T/S ratio) | – | – | – | 0.94 ± 0.18 | – |
| Banff arteriolar hyalinosis grade, % (n) | 0 = 76.0 (95) | 0 = 81.7 (103) | 0 = 72.4 (97) | 0 = 32.0 (43) | 0 = 86.4 (63) |
| 1 = 20.8 (26) | 1 = 15.1 (19) | 1 = 22.4 (30) | 1 = 36.6 (49) | 1 = 6.8 (5) | |
| 2–3 = 3.2 (4) | 2–3 = 3.2 (4) | 2–3 = 5.2 (7) | 2–3 = 31.4 (42) | 2–3 = 6.8 (5) | |
| Banff IFTA grade, % (n) | 0 = 79.2 (99) | 0 = 55.6 (70) | 0 = 47.0 (63) | 0 = 36.6 (49) | 0 = 83.6 (61) |
| 1 = 19.2 (24) | 1 = 38.1 (48) | 1 = 36.6 (49) | 1 = 37.3 (50) | 1 = 11.0 (8) | |
| 2–3 = 1.6 (2) | 2–3 = 6.3 (8) | 2–3 = 16.4 (22) | 2–3 = 26.1 (35) | 2–3 = 5.4 (4) | |
| Banff arteriosclerosis grade, % (n) | 0 = 52.8 (66) | 0 = 46.0 (58) | 0 = 44.7 (60) | 0 = 36.6 (49) | 0 = 65.8 (48) |
| 1 = 32.8 (41) | 1 = 34.9 (44) | 1 = 29.9 (40) | 1 = 35.8 (48) | 1 = 13.7 (10) | |
| 2–3 = 14.4 (18) | 2–3 = 19.1 (24) | 2–3 = 25.4 (34) | 2–3 = 27.6 (37) | 2–3 = 20.5 (15) | |
| Presence of >25% glomerulosclerosis, % (n) | 0 = 94.4 (118) | 0 = 93.7 (118) | 0 = 84.3 (113) | 0 = 67.9 (91) | 0 = 94.5 (69) |
| 1 = 5.6 (7) | 1 = 6.3 (8) | 1 = 15.7 (21) | 1 = 32.1 (43) | 1 = 5.5 (4) | |
| Biopsy-proven acute cellular rejection, % (n) | 5.6 (7) | 2.4 (3) | 0.1 (1) | 0.1 (1) | 28.7 (21) |
| Acute antibody-mediated rejection, % (n) | 0.1 (1) | – | – | – | 2.7 (2) |
| Delta histology progression (5 years to 3 months) | |||||
| Delta arteriolar hyalinosis grade ≥1, % (n) | 60.8 (76) | ||||
| Delta IFTA grade ≥1, % (n) | 59.2 (74) | ||||
| Delta arteriosclerosis grade ≥1, % (n) | 42.4 (53) | ||||
| Delta presence of >25% glomerulosclerosis ≥1, % (n) | 29.6 (37) | ||||
In this study, there were 353 excluded patients (79 patients with 5-year protocol biopsy but insufficient amount of good-quality renal DNA available for the evaluation of telomere length + 274 patients without 5-year protocol biopsy).
There were no significant differences between the included patients with a 5-year protocol biopsy available and excluded patients. The demographics of the excluded patients are summarized in Table 2.
Demographics and histology of the subjects and biopsies excluded in this study
| Demographics | Percentage (n) or mean ± SD |
|---|---|
| n | 353 |
| Donor characteristics | |
| Donor calendar age (years) | 44.6 ± 14.7 |
| Male gender, % (n) | 54.9 (195) |
| Deceased donor, % (n) | 94.6 (334) |
| Brain death/cardiac death, % (n) | 85.3 (285)/14.7 (49) |
| History of hypertension, % (n) | 20.2 (71) |
| History of diabetes mellitus, % (n) | 4.9 (14) |
| History of smoking, % (n) | 22.9 (81) |
| Body mass index (kg/m2) | 25.6 ± 4.2 |
| History of cardiovascular events, % (n) | 40.2 (142) |
| Cold ischaemia time | 14.2 ± 6.0 |
| Recipient characteristics | |
| Recipient calendar age (years) | 51.0 ± 11.6 |
| Male gender, % (n) | 56.9 (201) |
| Repeat transplantation, % (n) | 14.4 (51) |
| Post-transplant factors | |
| Delayed graft function | 16.4 (58) |
| Immunosuppressive protocol (CsA-MMF-Cs/TAC-MMF-Cs/other) | 132/198/23 |
| Presence of one or more treated acute rejection episodes after transplantation, % (n) | 16.1% (57) |
| Biopsy-proven acute cellular rejection, % (n) | 24 (85) |
| Acute antibody-mediated rejection, % (n) | 2 (6) |
| Post-transplant diabetes mellitus, % (n) | 30.2 (106) |
| Body mass index at 5 years post-transplant (kg/m2) | 25 ± 5.5 |
| Post-transplant cardiovascular events, % (n) | 27.7 (98) |
| Serum creatinine at 3 months (mg/dL) | 1.63 ± 0.49 |
| eGFR at 3 months (mL/min/1.73 m2)a | 47 ± 17.3 |
| Serum creatinine at 12 months (mg/dL) | 1.43 ± 0.41 |
| eGFR 12 at months (mL/min/1.73 m2)a | 55.0 ± 15.4 |
| Serum creatinine at 24 months (mg/dL) | 1.43 ± 0.39 |
| eGFR at 24 months (mL/min/1.73 m2)a | 55.0 ± 17.3 |
| Serum creatinine 60 months (mg/dL) | 1.47 ± 0.46 |
| eGFR at 60 months (mL/min/1.73 m2)a | 53.7.3 ± 13.6 |
Determinants of intrarenal telomere length
The mean intrarenal log T/S ratio of telomere length at 5 years after transplantation was 0.94 ± 0.18 (range 0.54–1.6). Shorter telomere length correlated with older calendar age (r = 0.28; P = 0.006; Table 3; Figure 1). Donor history of hypertension versus no hypertension (T/S ratio 0.88 ± 0.22 versus 0.98 ± 0.24 with versus without hypertension; P = 0.03) and donor history of cardiovascular events versus no history (T/S ratio 0.91 ± 0.20 versus 1.01 ± 0.19 with versus without history of cardiovascular events; P = 0.002) were also associated with shorter telomere length (Table 3; Figure 1). Male donor kidneys had a shorter intrarenal telomere length compared with female donor kidneys (T/S ratio 0.92 ± 0.19 versus 0.10 ± 0.22; P = 0.02). Other clinical demographics, including history of diabetes mellitus, history of smoking, living versus deceased donation, brain death versus cardiac death, donor body mass index, cold ischaemia time and donor terminal eGFR, were not associated with telomere length.
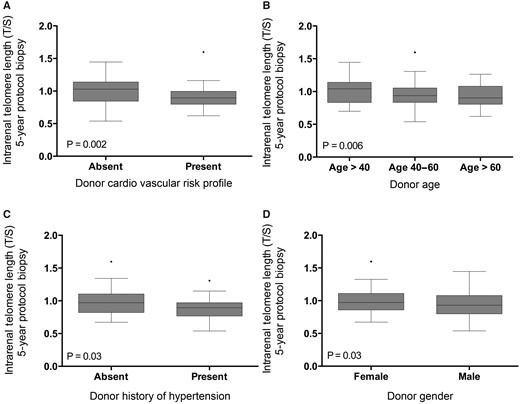
Relation between telomere length and (A) donor cardiovascular risk, (B) donor calendar age, (C) donor history of hypertension and (D) donor gender. The P-values represent non-parametric analysis of variance. The horizontal lines within the boxes indicate means, the upper and lower ends of the boxes indicate standard deviations and the whiskers indicate 95th percentiles.
Clinical determinants of telomere length (log T/S) in 5-year protocol biopsies (n = 134)
| Parameter | Univariate linear regression | Multivariate linear regression | ||||
|---|---|---|---|---|---|---|
| Parameter estimate | Standard error | P-value | Parameter estimate | Standard error | P-value | |
| Donor characteristics | ||||||
| Donor age (per year) | −0.003 | 0.001 | 0.006 | −0.003 | 0.001 | 0.01 |
| Donor gender (female) | 0.08 | 0.04 | 0.02 | 0.1 | 0.04 | 0.002 |
| Heart beating donor/non-heart beating donora | 0.02 | 0.05 | 0.56 | |||
| Living donor/deceased donora | −0.01 | 0.06 | 0.84 | |||
| History of hypertension | −0.01 | 0.04 | 0.02 | −0.1 | 0.04 | 0.03 |
| History of diabetes mellitusa | 0.20 | 0.21 | 0.4 | |||
| History of smokinga | −0.002 | 0.04 | 0.04 | |||
| Body mass indexa (kg/m2) | −0.002 | 0.004 | 0.57 | |||
| History of cardiovascular events | −0.11 | 0.03 | 0.002 | −0.12 | 0.04 | 0.001 |
| eGFR (mL/min/1.73 m2) | 0.00 | 0.00 | 0.57 | |||
| Recipient characteristics | ||||||
| Recipient agea (years) | −0.003 | 0.001 | 0.05 | |||
| Recipient gender (female) | ||||||
| CMV disease | −0.06 | 0.05 | 0.25 | |||
| Presence of one or more treated acute rejection episodes after transplantationa | −0.02 | 0.04 | 0.6 | |||
| Biopsy-proven acute cellular rejection | −0.003 | 0.03 | 0.9 | |||
| Acute antibody-mediated rejection | 0.01 | 0.06 | 0.8 | |||
| Delayed graft functionb | −0.08 | 0.05 | 0.1 | |||
| Pretransplant donor-specific antibody presence | 0.05 | 0.05 | 0.4 | |||
| Immunosuppressive protocol (CsA-MMF-Cs versus TAC-MMF-Cs) | 0.1 | 0.03 | 0.02 | |||
| eGFR 3 months after TX (mL/min/1.73 m2) | 0.00 | 0.00 | 0.5 | |||
| eGFR at 1 year after TX (mL/min/1.73 m2) | −0.05 | 0.04 | 0.1 | |||
| eGFR at 2 years after TX (mL/min/1.73 m2) | −0.05 | 0.03 | 0.2 | |||
| eGFR 5 years after TX (mL/min/1.73 m2) | 0.00 | 0.002 | 0.7 | |||
| Cold ischaemia timea | −0.01 | 0.00 | 0.07 | |||
| Cardiovascular events after transplantationa | −0.05 | 0.04 | 0.2 | |||
| Post-transplant diabetes mellitusa | −0.03 | 0.03 | 0.4 | |||
Univariate analyses were assessed by linear regression. Multiple linear regression, with backward parameter selection, was used to model the determinants of telomere length. Effect sizes (SE) express the change in log T/S ratio associated with given changes in parameters.
These parameters were included in the multivariate models but were not retained in the final model after backward parameter selection.
bThis is defined as the need for dialysis within the first 7 days after transplantation.
CsA, cyclosporine; Cs, corticosteroids; TAC, tacrolimus; TX: transplantation.
In univariate analysis, intrarenal telomere length at 5 years after transplantation inversely correlated with older recipient calendar age (r = −0.24; P = 0.03). None of the other recipient factors or post-transplant events was associated with intrarenal telomere length at 5 years (Table 3). In multivariate linear regression analysis, older calendar age, donor history of cardiovascular events, male donor gender and donor history of hypertension were independent explanatory factors for shorter intrarenal telomere length at 5 years after transplantation (Table 3).
Intrarenal telomere length, clinical demographics and renal histology
In univariate analysis, there was a borderline significant association between intrarenal telomere length at 5 years after transplantation and intrarenal arteriosclerosis (P = 0.09; Table 4). If intrarenal arteriosclerosis was dichotomized in severe arteriosclerosis versus non-severe arteriosclerosis (cv = 0–1 versus cv = 2–3), there was a significant association with intrarenal telomere length (T/S ratio 0.99 ± 0.19 versus 0.91 ± 0.27 in cv = 2–3 versus cv = 0–1; P = 0.03). There was no association between intrarenal telomere length and the other histological lesions (Table 4). Given the collinearity of telomere length with donor demographics (see above), a multivariate analysis was performed, with adjustment for donor age, donor history of hypertension, donor cardiovascular risk and male donor gender, and including an interaction term between telomere length and donor age. In this analysis, intrarenal telomere length significantly and independently associated with intrarenal arteriosclerosis, but not with other histological lesions (Table 4). Moreover, presence of severe arteriosclerosis in renal biopsies associated with donor age (donor age 50.81 ± 18.0 versus 42.81 ± 15.2 in cv = 2–3 versus cv = 0–1; P = 0.003) and donor cardiovascular risk (56% cv versus 37% cardiovascular risk in presence versus absence of severe arteriosclerosis; P = 0.05; Figure 2).
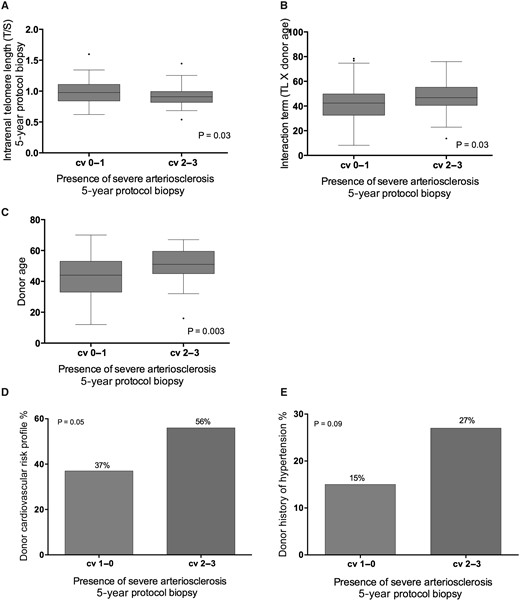
Relation between severe intrarenal arteriosclerosis in the 5-year protocol biopsy and (A) telomere length in the 5-year protocol biopsy, (B) interaction term (telomere length × donor age), (C) donor age, (D) donor history of cardiovascular risk and (E) donor history of hypertension. The P-values represent non-parametric analysis of variance. The horizontal lines within the boxes indicate means, the upper and lower ends of the boxes indicate standard deviations, and the whiskers indicate 95th percentiles. Severe arteriosclerosis was defined as Banff cv score of 2–3.
Clinical determinants of histological lesions in 5-year protocol biopsies (n = 134)
| IFTA grade (Banff score) | Univariate linear regression | Multivariate linear regression | ||||
|---|---|---|---|---|---|---|
| Parameter estimate | Standard error | P-value | Parameter estimate | Standard error | P-value | |
| Telomere length (T/S ) | ||||||
| Donor age (years) | 0.01 | 0.006 | 0.002 | 0.02 | 0.006 | 0.004 |
| Donor age (years) × telomere length | ||||||
| Arteriolar hyalinosis grade (Banff) | ||||||
| Telomere length (T/S ) | ||||||
| Donor age (years) | 0.01 | 0.005 | 0.02 | |||
| Donor age (years) × telomere length | ||||||
| Arteriosclerosis | ||||||
| Telomere length (T/S ) | −0.4 | 0.24 | 0.09 | −0.9 | 0.003 | 0.0001 |
| Donor age (years) | 0.02 | 0.005 | 0.0003 | 0.02 | 0.3 | 0.003 |
| Donor age (years) × telomere length | 0.02 | 0.005 | 0.0005 | |||
| Glomerulosclerosis | ||||||
| Telomere length (T/S ) | ||||||
| Donor age (years) | 0.005 | 0.003 | 0.08 | 0.01 | 0.002 | 0.02 |
| Donor age (years) × telomere length | ||||||
Multiple linear regression with backward parameter selection was used to model the determinants of the 5-year histological lesions. Multivariate analyses presented in this table were performed on 134 subjects. Interaction terms for donor age and donor telomere length were included in the multivariate model (chi-square statistical test). The associations between the histological lesions, telomere length and donor age were adjusted for donor calendar age, donor gender, donor history of hypertension, donor history of diabetes mellitus, donor body mass index and donor history of cardiovascular events.
The significant interaction between donor age and telomere length for association with arteriosclerosis illustrates that the association between intrarenal telomere length and arteriosclerosis depends on donor age. To further elucidate this interaction between calendar age and telomere length, we calculated Δ accelerated biological ageing. This parameter associated significantly with the presence of arteriosclerosis at 5 years after transplantation (range −3 to 3; P = 0.001; Figure 3A). Telomere attrition augments the association between older donor age and the presence of severe arteriosclerosis. In the group with the oldest donor age and shortest telomere length, there was significantly more severe arteriosclerosis (43%) in protocol biopsies at 5 years after transplantation, compared with other combinations (13–28%; Figure 3B).
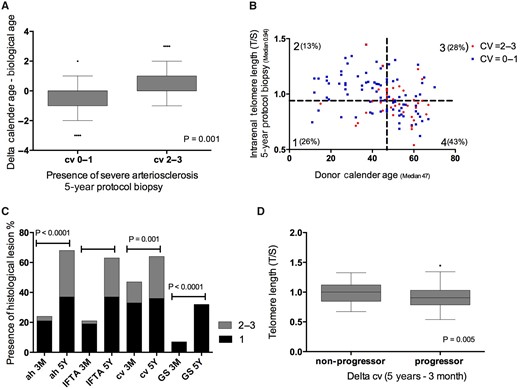
(A) Relation between accelerated ageing and presence of arteriosclerosis in the 5-year protocol biopsy. Accelerated biological ageing was evaluated by calculating delta (Δ) biological age − calendar age. Δ (range −3 to 3) was calculated using the difference of quartile telomere length (0 = longest telomere length; 3 = shortest telomere length) − quartile calendar age (0 = youngest age group; 3 = oldest age group). The P-values represent non-parametric analysis of variance (ANOVA). (B) The correlation between telomere length and donor age in the 5-year protocol biopsies with and without presence of severe arteriosclerosis. The percentage indicates the amount of biopsies with presence of severe arteriosclerosis (cv = 2–3) in the different groups (Group 1 = age <47 years, TL ≤0.94; Group 2 = age <47 years, TL >0.94; Group 3 = age ≥47 years, TL >0.94; Group 4 = age ≥47 years, TL <0.94). Severe arteriosclerosis was defined as Banff cv score 2–3. The P-values represent chi-square testing between Group 4 versus Group 3 (P = 0.001); Group 4 versus Group 1 (P < 0.0001). (C) The evolution of chronic histological lesions between 3 months and 5 years after transplantation. The P-values represent non-parametric ANOVA. (D) Relation between progression of intrarenal arteriosclerosis and intrarenal telomere length in the 5-year protocol biopsies. Delta histology was calculated as the severity of the histological lesion in the 5-year protocol biopsy − the severity of the histological lesion in the 3-month biopsy (range 0–3). Positive values represent biopsies with progression. Zero values represent biopsies without histological progression. The P-value represents non-parametric ANOVA. The horizontal lines within the boxes of the box-whisker plots in this figure indicate means, the upper and lower ends of the boxes indicate standard deviations and the whiskers indicate 95th percentiles.
Progressive arteriosclerosis and telomere length
Next, we evaluated delta histology over time after transplantation (Table 1; Figure 3C). At 3 months, severe arteriosclerosis was present in 14.4% of the biopsies (18/125). At 5 years, severe arteriosclerosis was present in 27.6% (37/134) of the biopsies. Delta cv score was ≥1 in 42% of patients (53/125). Kidneys with the progression of arteriosclerosis had a significantly shorter telomere length at 5 years compared with kidneys without progressive arteriosclerosis (T/S ratio 0.91 ± 0.19 versus 1.00 ± 0.21 with or without progression; P = 0.005; Figure 3D). In addition, arteriosclerosis progression was associated with older donor age (48.8 ± 17.1 versus 42.6 ± 18.3 with or without progression; P = 0.02) and history of cardiovascular events (0.58 ± 0.3 versus 0.39 ± 0.2 with or without progression; P = 0.03). Progression of interstitial fibrosis/tubular atrophy (IFTA) associated with older donor age (donor age 47.5 ± 161 versus 41.3 ± 19.0 years with versus without IFTA; P = 0.01) but not with telomere length. Progression of the other histological lesions (glomerulosclerosis, arteriolar hyalinosis) did not associate with donor age or shorter telomere length.
Sensitivity analysis
To investigate the robustness of our findings, we performed sensitivity analyses in the subgroup of male kidney donors and female kidney donors. In the male subgroup, telomere length correlated significantly with donor age (r = −0.4; P = 0.002) and with history of cardiovascular events (0.92 ± 0.27 versus 1.1 ± 0.39 with versus without history of cardiovascular events; P = 0.0004).
In univariate analysis, there was no association between intrarenal telomere length at 5 years after transplantation and severe arteriosclerosis. When the multivariate analysis was performed, with adjustment for an interaction term between telomere length and donor age, intrarenal telomere length significantly and independently associated with intrarenal arteriosclerosis (T/S ratio 0.94 ± 0.17 versus 0.88 ± 0.14 in cv = 2–3 versus cv = 0–1; P = 0.05). Also in the female subgroup, telomere length correlated significantly with donor age (r = −0.38; P = 0.003) and also with history of cardiovascular events (0.97 ± 0.05 versus 1.0 ± 0.04 with versus without history of cardiovascular events; P = 0.5). When the multivariate analysis was performed, with adjustment for an interaction term between telomere length and donor age, the association between intrarenal telomere length and intrarenal arteriosclerosis reached borderline significance (T/S ratio 0.94 ± 0.15 versus 1.01 ± 0.28 in cv = 2–3 versus cv = 0–1; P = 0.07).
Telomere length and graft function or graft outcome
After the 5-year protocol biopsy, 3.7% of recipients (n = 5) experienced graft failure: two recipients returned to dialysis due to graft loss and three recipients died with a functioning graft. For this, the association between telomere length and graft survival could not be evaluated. There was no association between telomere length and renal function at 3, 12, 24 and 60 months (Table 3).
DISCUSSION
In the current study, we demonstrated that the associations between intrarenal telomere length and older donor calendar age, donor history of hypertension and donor cardiovascular events remain present many years after transplantation, irrespective of post-transplant injury processes. This illustrates the long-term, persisting impact of donor characteristics on kidney graft telomere length, independent of immune and non-immune injury processes after transplantation, such as ischaemia–reperfusion injury, acute rejection and viral infections. Moreover, we confirmed the significant relation between telomere length (biological ageing) and renovascular disease (arteriosclerosis) in our 5-year protocol biopsy cohort. Also here, despite significant progression of arteriosclerosis over time after transplantation, this progression related to pretransplant donor factors, hypertension and cardiovascular risk, and not to post-transplant injury processes.
Recently, we illustrated and validated that shorter (intrarenal) telomere length associates with older calendar age, history of hypertension and cardiovascular events in a cohort of native kidneys before transplantation [13]. This association between shorter telomere length and clinical cardiovascular disease has also been described in the cardiovascular field [6, 9, 24]. Moreover, we described that arteriosclerosis in smaller intrarenal arteries of native kidneys is associated with shorter telomere length, suggesting a significant relation between replicative senescence or biological ageing and renovascular disease [13].
Previous literature suggested that after kidney transplantation, immune and non-immune injury to the kidney can cause accelerated ageing of the graft [16, 18]. An observational study in allogeneic bone marrow transplants found a 15-year acceleration of telomere shortening in the grafted cells [25]. In transplanted renal cells, there is evidence for an increased cell turnover at the time of transplantation and a phase of increased cell regeneration directly after transplantation that correlates with cold ischaemia time [14, 15]. Also, a small study showed that shorter telomere length in biopsies obtained at implantation was associated with lower graft function at 12 months after transplantation, but no correlation with p21 or p53 was found [17]. Günther et al. [26] found a significant association betweenNKG2D and CDKN2A expression and creatinine levels at 24 months after transplantation, but only NKG2D remained significantly predictive in a multivariate model at 12 months.
Luttropp et al. [27] proposed the hypotheses of increased telomere attrition because of the immunosuppressive treatment [more specifically the influence of mycophenolate mofetil (MMF)] in a small study of 47 transplantpatients and a control group.
In human renal transplants with IFTA and impaired graft function, Melk et al. [28] described increased p16 expression, suggestive of accelerated senescence, although this is a non-specific marker, and largely telomere-independent. Furthermore, a rapid increase in p16 expression after transplantation was described in murine kidney grafts, which was most pronounced in older animals [29]. Notwithstanding the aforementioned studies, suggesting the presence of post-transplant accelerated senescence, no definite proof of accelerated telomere shortening has been described in human kidney grafts. In contrast, our findings illustrate that post-transplant telomere length, even 5 years after transplantation, is not primarily dependent on the immune and non-immune factors associated with kidney transplantation. These findings question the hypothesis of accelerated replicative senescence as a consequence of specific injury processes after renal transplantation.
Interestingly, the current study sheds new light on the risk factors for arteriosclerosis (vascular intimal thickening) after renal transplantation. Both in zero-time biopsies [13] and in the current study biopsies at 5 years after transplantation, intrarenal telomere length significantly associated with arteriosclerosis. Moreover, accelerated biological age, expressed as the difference between biological age and calendar age, also associated with intrarenal arteriosclerosis. The robust association of telomere shortening and histology of arteriosclerosis could explain the previously observed association between shorter telomere length and clinical cardiovascular disease, also present in our study. Similarly, in a large cohort study, Loupy et al. [30] recently described a significant association between graft arteriosclerosis and donor-related cardiovascular risk factors (age, diabetes mellitus, cardiovascular risk and hypertension). These authors hypothesized that post-transplant accelerated arteriosclerosis may be partially donor-transmitted. Taken together with our findings, this is convincing evidence that post-transplant arteriosclerosis is, at least partly, a senescence phenomenon. Nevertheless, other factors also likely play a role as well. The study by Loupy et al. [30] has illustrated that antibody-mediated injury could contribute to graft arteriosclerosis. In our analysis, which is underpowered for this analysis due to a very low prevalence of patients with donor-specific antibodies, we could not confirm a role of circulating donor-specific anti-HLA antibodies in the development of arteriosclerosis.
Our study has some limitations. Although donor clinical demographics were collected prospectively, some kidney donor parameters that could be of importance could have been recorded incompletely. This could explain the lack of association between telomere shortening and diabetes mellitus, as was described previously [7, 12]. In addition, we are aware of the fact that our study only includes a relatively low number of patients, with inherent selection bias by the inclusion of only patients with at least 5-year graft survival. In our hospital, 5-year protocol biopsies were routinely performed between 2009 and 2014, but even in this situation, many patients decline participation. Obviously, patients who did not undergo the 5-year protocol biopsy, who lost their graft or who died before 5 years after transplantation were not included in this study. The exclusion of these patients could have impacted the results, likely by underestimation of the histological lesions at 5 years and of the most deleterious post-transplant events (CMV disease and therapy-resistant acute rejection etcetera). Moreover, the low number of patients with antibody-mediated rejection or donor-specific antibodies implies that our study is underpowered to detect an association between these parameters and telomere attrition or 5-year histology. The absence of association in our analysis therefore should not be over-interpreted. We also recognize that, because of the selected study population, associations between telomere length and graft survival could not be explored. Not all ageing processes are mediated by telomere attrition, and no conclusions can be drawn regarding the impact of post-transplant events on these other ageing mechanisms. Finally, the study design does not allow conclusions to be drawn on causality between donor characteristics, post-transplant telomere attrition and post-transplant histology.
In conclusion, we demonstrated that intrarenal telomere length at 5 years after transplantation, as a marker of replicative senescence, is associated with donor characteristics, but not with post-transplant events. Similar to what we observed in native kidneys, post-transplant renal arteriosclerosis primarily represents biological organ ageing. Further study is necessary to elucidate whether telomere attrition plays a role in the long-term outcome after kidney transplantation.
FUNDING
This research was funded by the Clinical Research Foundation of the University Hospitals Leuven; Novartis Research Grant BE1301071489 (87184); European Research Council (ERC-2012-StG 310898); and Research Foundation Flanders (FWO G.0.873.11.N.10).
CONFLICT OF INTEREST STATEMENT
None declared.


Comments