


Abstract
It is unclear if haemodiafiltration improves patient survival compared with standard haemodialysis. Observational studies have tended to show benefit with haemodiafiltration, while meta-analyses have not provided definitive proof of superiority.
Using data from the Australia and New Zealand Dialysis and Transplant Registry, this binational inception cohort study compared all adult patients who commenced haemodialysis in Australia and New Zealand between 2000 and 2014. The primary outcome was all-cause mortality. Cardiovascular mortality was the secondary outcome. Outcomes were measured from the first haemodialysis treatment and were examined using multivariable Cox regression analyses. Patients were censored at permanent discontinuation of haemodialysis or at 31 December 2014. Analyses were stratified by country.
The study included 26 961 patients (4110 haemodiafiltration, 22 851 standard haemodialysis; 22 774 Australia, 4187 New Zealand) with a median follow-up of 5.31 (interquartile range 2.87–8.36) years. Median age was 62 years, 61% were male, 71% were Caucasian. Compared with standard haemodialysis, haemodiafiltration was associated with a significantly lower risk of all-cause mortality [adjusted hazard ratio (HR) for Australia 0.79, 95% confidence interval (95% CI) 0.72–0.87; adjusted HR for New Zealand 0.88, 95% CI 0.78–1.00]. In Australian patients, there was also an association between haemodiafiltration and reduced cardiovascular mortality (adjusted HR 0.78, 95% CI 0.64–0.95).
Haemodiafiltration was associated with superior survival across patient subgroups of age, sex and comorbidity.
INTRODUCTION
Despite gradual improvements in patient survival on haemodialysis, annual crude mortality rates remain high, ranging from 6.6% in Japan to 21.7% in USA [1, 2]. While increasing patient age and comorbidity burden are key contributors to the heightened risk of death, the cardiovascular sequelae of intradialytic haemodynamic instability and uraemic toxin accumulation may also play a role [3–5].
Through mitigation of intradialytic hypotension and enhanced removal of medium and large uraemic toxins, it has been hypothesized that use of haemodiafiltration may confer a survival benefit compared with standard haemodialysis. Several observational studies have supported an association between haemodiafiltration and reduced all-cause and cardiovascular mortality [6–13], although a recent analysis using data from European countries participating in the Dialysis Outcomes and Practice Patterns Study did not detect a survival difference between modalities [14]. A total of four meta-analyses [15–18] have not conclusively supported the superiority of haemodiafiltration. The most consistent finding has been that of an association between high convection volume haemodiafiltration and superior survival, from secondary, post hoc and pooled individual patient data analyses of the randomized trials [13, 19–22]. Although encouraging, such analyses can only be interpreted as observational, since convection volume was not randomized within the studies.
Existing observational studies have been limited by single-centre design, small patient numbers, inclusion of prevalent haemodialysis patients or variable haemodiafiltration practices. Randomized trials have been weakened by flawed methodology, failure to achieve or adequately dose convection volume and insufficient duration and completeness of follow-up. No large study has compared haemodiafiltration and standard haemodialysis outside Europe, and regional practice pattern variation may be significant [23]. In light of these limitations, this study used a population-based approach to compare patient survival on haemodiafiltration and standard haemodialysis in Australia and New Zealand over a 15-year period.
MATERIALS AND METHODS
Study design
This was an inception cohort study using patient records from the Australia and New Zealand Dialysis and Transplant (ANZDATA) Registry. The ANZDATA Registry collects data annually from all units throughout Australia and New Zealand for all people receiving chronic renal replacement therapy. Details of the ANZDATA Registry have been previously described [24].
Study population
All adult patients (≥18 years) who commenced standard haemodialysis or haemodiafiltration in Australia or New Zealand between 1 January 2000 and 31 December 2014 were included in the study, including those who had previously received peritoneal dialysis or a renal transplant. Patients were censored at the time of permanent discontinuation of haemodialysis (i.e. transfer to peritoneal dialysis, renal transplantation, recovery of renal function or loss to follow-up) or at 31 December 2014. Patients who temporarily discontinued haemodialysis (i.e. renal transplantation or peritoneal dialysis with return to haemodialysis) were removed from the risk set but were re-included from the time they re-initiated haemodialysis.
Data collection
ANZDATA records were used for patient demographics (age, sex, race, country), comorbidities (body mass index, chronic lung disease, coronary artery disease, cerebrovascular disease, peripheral vascular disease, diabetes mellitus, smoking status) and dialysis prescription at the commencement of haemodialysis [vascular access type, blood flow rate, treatment time, setting (home, hospital, satellite), erythropoietin use]. The initial mode of haemodialysis was determined at 90 days after the first treatment. The haemodiafiltration group included all patients who received at least one haemodiafiltration treatment during the study period. The ANZDATA Registry updates haemodialysis modality (haemodiafiltration or haemodialysis) and prescription (treatment time, blood flow rate, vascular access) annually; changes in renal replacement therapy modality (haemodialysis, peritoneal dialysis or transplant) and setting (hospital, satellite or home) are updated in real time.
Derived indices included Socio-Economic Indexes for Areas (SEIFA), Accessibility/Remoteness Index of Australia Plus (ARIA+) scores and estimated haemodiafiltration convection volume. SEIFA and ARIA+ scores were developed by the Australian Bureau of Statistics and use postcodes to estimate socio-economic status and residential remoteness. A SEIFA score in the highest decile was considered advantaged, whereas a score in the lowest decile was used to describe socio-economic disadvantage. ARIA+ categories were recorded as 0 to <1 major city, 1 to <3 regional, 3–4 remote. SEIFA and ARIA+ scores were calculable for Australian patients only. There is no equivalent measure calculable for New Zealand patients. Estimates of minimum delivered haemodiafiltration convection volume were derived by multiplying blood flow rate, dialysis hours and a minimum filtration fraction of 0.20, assuming post-dilution haemodiafiltration mode.
Clinical outcomes
The primary outcome was all-cause mortality, measured as the time from the first haemodialysis treatment to death. Cause-specific mortality was estimated using cause of death reported to ANZDATA. Time to cardiovascular death (i.e. death due to myocardial ischaemia, cardiac failure, cardiac arrest, pulmonary oedema or hyperkalaemia) was a secondary outcome.
Statistical analyses
All data were analysed using STATA software package (version 14.0, StataCorp LP, College Station, TX, USA). All reporting was performed in accordance with the Strengthening the Reporting of Observational Studies in Epidemiology (STROBE) guidelines [25].
Baseline characteristics were expressed as patient numbers (n, %), means (±SD) or medians (interquartile range, IQR), as appropriate. Univariable and multivariable Cox regression models were used to examine the primary outcome, overall mortality. Because the ANZDATA Registry records modality changes, haemodialysis modality was treated as a time-varying covariate, where patients could switch from one modality to the other. Multivariable models included all variables with a univariable P-value <0.25. Interaction terms between haemodiafiltration and pre-specified variables (age, sex, race, body mass index and year of haemodialysis start) were examined. Backwards elimination was used to exclude variables or interaction terms that were not confounders [a confounder was defined as >10% change in hazard ratio (HR) for haemodiafiltration], or those that were not statistically significant. Statistically significant was defined as a P-value <0.05 for main effects and P < 0.01 for effect modifiers. Standard errors were adjusted for the clustering of observations within treatment centres using the sandwich estimator [26]. To ensure comparability between the Australian and New Zealand analyses, all variables remaining in either the Australian or New Zealand models were included in the final multivariable models. Modelled survival curves were generated for each country. To test for any cumulative effect of haemodiafiltration, a categorical variable was included in the final model, which estimated the effect of haemodiafiltration treatment for the first year and the effect for >1 year.
Cause-specific Cox regression models were used to examine the association between haemodiafiltration and cardiovascular mortality, and between haemodiafiltration and non-cardiovascular mortality. Competing risk analysis was considered inappropriate given the presence of time-varying covariates, since the Fine and Gray model ‘prohibits the introduction of any time-dependent covariate in the model when death is a competing cause of failure’ [27]. Variables included in the multivariable models were the same as the primary analysis. Pre-specified sub-group analyses were conducted for all-cause and cardiovascular mortality. Subgroups of interest included age, sex, diabetes, obesity, cardiovascular disease and vascular access subtype.
A sensitivity analysis excluding centres that did not practice haemodiafiltration was also performed, as well as a sensitivity analysis adjusting for the clustering of observations within treatment centres using random effects. Proportional hazards assumptions were tested graphically and using Schoenfeld residuals. Overall fit of each model was assessed using Cox–Snell residuals [28]. Individuals with missing data for any variable in the adjusted models were excluded; no imputation was performed for missing data.
RESULTS
Study population
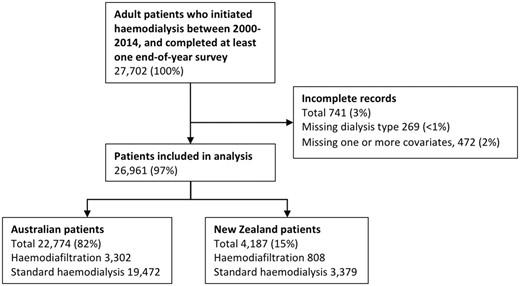
Between 1 January 2000 and 31 December 2014, 27 701 patients commenced haemodialysis in Australia and New Zealand (Figure 1). Of these, 269 patients were excluded due to missing haemodialysis modality data and 472 patients were excluded due to missing data pertaining to one or more covariates in the adjusted models. A total of 26 961 patients were included in the final analysis (22 774 from Australia and 4187 from New Zealand), of whom 4110 underwent at least one treatment with haemodiafiltration (3302 from Australia, 808 from New Zealand). Baseline characteristics of the study population are described in Table 1. Country was a significant effect modifier of provision of haemodiafiltration; therefore, stratified analyses were conducted for Australia and New Zealand.
Baseline characteristics of study cohort of 26 961 patients commencing HD between 1 January 2000 and 31 December 2014
| Australia | New Zealand | Overall | |||||||
|---|---|---|---|---|---|---|---|---|---|
| Never HDF | Ever HDF | Total | Never HDF | Ever HDF | Total | Never HDF | Ever HDF | Total | |
| Number | 19 472 | 3302 | 22 774 | 3379 | 808 | 4187 | 22 851 | 4110 | 26 961 |
| Age, years | |||||||||
| 18–39 | 1864 (10) | 373 (11) | 2237 (10) | 436 (13) | 92 (11) | 528 (13) | 2300 (10) | 465 (11) | 2765 (10) |
| 40–54 | 4184 (21) | 769 (23) | 4953 (22) | 984 (29) | 219 (27) | 1203 (29) | 5168 (23) | 988 (24) | 6156 (23) |
| 55–69 | 6580 (34) | 1225 (37) | 7805 (34) | 1414 (42) | 327 (40) | 1741 (42) | 7994 (35) | 1552 (38) | 9546 (35) |
| 70+ | 6844 (35) | 935 (28) | 7779 (34) | 545 (16) | 170 (21) | 715 (17) | 7389 (32) | 1105 (27) | 8494 (32) |
| Sex | |||||||||
| Female | 7584 (39) | 1234 (37) | 8818 (39) | 1260 (37) | 339 (42) | 1599 (38) | 8844 (39) | 1573 (38) | 10 417 (39) |
| Male | 11 888 (61) | 2068 (63) | 13 956 (61) | 2119 (63) | 469 (58) | 2588 (62) | 14 007 (61) | 2537 (62) | 16 544 (61) |
| Race | |||||||||
| White | 15 009 (77) | 2498 (76) | 17 507 (77) | 1286 (38) | 231 (29) | 1517 (36) | 16 295 (71) | 2729 (66) | 19 024 (71) |
| ATSI | 2200 (11) | 393 (12) | 2593 (11) | 1 (<1) | (0) | 1 (<1) | 2201 (10) | 393 (10) | 2594 (10) |
| MPI | 479 (2) | 140 (4) | 619 (3) | 1883 (56) | 495 (61) | 2378 (57) | 2362 (10) | 635 (15) | 2997 (11) |
| Asian or Indian | 1254 (6) | 191 (6) | 1445 (6) | 171 (5) | 67 (8) | 238 (6) | 1425 (6) | 258 (6) | 1683 (6) |
| Other | 530 (3) | 80 (2) | 610 (3) | 38 (1) | 15 (2) | 53 (1) | 568 (2) | 95 (2) | 663 (2) |
| BMI (kg/m2) | |||||||||
| <18.5 | 651 (3) | 66 (2) | 717 (3) | 51 (2) | 9 (1) | 60 (1) | 702 (3) | 75 (2) | 777 (3) |
| 18.5–30 | 12 814 (66) | 1871 (57) | 14 685 (64) | 1663 (49) | 392 (49) | 2055 (49) | 14 477 (63) | 2263 (55) | 16 740 (62) |
| >30 | 6007 (31) | 1365 (41) | 7372 (32) | 1665 (49) | 407 (50) | 2072 (49) | 7672 (34) | 1772 (43) | 9444 (35) |
| Year | |||||||||
| 2000–04 | 6035 (31) | 558 (17) | 6593 (29) | 1196 (35) | 102 (13) | 1298 (31) | 7231 (32) | 660 (16) | 7891 (29) |
| 2005–09 | 7146 (37) | 1279 (39) | 8425 (37) | 1169 (35) | 318 (39) | 1487 (36) | 8315 (36) | 1597 (39) | 9912 (37) |
| 2010–14 | 6291 (32) | 1465 (44) | 7756 (34) | 1014 (30) | 388 (48) | 1402 (33) | 7305 (32) | 1853 (45) | 9158 (34) |
| Chronic lung disease | |||||||||
| No | 16 242 (83) | 2772 (84) | 19 014 (83) | 2842 (84) | 648 (80) | 3490 (83) | 19 084 (84) | 3420 (83) | 22 504 (83) |
| Yes | 3230 (17) | 530 (16) | 3760 (17) | 537 (16) | 160 (20) | 697 (17) | 3767 (16) | 690 (17) | 4457 (17) |
| Coronary artery disease | |||||||||
| No | 11 108 (57) | 1940 (59) | 13 048 (57) | 2229 (66) | 498 (62) | 2727 (65) | 13 337 (58) | 2438 (59) | 15 775 (59) |
| Yes | 8364 (43) | 1362 (41) | 9726 (43) | 1150 (34) | 310 (38) | 1460 (35) | 9514 (42) | 1672 (41) | 11 186 (41) |
| Cerebrovascular disease | |||||||||
| No | 16 346 (84) | 2830 (86) | 19 176 (84) | 2955 (87) | 703 (87) | 3658 (87) | 19 301 (84) | 3533 (86) | 22 834 (85) |
| Yes | 3126 (16) | 472 (14) | 3598 (16) | 424 (13) | 105 (13) | 529 (13) | 3550 (16) | 577 (14) | 4127 (15) |
| Peripheral vascular disease | |||||||||
| No | 14 059 (72) | 2478 (75) | 16 537 (73) | 2729 (81) | 599 (74) | 3328 (79) | 16 788 (73) | 3077 (75) | 19 865 (74) |
| Yes | 5413 (28) | 824 (25) | 6237 (27) | 650 (19) | 209 (26) | 859 (21) | 6063 (27) | 1033 (25) | 7096 (26) |
| Diabetes mellitus | |||||||||
| No | 10 637 (55) | 1754 (53) | 12 391 (54) | 1565 (46) | 321 (40) | 1886 (45) | 12 202 (53) | 2075 (50) | 14 277 (53) |
| Yes | 8835 (45) | 1548 (47) | 10 383 (46) | 1814 (54) | 487 (60) | 2301 (55) | 10 649 (47) | 2035 (50) | 12 684 (47) |
| Smoking history | |||||||||
| Never smoked | 8768 (45) | 1448 (44) | 10 216 (45) | 1388 (41) | 404 (50) | 1792 (43) | 10 156 (44) | 1852 (45) | 12 008 (45) |
| Current/former | 10 704 (55) | 1854 (56) | 12 558 (55) | 1991 (59) | 404 (50) | 2395 (57) | 12 695 (56) | 2258 (55) | 14 953 (55) |
| SEIFA ranking (Australia) | |||||||||
| Lowest decile | 2165 (11) | 348 (11) | 2513 (11) | – | – | – | 2165 (9) | 348 (8) | 2513 (9) |
| Middle deciles | 15 483 (80) | 2643 (80) | 18 126 (80) | – | – | – | 15 483 (68) | 2643 (64) | 18 126 (67) |
| Highest decile | 1734 (9) | 303 (9) | 2037 (9) | – | – | – | 1734 (8) | 303 (7) | 2037 (8) |
| Unclassified | 81 (<1) | 4 (<1) | 85 (<1) | – | – | – | 81 (<1) | 4 (<1) | 85 (<1) |
| Not reported | 9 (<1) | 4 (<1) | 13 (<1) | – | – | – | 9 (<1) | 4 (<1) | 13 (<1) |
| ARIA+ category (Australia) | |||||||||
| Major city | 13 020 (67) | 2133 (65) | 15 153 (67) | – | – | – | 13 020 (57) | 2133 (52) | 15 153 (56) |
| Regional | 4796 (25) | 967 (29) | 5763 (25) | – | – | – | 4796 (21) | 967 (24) | 5763 (21) |
| Remote | 692 (4) | 168 (5) | 860 (4) | – | – | – | 692 (3) | 168 (4) | 860 (3) |
| Unclassified | 955 (5) | 30 (<1) | 985 (4) | – | – | – | 955 (4) | 30 (<1) | 985 (4) |
| Not reported | 9 (<1) | 4 (<1) | 13 (<1) | – | – | – | 9 (<1) | 4 (<1) | 13 (<1) |
| Vascular access at first HD | |||||||||
| Native | 11 666 (60) | 2038 (62) | 13 704 (60) | 1500 (44) | 262 (32) | 1762 (42) | 13 166 (58) | 2300 (56) | 15 466 (57) |
| Synthetic | 1022 (5) | 176 (5) | 1198 (5) | 95 (3) | 22 (3) | 117 (3) | 1117 (5) | 198 (5) | 1315 (5) |
| Tunnelled CVC | 5921 (30) | 964 (29) | 6885 (30) | 1391 (41) | 423 (52) | 1814 (43) | 7312 (32) | 1387 (34) | 8699 (32) |
| Temporary CVC | 863 (4) | 124 (4) | 987 (4) | 393 (12) | 101 (13) | 494 (12) | 1256 (5) | 225 (5) | 1481 (5) |
| Location at first HD | |||||||||
| Home | 1173 (6) | 74 (2) | 1247 (5) | 467 (14) | 20 (2) | 487 (12) | 1640 (7) | 94 (2) | 1734 (6) |
| Hospital | 8355 (43) | 1370 (41) | 9725 (43) | 2053 (61) | 590 (73) | 2643 (63) | 10 408 (46) | 1960 (48) | 12 368 (46) |
| Satellite | 8645 (44) | 1551 (47) | 10 196 (45) | 551 (16) | 71 (9) | 622 (15) | 9196 (40) | 1622 (39) | 10 818 (40) |
| Not reported | 1299 (7) | 307 (9) | 1606 (7) | 308 (9) | 127 (16) | 435 (10) | 1607 (7) | 434 (11) | 2041 (8) |
| Previous transplant | |||||||||
| No | 15 737 (81) | 2754 (83) | 18 491 (81) | 2851 (84) | 760 (94) | 3611 (86) | 18 588 (81) | 3514 (85) | 22 102 (82) |
| Yes | 3735 (19) | 548 (17) | 4283 (19) | 528 (16) | 48 (6) | 576 (14) | 4263 (19) | 596 (15) | 4859 (18) |
| Previous EPO | |||||||||
| No | 15 737 (81) | 2754 (83) | 18 491 (81) | 2851 (84) | 760 (94) | 3611 (86) | 18 588 (81) | 3514 (85) | 22 102 (82) |
| Yes | 3735 (19) | 548 (17) | 4283 (19) | 528 (16) | 48 (6) | 576 (14) | 4263 (19) | 596 (15) | 4859 (18) |
| Blood flow rate (mL/min) | |||||||||
| < 250 | 1853 (10) | 218 (7) | 2071 (9) | 478 (14) | 69 (9) | 547 (13) | 2331 (10) | 287 (7) | 2618 (10) |
| 250–299 | 4827 (25) | 747 (23) | 5574 (24) | 1204 (36) | 413 (51) | 1617 (39) | 6031 (26) | 1160 (28) | 7191 (27) |
| 300–349 | 10 216 (52) | 1816 (55) | 12 032 (53) | 1346 (40) | 291 (36) | 1637 (39) | 11 562 (51) | 2107 (51) | 13 669 (51) |
| 350+ | 2576 (13) | 521 (16) | 3097 (14) | 351 (10) | 35 (4) | 386 (9) | 2927 (13) | 556 (14) | 3483 (13) |
| Treatment time (h/week) | |||||||||
| <12 | 1548 (8) | 251 (8) | 1799 (8) | 125 (4) | 21 (3) | 146 (3) | 1673 (7) | 272 (7) | 1945 (7) |
| 12–12.9 | 8876 (46) | 1344 (41) | 10 220 (45) | 1359 (40) | 419 (52) | 1778 (42) | 10 235 (45) | 1763 (43) | 11 998 (45) |
| 13–13.9 | 2342 (12) | 498 (15) | 2840 (12) | 340 (10) | 145 (18) | 485 (12) | 2682 (12) | 643 (16) | 3325 (12) |
| 14+ | 4473 (23) | 766 (23) | 5239 (23) | 1069 (32) | 93 (12) | 1162 (28) | 5542 (24) | 859 (21) | 6401 (24) |
| Not reported | 2233 (11) | 443 (13) | 2676 (12) | 486 (14) | 130 (16) | 616 (15) | 2719 (12) | 573 (14) | 3292 (12) |
| Cause of ESKD | |||||||||
| Diabetes | 6598 (34) | 1184 (36) | 7782 (34) | 1587 (47) | 437 (54) | 2024 (48) | 8185 (36) | 1621 (39) | 9806 (36) |
| Glomerulonephritis | 4497 (23) | 776 (24) | 5273 (23) | 771 (23) | 153 (19) | 924 (22) | 5268 (23) | 929 (23) | 6197 (23) |
| Cystic disease | 1219 (6) | 232 (7) | 1451 (6) | 181 (5) | 20 (2) | 201 (5) | 1400 (6) | 252 (6) | 1652 (6) |
| Renovascular | 2849 (15) | 458 (14) | 3307 (15) | 322 (10) | 83 (10) | 405 (10) | 3171 (14) | 541 (13) | 3712 (14) |
| Other | 8570 (44) | 1386 (42) | 9956 (44) | 1214 (36) | 254 (31) | 1468 (35) | 9784 (43) | 1640 (40) | 11 424 (42) |
| Not reported | 53 (<1) | 18 (<1) | 71 (<1) | 22 (<1) | 1 (<1) | 23 (<1) | 75 (<1) | 19 (<1) | 94 (<1) |
Data are presented as n (%).
ATSI, Aboriginal or Torres Strait Islander; BMI, body mass index; CVC, central venous catheter; EPO, erythropoietin; ESKD, end-stage kidney disease; HD, haemodialysis; HDF, haemodiafiltration; MPI, Maori or Pacific Islander.
Inception cohort patients included in analysis.
Of patients who ever received haemodiafiltration, 1014 (25%) started haemodialysis with haemodiafiltration and 3096 (75%) switched from standard haemodialysis to haemodiafiltration after a median of 2.69 (IQR 1.50–4.56) years. There were 2447 (60%) patients who permanently remained on haemodiafiltration after starting or switching, and of the 1663 (40%) patients who did switch off haemodiafiltration, 465 (28%) eventually returned. Median follow-up was 5.31 (IQR 2.87–8.36) years overall, and 3.57 (IQR 1.52–6.16) years on haemodialysis.
The final multivariable models were adjusted for age, sex, race, body mass index, year of haemodialysis start, chronic lung disease, coronary artery disease, cerebrovascular disease, peripheral vascular disease, diabetes, smoking status, vascular access type, previous transplant, initial treatment with haemodialysis, blood flow rate, weekly treatment time and dialysis setting. There were no significant interactions between variables.
Compared with patients who received standard haemodialysis, those receiving haemodiafiltration were more likely to be obese or diabetic, and were less likely to be Caucasian, aged ≥70 years, or to dialyse at home. Haemodiafiltration patients were less likely to have received a previous kidney transplant, but were more likely to have undergone prior renal replacement therapy. There was no difference in the proportion of patients with pre-existing cardiovascular disease or use of permanent vascular access between groups.
Dialysis characteristics were assessed after 12 months of stabilization on either haemodiafiltration or standard haemodialysis (Table 2). Compared with patients receiving standard haemodialysis, a greater proportion of haemodiafiltration patients had a blood flow rate ≥350 mL/min and used a high-flux dialyser. A smaller proportion of haemodiafiltration patients performed quotidian (3.5+ sessions per week) or extended hour (>5 h per session) dialysis, and fewer required erythropoietin. Vascular access and phosphate control were comparable between cohorts at 12 months.
Dialysis characteristics following 12 months of stabilization of 18 972 incident patients commencing HDF or standard HD between 1 January 2000 and 31 December 2014
| Australia | New Zealand | Overall | |||||||
|---|---|---|---|---|---|---|---|---|---|
| HD | HDF | Total | HD | HDF | Total | HD | HDF | Total | |
| Total | 15 242 | 985 | 16 227 | 2455 | 290 | 2745 | 17 697 | 1275 | 18 972 |
| Last vascular access | |||||||||
| Native | 12 164 (80) | 816 (83) | 12 980 (80) | 1806 (74) | 173 (60) | 1979 (72) | 13 970 (79) | 989 (78) | 14 959 (79) |
| Synthetic | 1289 (8) | 67 (7) | 1356 (8) | 127 (5) | 8 (3) | 135 (5) | 1416 (8) | 75 (6) | 1491 (8) |
| Central venous catheter | 1789 (12) | 102 (10) | 1891 (12) | 522 (21) | 109 (38) | 631 (23) | 2311 (13) | 211 (17) | 2522 (13) |
| Blood flow rate (mL/min) | |||||||||
| <250 | 562 (4) | 17 (2) | 579 (4) | 188 (8) | 9 (3) | 197 (7) | 750 (4) | 26 (2) | 776 (4) |
| 250–299 | 2433 (16) | 103 (10) | 2536 (16) | 598 (24) | 82 (28) | 680 (25) | 3031 (17) | 185 (15) | 3216 (17) |
| 300–349 | 8849 (58) | 564 (57) | 9413 (58) | 1186 (48) | 169 (58) | 1355 (49) | 10 035 (57) | 733 (57) | 10 768 (57) |
| 350+ | 3398 (22) | 301 (31) | 3699 (23) | 483 (20) | 30 (10) | 513 (19) | 3881 (22) | 331 (26) | 4212 (22) |
| Haemodialyser type | |||||||||
| Low flux | 4378 (29) | 8 (<1) | 4386 (27) | 1438 (59) | 0 (0) | 1438 (52) | 5816 (33) | 8 (<1) | 5824 (31) |
| High flux | 10 863 (71) | 977 (99) | 11 840 (73) | 1017 (41) | 290 (100) | 1307 (48) | 11 880 (67) | 1267 (99) | 13 147 (69) |
| Not reported | 1 (<1) | 0 (0) | 1 (<1) | 0 (0) | 0 (0) | 0 (0) | 1 (<1) | 0 (0) | 1 (<1) |
| Treatment time (per session) (h) | |||||||||
| <3 | 71 (<1) | 6 (<1) | 77 (<1) | 2 (<1) | 0 (0) | 2 (<1) | 73 (<1) | 6 (<1) | 79 (<1) |
| 3–3.9 | 892 (6) | 57 (6) | 949 (6) | 82 (3) | 8 (3) | 90 (3) | 974 (6) | 65 (5) | 1039 (5) |
| 4–4.9 | 9497 (62) | 608 (62) | 10 105 (62) | 1303 (53) | 236 (81) | 1539 (56) | 10 800 (61) | 844 (66) | 11 644 (61) |
| 5+ | 4781 (31) | 314 (32) | 5095 (31) | 1068 (44) | 46 (16) | 1114 (41) | 5849 (33) | 360 (28) | 6209 (33) |
| Not reported | 1 (<1) | 0 (0) | 1 (<1) | 0 (0) | 0 (0) | 0 (0) | 1 (<1) | 0 (0) | 1 (<1) |
| Frequency (per week) | |||||||||
| <3 | 370 (2) | 22 (2) | 392 (2) | 35 (1) | 3 (1) | 38 (1) | 405 (2) | 25 (2) | 430 (2) |
| 3–3.4 | 13 898 (91) | 938 (95) | 14 836 (91) | 2170 (88) | 284 (98) | 2454 (89) | 16 068 (91) | 1222 (96) | 17 290 (91) |
| 3.5–3.9 | 403 (3) | 1 (<1) | 404 (2) | 102 (4) | 0 (0) | 102 (4) | 505 (3) | 1 (<1) | 506 (3) |
| 4+ | 570 (4) | 24 (2) | 594 (4) | 148 (6) | 3 (1) | 151 (6) | 718 (4) | 27 (2) | 745 (4) |
| Not reported | 1 (<1) | 0 (0) | 1 (<1) | 0 (0) | 0 (0) | 0 (0) | 1 (<1) | 0 (0) | 1 (<1) |
| Estimated minimum convection volume (L)a | |||||||||
| <17 | – | 588 (60) | – | – | 238 (82) | – | – | 826 (65) | – |
| 17–19 | – | 261 (26) | – | – | 31 (11) | – | – | 292 (23) | – |
| 20–22 | – | 92 (9) | – | – | 9 (3) | – | – | 101 (8) | – |
| 22+ | – | 44 (4) | – | – | 12 (4) | – | – | 56 (4) | – |
| Phosphate (mmol/L) | |||||||||
| <1.6 | 7222 (47) | 477 (48) | 7699 (47) | 817 (33) | 113 (39) | 930 (34) | 8039 (45) | 590 (46) | 8629 (45) |
| 1.6+ | 7115 (47) | 500 (51) | 7615 (47) | 1494 (61) | 177 (61) | 1671 (61) | 8609 (49) | 677 (53) | 9286 (49) |
| Not reported | 905 (6) | 8 (<1) | 913 (6) | 144 (6) | 0 (0) | 144 (5) | 1049 (6) | 8 (<1) | 1057 (6) |
| Haemoglobin (g/L) | |||||||||
| <100 | 2106 (14) | 121 (12) | 2227 (14) | 506 (21) | 62 (21) | 568 (21) | 2612 (15) | 183 (14) | 2795 (15) |
| 100–119 | 7401 (49) | 528 (54) | 7929 (49) | 1122 (46) | 157 (54) | 1279 (47) | 8523 (48) | 685 (54) | 9208 (49) |
| 120+ | 5682 (37) | 336 (34) | 6018 (37) | 822 (33) | 71 (24) | 893 (33) | 6504 (37) | 407 (32) | 6911 (36) |
| Not reported | 53 (<1) | 0 (0) | 53 (<1) | 5 (<1) | 0 (0) | 5 (<1) | 58 (<1) | 0 (0) | 58 (<1) |
| Erythropoietin use | |||||||||
| Yes | 3025 (20) | 160 (16) | 3185 (20) | 706 (29) | 42 (14) | 748 (27) | 3731 (21) | 202 (16) | 3933 (21) |
| No | 12 217 (80) | 825 (84) | 13 042 (80) | 1749 (71) | 248 (86) | 1997 (73) | 13 966 (79) | 1073 (84) | 15 039 (79) |
Data are presented as n (%).
For HDF patients only, calculated using the formula: blood flow rate (L/min) × treatment time per session (min) × 0.20 (minimum filtration fraction).
HD, haemodialysis; HDF, haemodiafiltration.
All-cause mortality
There were 11 503 deaths during the study period (753 in the haemodiafiltration group, 10 750 in the standard haemodialysis group). The crude mortality rate was lower in patients who received haemodiafiltration compared with those managed with standard haemodialysis (8.87 versus 14.95 deaths per 100 patient-years). Crude median survival for patients on haemodiafiltration was 6.30 (IQR 3.26–11.42) years, compared with 6.26 (IQR 2.92–not reached) years for patients who received standard haemodialysis. In the multivariable model, haemodiafiltration was independently associated with a significantly lower risk of death across both countries (HR for Australia 0.79, 95% CI 0.72–0.87, P < 0.001; HR for New Zealand 0.88, 95% CI 0.78–1.00, P = 0.05) (Table 3, Figures 2 and 3). There was evidence of a decreasing beneficial effect of haemodiafiltration over time for patients in New Zealand (P < 0.001) (Table 4). A similar pattern was observed for Australia, but there was insufficient evidence to conclude that the benefits of haemodiafiltration changed over time (P = 0.09).
Multivariable Cox regression analysis of survival in 26 961 patients who commenced HD in Australia and New Zealand between 2000 and 2014
| Covariates | Australia | New Zealand | ||||
|---|---|---|---|---|---|---|
| HR | 95% CI | P-value | HR | 95% CI | P-value | |
| Haemodiafiltration | <0.001 | 0.05 | ||||
| No | 1.00 | – | 1.00 | – | ||
| Yes | 0.79 | 0.72–0.87 | 0.88 | 0.78–1.00 | ||
| Age (years) | <0.001 | <0.001 | ||||
| 18–39 | 1.00 | – | 1.00 | – | ||
| 40–54 | 1.49 | 1.29–1.72 | 1.11 | 0.96–1.28 | ||
| 55–69 | 1.87 | 1.64–2.14 | 1.51 | 1.23–1.84 | ||
| 70+ | 2.75 | 2.38–3.18 | 2.15 | 1.74–2.67 | ||
| Sex | <0.001 | <0.001 | ||||
| Female | 1.00 | – | 1.00 | – | ||
| Male | 1.14 | 1.08–1.19 | 1.19 | 1.15–1.23 | ||
| Race | <0.001 | <0.001 | ||||
| White | 1.00 | – | 1.00 | – | ||
| ATSI | 1.04 | 0.91–1.20 | – | – | ||
| MPI | 0.73 | 0.64–0.84 | 0.97 | 0.85–1.11 | ||
| Asian or Indian | 0.63 | 0.59–0.68 | 0.74 | 0.67–0.82 | ||
| Othera | 0.69 | 0.57–0.83 | 0.86 | 0.65–1.13 | ||
| BMI (kg/m2) | <0.001 | 0.004 | ||||
| 0–18.4 (Underweight) | 1.44 | 1.27–1.63 | 1.39 | 1.02–1.90 | ||
| 18.5–29.9 (Normal–Overweight) | 1.00 | – | 1.00 | – | ||
| 30+ (Obese–Extremely Obese) | 0.88 | 0.83–0.93 | 1.07 | 1.00–1.14 | ||
| Vascular access | <0.001 | <0.001 | ||||
| Native | 1.00 | – | 1.00 | – | ||
| Synthetic | 1.12 | 1.04–1.21 | 1.07 | 0.90–1.26 | ||
| Tunnelled CVC | 1.89 | 1.75–2.03 | 1.67 | 1.48–1.87 | ||
| Temporary CVC | 2.18 | 1.82–2.61 | 1.99 | 1.59–2.49 | ||
| ESKD start | <0.001 | 0.1 | ||||
| 2000–04 | 1.00 | – | 1.00 | – | ||
| 2005–09 | 0.92 | 0.86–0.97 | 0.94 | 0.88–1.00 | ||
| 2010–14 | 0.87 | 0.80–0.94 | 0.92 | 0.73–1.15 | ||
| Chronic lung disease | <0.001 | <0.001 | ||||
| No | 1.00 | – | 1.00 | – | ||
| Yes | 1.27 | 1.21–1.32 | 1.22 | 1.09–1.37 | ||
| Coronary artery disease | <0.001 | <0.001 | ||||
| No | 1.00 | – | 1.00 | – | ||
| Yes | 1.30 | 1.23–1.37 | 1.58 | 1.47–1.71 | ||
| Cerebrovascular disease | <0.001 | 0.01 | ||||
| No | 1.00 | – | 1.00 | – | ||
| Yes | 1.27 | 1.20–1.33 | 1.16 | 1.03–1.31 | ||
| Peripheral vascular disease | <0.001 | <0.001 | ||||
| No | 1.00 | – | 1.00 | – | ||
| Yes | 1.25 | 1.18–1.31 | 1.26 | 1.11–1.42 | ||
| Diabetes (any type) | <0.001 | 0.004 | ||||
| No | 1.00 | – | 1.00 | – | ||
| Yes | 1.26 | 1.19–1.33 | 1.15 | 1.05–1.27 | ||
| Smoking status | 0.01 | 0.001 | ||||
| Never smoked | 1.00 | – | 1.00 | – | ||
| Current/former | 1.06 | 1.01–1.11 | 1.17 | 1.07–1.28 | ||
| Previous transplant | <0.001 | <0.001 | ||||
| No | 1.00 | – | 1.00 | – | ||
| Yes | 0.47 | 0.39–0.56 | 0.38 | 0.27–0.54 | ||
| Initial treatment with HD | 0.8 | 0.04 | ||||
| No | 1.00 | – | 1.00 | – | ||
| Yes | 0.99 | 0.93–1.06 | 0.88 | 0.78–1.00 | ||
| Blood flow rate (mL/min) | <0.001 | <0.001 | ||||
| <250 | 1.00 | – | 1.00 | – | ||
| 250–299 | 0.89 | 0.76–1.04 | 0.65 | 0.51–0.81 | ||
| 300–349 | 0.75 | 0.61–0.91 | 0.54 | 0.44–0.66 | ||
| 350+ | 0.65 | 0.53–0.79 | 0.59 | 0.46–0.75 | ||
| Treatment time | <0.001 | <0.001 | ||||
| Each additional hour per week | 0.93 | 0.92–0.94 | 0.95 | 0.93–0.97 | ||
| Dialysis location | <0.001 | <0.001 | ||||
| Home | 0.56 | 0.48–0.65 | 0.57 | 0.46–0.71 | ||
| Hospital | 1.00 | – | 1.00 | – | ||
| Satellite | 0.64 | 0.59–0.70 | 0.61 | 0.50–0.74 | ||
For the New Zealand analysis, Aboriginal and Torres Strait Islander was categorized as Other. ATSI, Aboriginal or Torres Strait Islander; BMI, body mass index; CVC, central venous catheter; HD, haemodialysis; HFD, haemodiafiltration; MPI, Maori or Pacific Islander.
Multivariable Cox regression model comparing all-cause mortality and multivariable cause-specific regression models comparing cardiovascular and non-cardiovascular mortality for an overall effect of haemodiafiltration compared with a difference in effect between the first 12 months of haemodialysis and subsequent years.
| Country | Outcome | Overall effect | Haemodiafiltration effect over time | |||
|---|---|---|---|---|---|---|
| HR (95% CI) | P-value | First 12 months HR (95% CI) | More than 1 year HR (95% CI) | P-value for change over time | ||
| Australia | All-cause mortality | 0.79 (0.72–0.87) | <0.001 | 0.55 (0.35–0.87) | 0.81 (0.74–0.89) | 0.09 |
| Australia | Cardiovascular mortality | 0.79 (0.65–0.96) | 0.01 | 0.71 (0.38–1.34) | 0.80 (0.66–0.96) | 0.76 |
| Australia | Non-cardiovascular mortality | 0.80 (0.73–0.88) | <0.001 | 0.74 (0.56–0.99) | 0.82 (0.74–0.90) | 0.53 |
| New Zealand | All-cause mortality | 0.88 (0.78–1.00) | 0.05 | 0.67 (0.54–0.83) | 0.90 (0.79–1.03) | 0.01 |
| New Zealand | Cardiovascular mortality | 1.09 (0.85–1.41) | 0.48 | 0.59 (0.38–0.91) | 1.21 (0.91–1.60) | 0.002 |
| New Zealand | Non-cardiovascular mortality | 0.77 (0.70–0.86) | <0.001 | 0.56 (0.45–0.70) | 0.82 (0.72–0.94) | 0.007 |
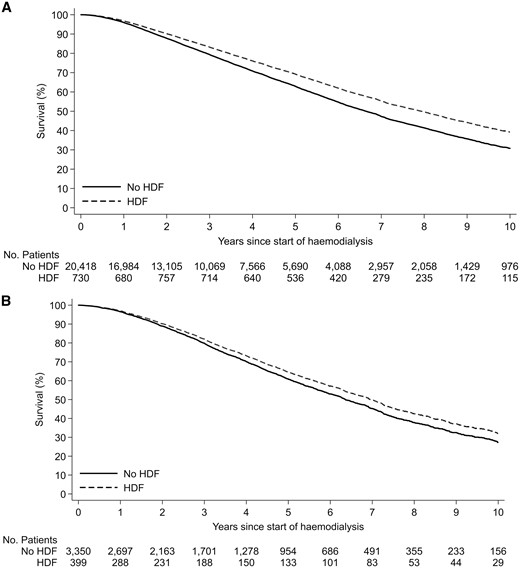
Modeled survival curves comparing patient survival between 4110 patients managed with haemodiafiltration (HDF) and 22 851 patients managed with haemodialysis by country. The difference between the groups was statistically significant for (A) Australia (P < 0.001) and (B) New Zealand (P < 0.001).
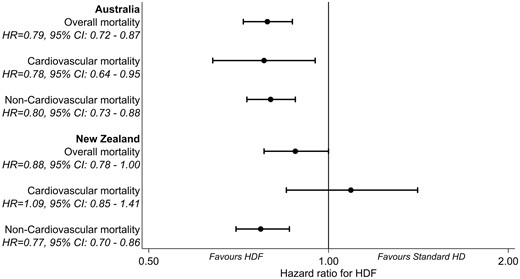
Multivariable Cox regression model comparing all-cause mortality and multivariable cause-specific regression models comparing cardiovascular and non-cardiovascular mortality between 4110 patients managed with haemodiafiltration (HDF) and 22 851 patients managed with standard haemodialysis by country.
Cardiovascular mortality
A total of 3957 patients died from cardiovascular causes (269 in the haemodiafiltration group, 3688 in the standard haemodialysis group). The risk of cardiovascular death was lower in patients receiving haemodiafiltration in Australia (HR 0.78, 95% CI 0.64–0.95, P = 0.01), but not in New Zealand (HR 1.09, 95% CI 0.85–1.41, P = 0.48), compared with patients managed with standard haemodialysis (Figure 3).
The cause-specific survival curves for cardiovascular and non-cardiovascular causes of death are presented in Figure 4. In both countries, haemodiafiltration was associated with a lower risk of non-cardiovascular death compared with standard haemodialysis. Haemodiafiltration was also associated with a reduced risk of cardiovascular death in Australian patients, but there was no evidence of any haemodiafiltration effect for cardiovascular death in New Zealand patients.
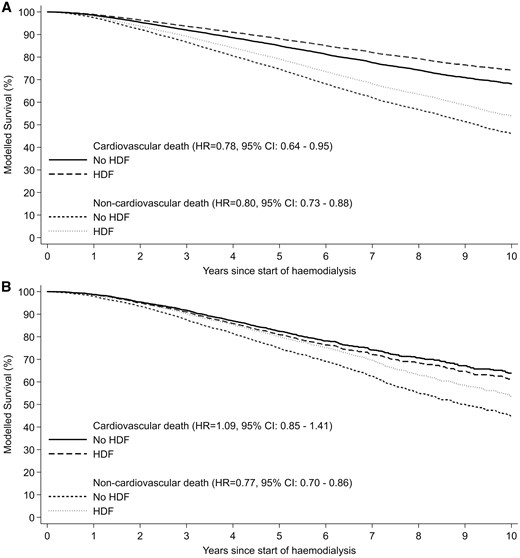
Multivariable cause-specific regression models comparing cardiovascular and non-cardiovascular mortality between 4110 patients managed with haemodiafiltration (HDF) and 22 851 patients managed with standard haemodialysis by country. (A) Australia, (B) New Zealand
Subgroup analyses
There was no significant interaction between all-cause mortality and any patient subgroup in Australian patients (Figure 5). In New Zealand patients, haemodiafiltration was associated with a greater reduction in all-cause mortality in patients aged <65 years (HR 0.76, 95% CI 0.63–0.91), compared with those aged ≥65 years (HR 1.04, 95% CI 0.89–1.22; P-value for interaction 0.004), and in diabetic patients (HR 0.84, 95% CI 0.70–1.01) more so than non-diabetic patients (HR 0.94, 95% CI 0.85–1.03; P-value for interaction <0.001).
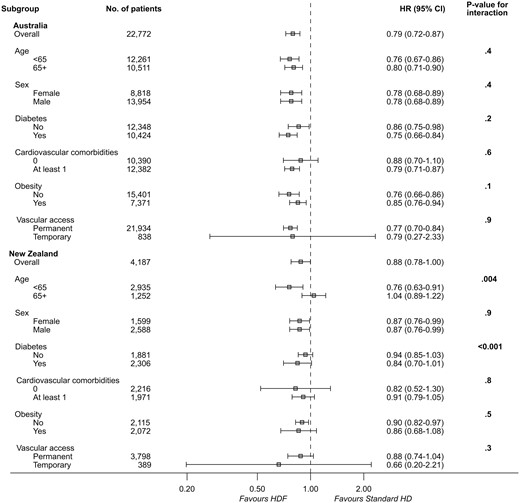
Multivariable Cox regression model comparing all-cause mortality by patient subgroup in 4110 patients managed with haemodiafiltration (HDF) and 22 851 patients managed with standard haemodialysis (HD) by country.
There was no significant interaction between cardiovascular mortality and any patient subgroup in Australian patients (Figure 6). In New Zealand patients, haemodiafiltration was associated with an increased risk of cardiovascular mortality in patients aged ≥65 years (HR 1.56, 95% CI 1.23–1.99) compared with those aged <65 years (HR 0.88, 95% CI 0.63–1.22; P-value for interaction <0.001), and in non-diabetic patients (HR 1.45, 95% CI 1.19–1.78) compared with diabetic patients (HR 0.96, 95% CI 0.72–1.27; P-value for interaction <0.001).
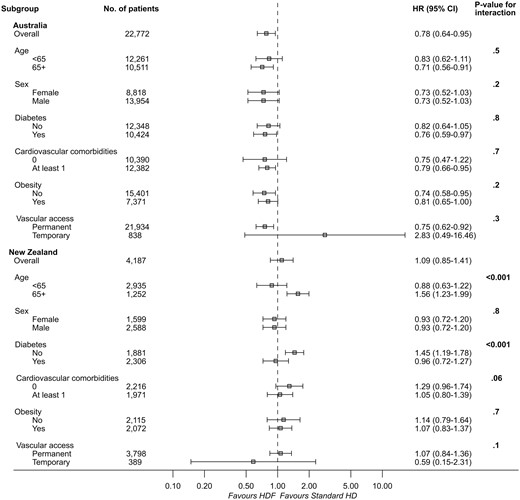
Multivariable Cox regression model comparing cardiovascular mortality by patient subgroup in 4110 patients managed with haemodiafiltration (HDF) and 22 851 patients managed with standard haemodialysis (HD) by country.
Sensitivity analyses
When patients managed by centres that did not practice haemodiafiltration were excluded from the analysis, the association between haemodiafiltration and reduced all-cause mortality remained significant for both Australian (HR 0.79, 95% CI 0.72–0.87) and New Zealand (HR 0.88, 95% CI 0.78–1.00) patients. Similarly, there was an association between haemodiafiltration and reduced cardiovascular mortality in Australian patients (HR 0.78, 95% CI 0.64–0.95), but not in New Zealand patients (HR 1.09, 95% CI 0.85–1.41). There were no differences in outcome when clustering of observations within treatment centres was adjusted for as a random effect.
DISCUSSION
In this large, population-based cohort of patients from Australia and New Zealand who were followed for >5 years, haemodiafiltration was associated with a significantly decreased risk of all-cause mortality compared with standard haemodialysis, even after adjustment for multiple potential confounders. In Australian patients, there was also an association between haemodiafiltration and reduced cardiovascular mortality, which was not demonstrated in patients from New Zealand. The beneficial effect of haemodiafiltration on survival was demonstrated across patient subgroups of age, sex and comorbidity, and remained significant after exclusion of non-haemodiafiltration centres.
The findings of this study are in keeping with the existing observational data [6–12] and meta-analyses by Mostovaya et al. [15] and Peters et al. [22], which reported an association between haemodiafiltration and decreased risks of all-cause and cardiovascular mortality compared with standard haemodialysis. However, superiority of haemodiafiltration was not confirmed by three other meta-analyses [16–18]. Nistor et al. [16] compared convective therapies (haemodiafiltration, haemofiltration, acetate-free biofiltration) to standard haemodialysis, and found no difference in all-cause mortality between groups. They did report a reduction in the risk of cardiovascular mortality, which was also demonstrated by Susantitaphong et al. [18] when they compared convective therapies (high-flux haemodialysis, haemofiltration or haemodiafiltration) to low-flux haemodialysis. No survival benefit or reduction in cardiovascular events was found in a meta-analysis by Wang et al. [17], who compared haemodiafiltration or haemofiltration to standard haemodialysis.
Inconsistency between meta-analyses may be the result of differences in study inclusion criteria or the definition of convective dialysis. Importantly, their findings must be interpreted within the limitations of their constituent studies, some of which have been criticized for being of low quality and inadequate statistical power, and having a high risk of bias. In contrast to the present study, the completeness and duration of patient follow-up in many of the randomized trials may have been insufficient to detect a difference in outcome between the groups, and other aspects of their methodology may have introduced bias, especially attrition bias and selective outcome reporting bias. On the other hand, the potential for residual confounding or selection bias could not be excluded from the present study, despite the use of adjusted models.
There are biologically plausible reasons why haemodiafiltration may confer a survival benefit compared with standard haemodialysis. First, retention of uraemic toxins has been linked to accelerated atherosclerosis, which increases the risk of death [3–5]. Augmented removal of middle and large-sized molecules by haemodiafiltration may reduce the burden of cardiovascular disease [29, 30]. Secondly, haemodiafiltration has been associated with enhanced intradialytic haemodynamic stability, potentially mediated by cooling of the extracorporeal circuit. This could protect against the development of dialysis-induced cardiac damage [21, 31], although one small randomized trial examining the intradialytic cardiac changes of haemodiafiltration did not demonstrate a reduction in regional wall motion abnormalities compared with standard haemodialysis [32]. Finally, the use of ultrapure dialysis fluid and high-flux synthetic membranes allows optimal biocompatibility of the system, which is thought to reduce systemic inflammation and oxidative stress [33–35].
The difference in the risk of cardiovascular death between Australia and New Zealand is noteworthy. Whether this finding relates to a lower number of individuals exposed to haemodiafiltration and/or to a lower number of cardiovascular death events remains uncertain. Differences in the patient population (e.g. age and proportion of patients with ischaemic heart disease) and dialysis practices (e.g. treatment time and dialysis setting) between the two countries may also have played a role. Alternatively, it may reflect residual confounding or cause of death coding bias.
This binational inception cohort study complements the existing haemodiafiltration literature as the largest observational study to be performed outside Europe. Its strengths lie in the use of a population-based approach, comprehensive multivariable models and extended duration and completeness of follow-up. However, through use of population-based data, specific details of the dialysis prescription (including convection volume, dialysate prescription, substitution modality, substitution and dialysate flow rates and ultrafiltration rate), residual renal function, blood pressure, volume control, middle molecule clearance and inflammation and nutrition markers cannot be known, since they are not collected by the registry. Furthermore, data on haemodialysis modality were collected annually by the registry so the exact exposure time of haemodiafiltration cannot be determined. Although residual confounding and treatment modality selection bias could not be excluded, sensitivity analyses and a thorough analytic approach were employed to minimize the potential for bias.
Although the results of this study are hypothesis generating, strong recommendations for or against the routine use of haemodiafiltration in clinical practice cannot be made. Similarly, while emerging data from post hoc, secondary and pooled individual participant data analyses of the randomized trials have supported a more consistent benefit in patients receiving the highest convection volumes of haemodiafiltration [22, 36, 37], superiority of this approach has not been demonstrated in an adequately powered randomized trial.
The theoretical benefit of haemodiafiltration must also be weighed against any potential risks of this modality, including the infusion of large volumes of ultrapure dialysate, or an unjustified cost to health services. The latter is a controversial issue, with the comparative cost of haemodiafiltration and high-flux haemodialysis being dependent on the expense associated with disposable tubing sets, sterilizing ultrafilters and the requirement for augmented microbiological monitoring of water and dialysis fluid. Two prospective studies have reported that haemodiafiltration is either marginally more expensive or cheaper than high-flux haemodialysis, depending on the choice of consumables, substitution modality and need for additional water quality testing [38, 39]. However, in cost-effectiveness analyses, which considered the worth of improved survival and health related quality of life, haemodiafiltration was considered to be a cost-effective treatment compared with both low-flux haemodialysis [40] and high-flux haemodialysis [41].
In summary, the findings of this study suggest that haemodiafiltration may confer a survival advantage compared with standard haemodialysis in Australian and New Zealand patients. This benefit was independent of other factors previously associated with mortality, including treatment time, vascular access and comorbidity burden. However, in the absence of robust, high quality evidence demonstrating a consistent benefit with haemodiafiltration compared with standard haemodialysis, widespread uptake in clinical practice is not currently supported. While this study provides further evidence that haemodiafiltration may improve outcomes, exploration of the merit and cost-effectiveness of high convection volume haemodiafiltration warrants consideration in randomized trials.
ACKNOWLEDGEMENTS
We acknowledge the substantial contributions of the entire Australian and New Zealand nephrology community (physicians, surgeons, database managers, nurses, renal operators and patients) in providing information for and maintaining the ANZDATA Registry database. The ANZDATA Registry is funded by the Australian Organ and Tissue Donation and Transplantation Authority, the New Zealand Ministry of Health, Kidney Health Australia and Better Evidence and Translation in Chronic Kidney Disease.
FUNDING
D.W.J. is supported by a National Health and Medical Research Council Practitioner Fellowship.
CONFLICT OF INTEREST STATEMENT
C.M.H. has received research grant support from Amgen, Shire and Baxter, and consulting and advisory fees from Shire and Amgen. J.W.M.A. has received consulting fees and travel sponsorship from Quanta Dialysis Solutions. He has also received speaker’s honoraria from Fresenius Medical Care. D.W.J. has received consultancy fees, research grants, speaker’s honoraria and travel sponsorships from Baxter Healthcare, Fresenius Medical Care and Amgen. V.W.L. has received consulting and advisory fees from Fresenius Medical Centre, Shire and Amgen. K.S. has received speaker’s honoraria from Baxter Healthcare, Roche, Amgen and Boehringer Ingelheim, and conference or meeting sponsorships from Shire, Roche, Boehringer Ingelheim, Amgen, Sanofi and Novartis. No other authors have any conflicts to declare. The results presented in this paper have not been published previously in whole or part, except in abstract form.
REFERENCES
ANZDATA Registry. 39th Report, Chapter 3: Mortality in End Stage Renal Disease. Adelaide, Australia: Australia and New Zealand Dialysis and Transplant Registry,


Comments