


Abstract
Cardiac surgery is a leading cause of acute kidney injury (AKI). Such AKI patients may develop progressive chronic kidney disease (CKD). Others, who appear to have sustained no permanent loss of function (normal serum creatinine), may still lose renal functional reserve (RFR).
We extended the follow-up in the observational ‘Preoperative RFR Predicts Risk of AKI after Cardiac Surgery’ study from hospital discharge to 3 months after surgery for 86 (78.2%) patients with normal baseline estimated glomerular filtration rate (eGFR), and re-measured RFR with a high oral protein load. The primary study endpoint was change in RFR. Study registration at clinicaltrials.gov Identifier: NCT03092947, ISRCTN Registry: ISRCTN16109759.
At 3 months, three patients developed new CKD. All remaining patients continued to have a normal eGFR (93.3 ± 15.1 mL/min/1.73 m2). However, when stratified by post-operative AKI and cell cycle arrest (CCA) biomarkers, AKI patients displayed a significant decrease in RFR {from 14.4 [interquartile range (IQR) 9.5 − 24.3] to 9.1 (IQR 7.1 − 12.5) mL/min/1.73 m2; P < 0.001} and patients without AKI but with positive post-operative CCA biomarkers also experienced a similar decrease of RFR [from 26.7 (IQR 22.9 − 31.5) to 19.7 (IQR 15.8 − 22.8) mL/min/1.73 m2; P < 0.001]. In contrast, patients with neither clinical AKI nor positive biomarkers had no such decrease of RFR. Finally, of the three patients who developed new CKD, two sustained AKI and one had positive CCA biomarkers but without AKI.
Among elective cardiac surgery patients, AKI or elevated post-operative CCA biomarkers were associated with decreased RFR at 3 months despite normalization of serum creatinine. Larger prospective studies to validate the use of RFR to assess renal recovery in combination with biochemical biomarkers are warranted.
INTRODUCTION
Each year, more than 2 million cardiac operations are performed worldwide [1]. Acute kidney injury (AKI) is a common complication of cardiac surgery [2, 3], and predicts adverse short- and long-term outcomes regardless of other risk factors [4, 5]. Despite abundant data on the prognostic importance of AKI, there is limited information available on renal recovery after cardiac surgery. Although identification of patients at risk for incomplete recovery has important implications for long-term management, to date, no reliable method exists to assess renal recovery outside of measurement of serum creatinine.
Sustained loss of glomerular filtration rate (GFR) is common following cardiac surgery, with 25% of patients exhibiting a loss of at least 10 mL/min/1.73 m2 by 1 year [6]. This occurs even in patients without AKI, suggesting that kidney injury occurs without overt changes in function as traditionally measured by serum creatinine [6]. However, GFR is a dynamic parameter, which is diet-dependent and is not maximal in the ‘unstressed’ (resting) condition [7]. Conversely, an apparently normal resting GFR can result from glomerular hyperfiltration of remaining nephrons, and may be incorrectly interpreted to indicate normal renal function and be deleterious in the long run [8–10].
The concept of renal functional reserve (RFR) describes the capacity of the kidneys to increase GFR in response to stimuli (e.g. protein load) and is defined by the difference between peak ‘stress’ GFR and the resting GFR [7, 9]. Recently, the assessment of RFR has been standardized [11]. RFR might be utilized to better categorize patients after an episode of AKI [7, 9]. Thus, in patients with apparently normal post-surgery GFR as measured by serum creatinine, there may be a subgroup with impaired RFR and at heightened risk for CKD and other episodes of AKI.
Novel urinary biomarkers [tissue inhibitor metalloproteinases-2 (TIMP-2) and insulin-like growth factor-binding protein 7 (IGFBP7)] have been identified as more sensitive for the detection of kidney injury or stress than serum creatinine [12]. Because of their likely biological effects, they are referred to as cell cycle arrest (CCA) biomarkers. Such CCA biomarkers may also assist in the identification of patients at risk of subsequent decrease of RFR. In this case, patients may have ‘sub-clinical’ levels of peri-operative injury as defined by serum creatinine yet have suffered injury significant enough to lead to decrease of RFR [13].
We recently reported on the use of RFR and CCA biomarkers to predict AKI in a series of 110 patients without underlying chronic kidney disease (CKD) undergoing elective cardiac surgery [10]. In this pre-planned subgroup analysis of that study, we sought to determine whether the occurrence of AKI [as defined by Kidney Disease: Improving Global Outcomes (KDIGO) criteria [14]] affects RFR 3 months after surgery even in patients without changes (pre- and post-surgery) in estimated GFR (eGFR); and whether urinary [TIMP-2]•[IGFBP7] levels predict such change in RFR.
MATERIALS AND METHODS
Study design and participants
The ‘Preoperative RFR Predicts Risk of AKI after Cardiac Surgery’ study has been described in detail elsewhere [10]. Briefly, 110 adult patients without pre-existing CKD [eGFR ≥60 mL/min/1.73 m2 (CKD-Epidemiology Collaboration equation [15])] undergoing elective cardiac surgery with cardiopulmonary bypass (coronary artery bypass, valve replacements, combined or other surgery) were enrolled between November 2014 and October 2015 at the Department of Cardiac Surgery of San Bortolo Hospital, Vicenza, Italy. Pre-operative RFR was measured using a high oral protein load test 1 day prior to surgery, and serial post-operative urine samples were analysed for [TIMP-2]•[IGFBP7]. The study was approved by the local Human Research Ethics Committee, and was conducted according to the principles of the Declaration of Helsinki. All patients provided written informed consent. The study is registered at clinicaltrials.gov (Identifier: NCT03092947) and the ISRCTN Registry (ISRCTN16109759).
All patients included in the ‘Preoperative RFR Predicts Risk of AKI after Cardiac Surgery’ study were re-contacted 3 months after surgery to determine their willingness to repeat the kidney stress test (see Supplementary data, Methods section). A total of 86 patients (78.2%) completed the 3 months’ follow-up per protocol until March 2016 at the Nephrology Department of San Bortolo Hospital, and were considered for subgroup analysis.
RFR assessment
RFR was assessed using a previously described protocol (kidney stress test) with oral protein load (see Supplementary data for complete description) [7, 10, 11, 16–18]. Both resting GFR and post-protein load (‘stress’) GFR were calculated using endogenous creatinine clearance, and were corrected for body surface area using the Dubois method [7, 10, 11, 16–18]. Urine collection was done by supervised voiding and confirmed for completeness by bladder scanning.
Resting and stress GFR were measured pre-operatively and 3 months after the surgery. The difference between the highest ‘stress’ GFR and resting GFR was defined as the RFR. Preserved RFR 3 months after surgery was defined as RFR equal to or greater than pre-operative values.
Laboratory methods are presented in the Supplementary data. All values for [TIMP-2]•[IGFBP7] are reported in units of (ng/mL)2/1000. In accordance with the validation study [12], the cut-off of [TIMP-2]•[IGFBP7] >0.3 was used for predicting changes in RFR. Overall, the level of completeness of collected data was 100%.
Endpoints
The primary endpoint was changes in RFR 3 months after surgery. Secondary endpoints included (i) percentage of patients with normal or unmodified eGFR, but reduced RFR at 3 months and (ii) association of pre-operative RFR and post-operative urinary biomarker levels with reduced RFR at 3 months. We also sought to determine the risk factors associated with a reduced RFR at 3 months. AKI and CKD were determined by using full KDIGO criteria [14, 19], and were diagnosed and staged by an adjudication committee of three expert nephrologists who were blinded to the results of RFR testing and biomarker results. Serum creatinine levels were taken at hospital admission (before protein loading) and immediately before surgery to detect possible changes due to creatinine content of red meat used as protein load. Positive fluid balance and haemodilution were considered by the adjudicators in diagnosing and staging AKI when appropriate [20]. Reversal of AKI was defined as the absence of any stage of AKI by either serum creatinine or urine output criteria [21]. Clinical variables were abstracted from patient medical records. Use of renal replacement therapy was at the discretion of the attending physician. Peri-operative myocardial infarction and stroke were defined as previously described [22]. All potentially nephrotoxic drugs (non-steroidal anti-inflammatory drugs, aminoglycosides, vancomycin and intravenous contrast media) were recorded during the study period.
Statistical analysis
Estimates of the potential effect and variance of protein intake were taken from previous publications [23, 24]. Shapiro–Wilk’s and Levene’s tests were used to test Gaussian distribution and homoscedasticity of continuous variables, respectively. Student’s t-test or one-way analysis of variance, Mann–Whitney U test, Kruskal–Wallis one-way analysis test, Pearson or McNemar’s chi-squared test (categorical variables) were used to evaluate the difference between non-AKI and AKI groups or between with patients with or without decrease in RFR. Two-sided P-values <0.05 were considered statistically significant. Data are presented as mean ± SD or median [interquartile range (IQR)], or as n (%).
Linear regression was used to describe the relationship between RFR at 3 months (dependent variable) and other predictor variables (independent variables). A receiver operating characteristic (ROC) curve was created for RFR at 3 months. Using the Liu method, we determined an optimal cut-off and analysed its sensitivity and specificity as well as the relative risk of decreased RFR. STATA version 13.1 software (Stata Corporation, College Station, TX, USA) was used for all analyses.
RESULTS
Patients and treatments
Of the 110 patients enrolled in the ‘Preoperative RFR Predicts Risk of AKI After Cardiac Surgery’ study, 86 were available for follow-up (Figure 1). Among those who were lost to follow-up, one patient was readmitted to hospital due to post-operative complications and died of multiple organ failure. Baseline characteristics and renal function measures and biomarkers are shown in Tables 1 and 2, respectively. Additional baseline characteristics, process of care and outcomes variablesand biomarker characteristics are shown in Supplementary data, Tables S1–S3. Average resting (measured by creatinine clearance) and eGFR were 102.7 ± 14.7 and 89.5 ± 14.6 mL/min/1.73 m2, respectively.
Baseline characteristicsa
| All patients | No AKI | AKI Stage 1 | AKI Stages 2−3 | |
|---|---|---|---|---|
| (n = 86) | (n = 76) | (n = 7) | (n = 3) | |
| Demographics | ||||
| Age (years) | 60.7 (51.5−67.7) | 59.9 (51.4−66.4) | 72.5 (60.6−77.5) | 49.9 (47.7−75.6) |
| Gender, male | 63 (73.3) | 56 (73.7) | 5 (71.4) | 2 (66.7) |
| Body mass index (kg/m2) | 25.9 ± 3.5 | 25.4 ± 3.4 | 28.9 ± 3.0 | 30.2 ± 2.4 |
| Comorbidities | ||||
| Hypertension | 55 (63.9) | 47 (61.8) | 6 (85.7) | 2 (66.6) |
| Diabetes mellitus Type 2 | 5 (5.8) | 4 (5.3) | 1 (14.3) | 0 (0) |
| Peripheral vasculopathy | 5 (5.8) | 3 (3.9) | 1 (14.3) | 1 (33.3) |
| Previous heart surgery | 5 (5.8) | 4 (5.3) | 1 (14.3) | 0 (0) |
| Left ventricular ejection fraction (%) | 61.5 (58.0−67.0) | 61.5 (57.5−66.0) | 59.0 (55.0−69.0) | 70.0 (65.0−71.0) |
| Medication | ||||
| Beta-blocker | 29 (33.7) | 23 (30.3) | 3 (42.9) | 3 (100) |
| ACE inhibitor or angiotensin II receptor blocker | 40 (46.5) | 33 (43.2) | 5 (71.4) | 2 (66.7) |
| Statin | 30 (34.9) | 26 (34.2) | 2 (28.6) | 2 (66.7) |
| Diuretic | 18 (20.9) | 15 (19.7) | 3 (42.9) | 0 (0) |
| Aldosterone antagonist | 3 (3.5) | 3 (3.9) | 0 (0) | 0 (0) |
| Baseline clinical data | ||||
| Leucocytes (×109/L) | 6.4 ± 1.9 | 6.4 ± 1.9 | 6.0 ± 0.9 | 7.7 ± 1.1 |
| Haemoglobin (g/dL) | 14.0 ± 1.3 | 14.1 ± 1.2 | 13.9 ± 0.9 | 12.7 ± 2.6 |
| Platelets (×109/L) | 214.1 ± 47.7 | 212.5 ± 44.0 | 189.0 ± 39.3 | 313.7 ±48.3 |
| Albumin (g/dL) | 3.9 ± 0.2 | 3.9 ± 0.3 | 3.9 ± 0.2 | 3.9 ± 0.1 |
| NYHA classification | ||||
| 1 | 37 (43.0) | 36 (47.4) | 1 (14.3) | 0 (0) |
| 2 | 49 (57.0) | 40 (52.6) | 6 (85.7) | 3 (100) |
| 3 | 0 (0) | 0 (0) | 0 (0) | 0 (0) |
| EuroSCORE II for operative risk (%)b | 1.0 (0.7−1.6) | 1.0 (0.7−1.6) | 1.5 (1.0−4.3) | 0.7 (0.6−11.8) |
| Surgical clinical data | ||||
| Aortic cross-clamp time (min) | 85.3 ± 31.7 | 82.9 ± 29.8 | 90 ± 39.8 | 136.0 ± 21.3 |
| Cardiopulmonary bypass time (min) | 116 (150.0−177.0) | 111.5 (97.0−144.5) | 153.0 (105.0−192.0) | 282.0 (166.0–301.0) |
| Procedure | ||||
| Coronary artery bypass graft only | 2 (2.33) | 2 (2.6) | 1 (10) | 0 (0) |
| Valve only | 46 (53.5) | 42 (55.3) | 3 (42.9) | 1 (33.3) |
| Combined or other | 38 (44.2) | 32 (42.1) | 4 (57.1) | 2 (66.7) |
| ICU clinical data | ||||
| ICU stay (h) | 51.0 (41.0−72.0) | 45 (41.0−66.0) | 55.5 (40.0−88.0) | 106.0 (85.0−189.0) |
| Hospital stay (days) | 5.5 ± 2.4 | 5.2 ± 1.7 | 5.5 ± 2.0 | 6 ± 0 |
Values are mean ± SD, n (%) or median [25th–75th percentile (interquartile range)]. Categorical variables are expressed as n (%).
Additional data are provided in the Supplementary data, Tables S1 and S2. There were no significant differences between the groups except for beta-blocker (P = 0.04), aortic cross-clamp time (P = 0.04), cardiopulmonary bypass time (P = 0.004), ICU stay (P = 0.01) and hospital stay (P = 0.002).
The European System for Cardiac Operative Risk Evaluation (EuroSCORE) is calculated by means of a logistic-regression equation and ranges from 0% to 100%, with higher scores indicating greater risk.
ACE, angiotensin-converting enzyme; NYHA, New York Heart Association.
Renal function measures and biomarkers
| Outcomes | All patients (n = 86) | No AKI (n = 76) | AKI Stage 1 (n = 7) | AKI Stages 2 − 3 (n = 3) | P-value |
|---|---|---|---|---|---|
| Serum creatinine (mg/dL)a | |||||
| Pre-operative (prior to protein loading) | 0.8 ± 0.2 | 0.84 ± 0.2 | 0.9 ± 0.1 | 0.84 ± 0.2 | 0.2 |
| Immediate pre-operative | 0.8 ± 0.2 | 0.83 ± 0.2 | 0.9 ± 0.2 | 0.83 ± 0.2 | 0.2 |
| Hospital discharge | 0.8 (0.7−0.9) | 0.8 (0.7−0.9) | 0.9 (0.8−1.0) | 0.79 (0.7−0.9) | 0.4 |
| 3-month follow-up | 0.8 (0.7−0.9) | 0.8 (0.7−0.9) | 1.0 (0.9−1.3) | 0.9 (0.6−1.5) | 0.3 |
| eGFR (mL/min/1.73 m2)b | |||||
| Pre-operative (prior to protein loading) | 93.5 (84.0−101.0) | 94.0 (86.0−101.5) | 80.0 (68.0−87.0) | 94.0 (86.0−101.5) | 0.2 |
| Immediate pre-operative | 93.0 (84.0−101.5) | 94.0 (85.5−101.0) | 81.0 (69.0−87.5) | 93.5 (86.0−101.0) | 0.2 |
| Hospital discharge | 94.0 ± 14.6 | 93.6 ± 13.2 | 79.5 ± 15.7 | 94.8 ± 13.0 | 0.004 |
| 3-month follow-up | 91.3 ± 16.2 | 91.2 ± 15.2 | 73.4 ± 13.1 | 92.2 ± 15.7 | 0.3 |
| Resting GFR (mL/min/1.73 m2)c | |||||
| Pre-operative | 102.7 ± 14.7 | 103.0 ± 14.0 | 97.0 ± 13.5 | 107 ± 33.6 | 0.08 |
| 3-month follow-up | 96.4 ± 15.3 | 97.7 ± 14.2 | 84.7 ± 11.0 | 92.8 ± 35.7 | 0.04 |
| RFR (mL/min/1.73 m2) | |||||
| Pre-operative | 25.7 ± 9.0 | 27.0 ± 8.3 | 13.9 ± 5.3 | 22.4 ± 13.2 | 0.3 |
| 3-month follow-up | 22.0 (14.9−27.0) | 22.6 (16.9−28.8) | 7.1 (7.4−11.0) | 12.5 (3.6–14.8) | <0.001 |
| Preserved RFR | 18 (20.9) | 18 (23.7) | 0 (0) | 0 (0) | <0.001 |
| Reduced RFR | 68 (79.1) | 58 (76.3) | 7 (100) | 3 (100) | <0.001 |
| Urine albumin-to-creatinine ratio | |||||
| Pre-operative (prior to protein loading) | 5.2 (2.9–13.5) | 5.0 (2.7–10.1) | 30.2 (27.3–71.4) | 30.0 (3.0–39.3) | <0.001 |
| Hospital discharge | 10.5 (5.5–24.5) | 9.1 (4.8–22.4) | 21.2 (17.9–37.6) | 63.4 (10.1–315.5) | 0.03 |
| 3-month follow-up | 7.7 (1.8–35.8) | 7.4 (0.9–25.4) | 30.9 (1.8–301.0) | 100.8 (0.8–156.3) | 0.2 |
| Urinary [TIMP-2]•[IGFBP7] | 0.07 | ||||
| ≤0.3 (ng/mL)2/1000 within 12 h after surgery | 41 (47.6) | 43 (56.6) | 0 (0) | 0 (0) | |
| >0.3 and <2 (ng/mL)2/1000 within 12 h after surgery | 44 (51.2) | 32 (42.1) | 7 (100) | 3 (100) | |
| >2 (ng/mL)2/1000 within 12 h after surgery | 1 (1.2) | 1 (1.3) | 0 (0) | (0) |
Values are mean ± SD or median [25th–75th percentile (interquartile range)]. Categorical variables are expressed as n (%).
To convert the values for serum creatinine to μm/L, multiply by 88.4.
The eGFR was calculated with the CKD-Epidemiology Collaboration equation [15].
The resting GFR was calculated as the creatinine clearance from the urine creatinine, urine volume, collection time (in mins) and serum creatinine, and was corrected to 1.73 m2 body surface area using the Dubois method.

Study flow chart and outcomes. The flowchart of the ‘Preoperative RFR Predicts Risk of AKI after Cardiac Surgery’ study shows that 110 patients were included in the initial study and 24 patients were lost to follow-up for the follow-up analysis. For bioimpedance procedure, see Supplemental Methods.
AKI rates and test performance
Of 86 patients in the analysis, 10 (11.6%) developed AKI according to creatinine criteria, and none met urine output criteria. Of these, seven (8.1%) had Stage 1 AKI, and three (3.5%) had severe AKI (Stage 2, two patients; Stage 3, one patient). All 10 patients experienced only one distinct episode of AKI throughout the hospital stay and all had urinary [TIMP-2]•[IGFBP7] >0.3 within 12 h after surgery. Immediate pre-operative serum creatinine levels did not differ from creatinine levels prior to protein loading (Table 2).
Renal recovery
At hospital discharge, all patients had normal renal function as defined by a normal eGFR (≥60 mL/min/1.73 m2), including the 10 patients who developed AKI (complete reversal) (Figure 2; for comprehensive description see Supplementary data, Figure S2).
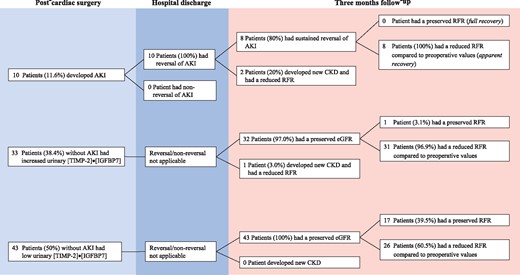
Renal outcome after cardiac surgery, stratified by occurrence of AKI and biomarker levels. The figure illustrates the long-term renal outcome in all patients stratified by the occurrence of AKI, increased biomarker levels (in the absence of clinical AKI) and without both criteria.
At 3 months, measured resting GFR remained normal in all patients (≥60 mL/min/1.73 m2, apparent full recovery), with an average of 96.4 ± 15.3 mL/min/1.73 m2. Mean eGFR was also 91.3 ± 16.2 mL/min/1.73 m2. However, three patients fulfilled the eGFR criteria for new CKD—two had post-operative AKI. These patients were categorized as KDIGO [19] Stage G3aA1 (eGFR 57 mL/min/1.73 m2, resting GFR 69.4 mL/min/1.73 m2) and G3aA2 (eGFR 58 mL/min/1.73 m2, resting GFR 64 mL/min/1.73 m2). The remaining patient with evidence of new CKD was categorized as Stage G3aA1 (eGFR 59 mL/min/1.73 m2, resting GFR 65 mL/min/1.73 m2). This patient did not develop post-operative AKI but did have elevated urine levels [TIMP-2]•[IGFBP7] (0.35) post-operatively. Overall, the new CKD patients showed a decrease in eGFR from 63.0 (IQR 61.3−66.0) to 52.5 (IQR 46.0−59.0) mL/min/1.73 m2, respectively.
Three-month RFR
Three months after surgery, the 83 (96.5%) remaining patients without new onset CKD showed a median decrease in RFR from 25.7 (IQR 20.5−31.4) to 22.3 (IQR 15.6−27.1) mL/min/1.73 m2 (P < 0.001), even though eGFR remained unchanged from 94.5 (88.0−102.5) to 93.5 (84.0−102.0) (P = 0.8). The eight AKI patients who did not develop CKD experienced a decrease in RFR, with a median decrease of 4.7 (IQR −10.7 to −2.41) mL/min/1.73 m2 [RFR fell from 14.4 (IQR 9.5−24.3) to 9.1 (IQR 7.1−12.5) mL/min/1.73 m2, P < 0.001; Figure 3A]. The mean average percent decrease in RFR was 36.9 ± 14.4% (P < 0.001). In contrast, median eGFR again remained unchanged from 85.5 (IQR 76.0−97.0) to 84.5 (IQR 67.0−95.0) mL/min/1.73 m2 (P = 0.5).
![Comparison of pre-operative and follow-up RFR in non-AKI verus AKI patients (A), AKI patients categorized by stage (B) and non-AKI patients with increased urinary [TIMP-2]•[IGFBP7] levels after cardiac surgery (C). (A) At 3 months, patients with and without AKI displayed a significant decrease in RFR (P < 0.001). (B) When categorized by stage, patients with AKI Stage 1 and severe AKI (Stages 2–3) had a significant decrease in RFR (P < 0.001). (C) Patients with positive biomarkers, despite not having developed AKI, had a significant decrease in RFR (P < 0.001). In contrast, in biomarker-negative, AKI-negative patients, RFR was preserved (P = 0.2). A positivity of urinary [TIMP-2]•[IGFBP7] was defined as biomarker levels >0.3 (ng/mL)2/1000. Significance between pre-operative and follow-up RFR is indicated in the figure (*P < 0.001).](https://oup.silverchair-cdn.com/oup/backfile/Content_public/Journal/ndt/34/2/10.1093_ndt_gfy227/1/m_gfy227f3.jpeg?Expires=1750307965&Signature=YmR-8htfjDuyYqJIfvbLg0TbxQr1NFOjYWdBzV3nMcBKo2gy~nJAHvxZJH9OM3vx4OAsszbCorJ1IAk~g6MTVkUse8QPCJ17QFpSmy~bHFdmuWTv2FbY7EcvgPBinjMa5g8UsKpNzDxTPPwkkak5-sr~VB1SWAcHpAXrbU~CCDRqn8wC7QsRWbwpnuXnx4OWF3c7sf1rE6~BRE7K2dfJox9Sa0olu7NMAaGypMiFSZ06G77bdXSn735bBHOUYF7qCcTeTMjMLgwSWfglY2TJ7UO5iSVGbUvSmgEqfvV4z3C4wIYsjFPZvfzO5I2Pk5UlNJxDQOIhvVei0FrJBplYZA__&Key-Pair-Id=APKAIE5G5CRDK6RD3PGA)
Comparison of pre-operative and follow-up RFR in non-AKI verus AKI patients (A), AKI patients categorized by stage (B) and non-AKI patients with increased urinary [TIMP-2]•[IGFBP7] levels after cardiac surgery (C). (A) At 3 months, patients with and without AKI displayed a significant decrease in RFR (P < 0.001). (B) When categorized by stage, patients with AKI Stage 1 and severe AKI (Stages 2–3) had a significant decrease in RFR (P < 0.001). (C) Patients with positive biomarkers, despite not having developed AKI, had a significant decrease in RFR (P < 0.001). In contrast, in biomarker-negative, AKI-negative patients, RFR was preserved (P = 0.2). A positivity of urinary [TIMP-2]•[IGFBP7] was defined as biomarker levels >0.3 (ng/mL)2/1000. Significance between pre-operative and follow-up RFR is indicated in the figure (*P < 0.001).
When sub-grouped by stage, patients with AKI Stage 1 had a median decrease in RFR of 2.6 mL/min/1.73 m2 (IQR −6.3 to −2.3; −30.1 ± 11.2%), and those with severe AKI (Stages 2−3) had a median decrease in RFR of 16.2 mL/min/1.73 m2 (IQR −16.5 to −3.6; −52.9 ± 3.6%; P < 0.001; Figure 3B). eGFR again remained unchanged both in Stage 1 and Stages 2−3 patients (Supplementary data, Table S4).
Of the 32 non-CKD patients who were AKI-negative but biomarker-positive, only 1 patient (3.0%) showed a RFR equal to pre-operative values (P < 0.001). AKI-negative but biomarker-positive patients also had a significant median decrease in RFR [−6.6 mL/min/1.73 m2 (IQR −10.3 to −4.9) from 26.7 (IQR 22.9−31.5) to 19.7 (IQR 15.8−22.8) mL/min/1.73 m2; P < 0.001; Figure 3C], a decrease of 27.5 ± 12.7% compared with pre-operative values (P < 0.001). eGFR remained unchanged (Supplementary data, Table S4). When compared with the AKI-positive group, all AKI-negative and biomarker-positive patients had a median decrease in RFR >4.7 mL/min/1.73 m2 (P < 0.001).
In contrast, of the 43 patients who were AKI-negative and biomarker-negative, 17 (39.5%) had RFR equal to or greater than pre-operative values (P < 0.001) and none developed CKD. In these patients, RFR was preserved [median change was −0.8 mL/min/1.73 m2 (IQR −1.6 to 1.1)]. The magnitude of decrease in RFR at 3 months was 0.04 ± 4.0%, which was significantly different from biomarker positive or AKI (creatinine)-positive patients (P < 0.001). Among the 43 AKI-negative and biomarker-negative patients, none had a decrease in RFR >4.7 mL/min/1.73 m2 when compared with AKI-positive patients (P < 0.001). eGFR remained unchanged (Supplementary data, Table S4).
When we compared CCA biomarkers levels in non-CKD patients who displayed a decrease in RFR at 3 months compared with those who did not, independent of AKI occurrence, CCA biomarkers levels at 30 min after cardiopulmonary bypass (P = 0.007) and peak CCA biomarker values within 12 h after surgery (P = 0.001) were significantly greater in patients with a decrease in RFR (Table 3). Among different time points, the ROC curve of peak CCA biomarker values within 12 h after surgery was significantly more accurate (area under the receiver operating characteristics curve, AUC = 0.75) to identify patients who developed a decrease in RFR, with an estimated cut-off point of 0.3 (sensitivity 0.68 and specificity 0.78; Table 4).
Descriptive analysis for urinary [TIMP-2]•[IGFBP7] at different time points depending on pre-operative and follow-up RFR
| Timing of urinary [TIMP-2]•[IGFBP7] | RFR at 3 months <pre-operative RFR | RFR at 3 months ≥pre-operative RFR | P-value |
|---|---|---|---|
| 30 min after initiation of cardiopulmonary bypass | 0.21 (0.10–0.44) | 0.08 (0.05–0.17) | 0.007 |
| ICU admission | 0.06 (0.04–0.14) | 0.04 (0.04–0.08) | 0.15 |
| 4 h after surgery | 0.11 (0.07–0.20) | 0.12 (0.06–0.19) | 0.81 |
| 12 h after surgery | 0.11 (0.06–0.20) | 0.07 (0.04–0.15) | 0.051 |
| 24 h after surgery | 0.11 (0.06–0.31) | 0.11 (0.06–0.21) | 0.46 |
| Hospital discharge | 0.46 (0.26–1.57) | 0.65 (0.19–1.9) | 0.93 |
| Peak within 12 h after surgery | 0.35 (0.16–0.56) | 0.24 (0.19–0.38) | 0.001 |
| Peak within 24 h after surgery | 0.38 (0.23–0.69) | 0.32 (0.23–0.43) | 0.27 |
| 3-month follow-up | 0.10 (0.05–0.28) | 0.06 (0.04–0.12) | 0.055 |
Values are median [25th–75th percentile (interquartile range)].
Area under the curve for urinary [TIMP-2]•[IGFBP7] at different time points to discriminate RFR at 3 months <pre-operative RFR in all patients (biomarkers positive and negative)
| Timing of urinary [TIMP-2]•[IGFBP7] | ROC curve | Standard error | 95% confidence interval |
|---|---|---|---|
| 30 min after initiation of cardiopulmonary bypass | 0.72 | 0.06 | 0.59–0.85 |
| ICU admission | 0.61 | 0.07 | 0.47–0.74 |
| 4 h after surgery | 0.52 | 0.07 | 0.37–0.66 |
| 12 h after surgery | 0.65 | 0.07 | 0.51–0.79 |
| 24 h after surgery | 0.56 | 0.08 | 0.41–0.70 |
| Peak within 12 h after surgery | 0.75 | 0.05 | 0.64–0.86 |
| Peak within 24 h after surgery | 0.72 | 0.06 | 0.60–0.84 |
| 3-month follow-up | 0.65 | 0.07 | 0.51–0.79 |
The ROC curve of peak [TIMP-2]•[IGFBP7] within 12 h after cardiac surgery was the most accurate. Empirical cutpoint estimation (using the Liu Method) for peak [TIMP-2]•[IGFBP7] within 12 h after cardiac surgery: 0.3 (sensitivity at cutpoint: 0.68; specificity at cut-off point: 0.78; area under receiver under the operating characteristic curve at cutpoint: 0.73).
In addition, we found significant decreases between pre-operative and follow-up RFR values in non-CKD patients with positive post-operative biomarker values [[TIMP-2]•[IGFBP7] >0.3: 25.9 (IQR 19.4–31.1) to 17.0 (IQR 12.5−22.5) versus ≤0.3: 25.8 (IQR 19.4–22.72) to 26.0 (IQR 20.4−31.7) mL/min/1.73 m2, P < 0.001; Figure 4]. The absolute decrease in median RFR was significantly greater in magnitude in patients who displayed a positivity for biomarkers within 12 h after surgery [>0.3: −6.3 (IQR −10.7 to −4.6) mL/min/1.73 m2; −30.0 ± 13.6% versus ≤0.3: −0.88 (IQR −2.0 to 1.1) mL/min/1.73 m2; −0.3 ± 13.4%; P < 0.001].
![Comparison of pre-operative and follow-up RFR depending on urinary [TIMP-2]•[IGFBP7] levels after cardiac surgery. At 3 months after surgery, decrease in RFR was significantly greater in magnitude in patients who displayed a positivity for biomarkers within 12 h after surgery (P < 0.001). A positivity of urinary [TIMP-2]•[IGFBP7] was defined as biomarker levels >0.3 (ng/mL)2/1000. *P < 0.001.](https://oup.silverchair-cdn.com/oup/backfile/Content_public/Journal/ndt/34/2/10.1093_ndt_gfy227/1/m_gfy227f4.jpeg?Expires=1750307965&Signature=SWKrTlawDr2v~e~2-vIooO6JA5Vz32I9RNLROT6Y30jmnmO5r~PVcqrSCGJoNPBOnneX8E1g1wYBkcaAmdlcQ5kVujAR5aA75NheZNxYoWZNtnIu3mgc2LHlXEUSkQqcYSrCz-zD4oqCLBgLAuVAM-FUXPTRbfLFy7wnLy9dN4b7yqrfzGqJL75Zw5Kzv0RikWdjyg5TqZ4oiEiHCSQsKdaODnOsebQVLc8s1jWWIrTlAYUdQeLj8urDY1ZhOVAYnGRw-6J~OeL4ZgpHpO5xili~IDcS-Cq8dmSQz0b4w4Qsu4xkJjRSiyDNvNJA7Se15sOArnQp1jgC0KFe0qvOAA__&Key-Pair-Id=APKAIE5G5CRDK6RD3PGA)
Comparison of pre-operative and follow-up RFR depending on urinary [TIMP-2]•[IGFBP7] levels after cardiac surgery. At 3 months after surgery, decrease in RFR was significantly greater in magnitude in patients who displayed a positivity for biomarkers within 12 h after surgery (P < 0.001). A positivity of urinary [TIMP-2]•[IGFBP7] was defined as biomarker levels >0.3 (ng/mL)2/1000. *P < 0.001.
Patients with CCA biomarker values >0.3 within 12 h after surgery were 1.6-fold likely to experience a decrease in RFR at 3 months (95% confidence interval 1.25–2.02; P < 0.001). RFR values at 3 months were associated with pre-operative RFR, age and peak CCA biomarkers values within 12 h after surgery (Supplementary data, Table S5). Peri-operative variables (e.g. cardiopulmonary bypass time and aortic clamp time), however, did not show a significant association with RFR at 3 months.
DISCUSSION
Key findings
In patients with a normal eGFR before, and 3 months after, elective cardiac surgery, we found that median RFR decreased in patients who developed peri-operative AKI. In patients without AKI, but with increased urinary CCA biomarker levels, median RFR also fell. Conversely, for patients without AKI and with no change in biomarkers, median RFR at 3 months remained presevered, and no patient experienced a decrease in RFR >4.7 mL/min/1.73 m2.
Relationship with previous studies
Although RFR declines with age, resting GFR values remain within the normal range [23, 24]. This is in accordance with significant nephron loss in healthy human kidneys with ageing [8]. A reduction of RFR compared with young healthy volunteers [11, 16] has also been observed in physiological (pregnancy [17] and elderly persons [23]) and pathological conditions (CKD [9], chronic obstructive pulmonary disease [25], solitary kidney [18] and diabetes [26]). To date, however, no study has evaluated whether AKI or increased urinary biomarker levels predict subsequent decrease in RFR in any population.
Both TIMP-2 and IGFBP7 have been implicated in the G1 CCA phase noted to occur during the very early stages of renal tubule cellular stress [12, 27]. They have been validated for the prediction of Stages 2−3 AKI in different populations [12, 28, 29]. In patients undergoing cardiac surgery, [TIMP-2]•[IGFBP7] measurements at intensive care unit (ICU) admission and 4 h after the procedure have been described as the best time points in predicting AKI [28−36]. However, these biomarkers may rise within few minutes after kidney injury, and only one study investigated peri-operative [TIMP-2]•[IGFBP7] levels [33]. In addition, a faster decline of increased urinary [TIMP-2]•[IGFBP7] levels following cardiac surgery has been associated with higher rates of AKI reversal at hospital discharge [30]. No study, however, has evaluated whether increased urinary [TIMP-2]•[IGFBP7] levels predict changes in RFR.
Study implications
Our results indicate that patients with post-operative AKI have persistent decrease in RFR at 3 months after cardiac surgery. Patients with severe AKI exhibited higher decreases in RFR, indicating a possible direct dose-dependent relationship between severity of cardiac surgery-associated kidney injury and decreases in RFR. However, it remains to be determined whether other types of AKI (e.g. in the setting of sepsis) are associated with comparable changes in RFR. Moreover, in many patients without underlying CKD, or without clinically defined AKI, there is a decrease of renal functional capacity after cardiac surgery. Peri-operative elevated CCA biomarkers may be superior to help identify patients at highest risk for subsequent decrease of RFR after cardiac surgery compared with post-operative time points.
Study strengths and limitations
To our knowledge, this is the first study to suggest that RFR at 3 months after surgery may have a role in renal outcome assessment after AKI and be useful for discriminating among patients with complete functional renal recovery (normal eGFR and intact RFR) from those with ‘apparent’ functional recovery (normal eGFR and reduced RFR) and non-recovery (reduced eGFR and RFR). Whether decreased RFR is a novel risk indicator for new CKD remains to be determined; however, our results suggest that a reduction of RFR may occur before CKD becomes clinically apparent as measured by eGFR. The role of reduced RFR in the risk of future episodes of AKI will need to be determined. Other strengths of the study include its prospective design, simultaneous assessment of CCA biomarkers, and assessment of multiple additional baseline variables.
Our study has several limitations including single-centre design and a relatively low AKI rate (11.6%). However, the low occurrence of AKI was expected since we excluded pre-existing CKD patients. Also, we selected patients with low comorbidity status, elective surgical procedures and a considerably high rate of minimally invasive surgery (36%), all factors which are associated with low AKI rates [37, 38]. Unexpectedly, none of the AKI patients exhibited positive urine output criteria. It is well described that urine output significantly increases in response to protein loading [16, 23, 39]. However, whether there is a sustained effect on urine output after termination of protein loading—and if so, for how long—remains to be determined. However, we did not detect any changes in serum creatinine levels the day after protein loading as performed with red meat when compared with levels at hospital admission. Follow-up analyses of RFR were performed 3 months after cardiac surgery, as the KDIGO guidelines [19] define 3 months as the minimum duration to delineate new onset CKD after AKI. However, it is likely that a longer follow-up period would have increased the number of patients with new CKD. Different age-related normal RFR values have been described; however, whether these values can be transferred to our cohort—and what the threshold for a significant decrease in RFR is, needs to be determined in a larger and heterogeneous cardiac surgery population [11, 23]. Measurement of RFR is time-consuming, which limits its widespread clinical utility. Currently, no alternative methods are available to measure RFR, but this may change with the introduction of real-time GFR measurement [40]. In addition, creatinine clearance may overestimate RFR due to increased tubular creatinine secretion. However, as the proportion of tubular secretion to glomerular filtration of creatinine increases with advanced kidney disease, the overestimation of GFR is greater at lower levels of kidney function, which may play only a minor role in our population with normal renal function prior to surgery. In previous studies, creatinine clearance and inulin clearance for RFR measurement did not differ significantly, showing that creatinine clearance is a reliable, easy-to-perform and available marker for GFR [11, 16, 24].
In conclusion, in patients with normal eGFR undergoing elective cardiac surgery, decreases in RFR was common. However, clinical AKI was associated with greater changes in RFR at 3 months, and elevated peri-operative CCA biomarkers (even in the absence of clinical AKI) also identified patients at higher risk for subsequent decreases in RFR at 3 months. Larger prospective studies to validate the use of RFR to assess renal recovery in combination with biochemical biomarkers are warranted.
ACKNOWLEDGEMENTS
The authors would like to acknowledge the staff of Cardiac Surgery, Anesthesiology and Nephrology whose work was essential to complete this study. Special thanks go to Valeria Zamunaro, Paola Tessaro and Mariano Cuman for their ceaseless efforts in patient recruitment.
AUTHORS’ CONTRIBUTIONS
The authors shared study design, data collection, data analysis and data interpretation; and preparation, review and approval of the manuscript. The corresponding author had full access to all of the data in the study and had final responsibility for the decision to submit for publication. All authors declare that the results presented in this paper have not been published previously in whole or part, except in abstract format.
CONFLICT OF INTEREST STATEMENT
J.A.K. discloses grant support and consulting fees paid by Astute Medical. The other authors declare that they have no conflicts of interests.


Comments