


Abstract
Body mass index (BMI) is associated with patient outcomes after kidney transplantation. We hypothesized that immunosuppression (IS) dosing is a contributing factor.
Using Australia and New Zealand Dialysis and Transplant registry data, we included all adult kidney-only transplant recipients over 2000–14 treated with prednisolone, mycophenolate and tacrolimus/cyclosporin (n = 7919). The exposure was BMI and the outcomes were time to: (i) acute rejection, (ii) fatal infection, (iii) cancer and (iv) graft; and (v) patient survival. We modelled BMI and IS dosing (in quartiles) as time-varying covariates in extended Cox models.
Compared with a BMI of 25 kg/m2, a BMI of 35 was associated with acute rejection after adjusting for demographics and comorbidities [adjusted hazard ratio (aHR) = 1.29, 95% confidence interval (CI) 1.12–1.49]. This association virtually disappeared after correcting for IS (aHR = 1.09, 95% CI 0.93–1.29). A BMI of 35 was non-significantly associated with fewer fatal infections (aHR = 0.91, 95% CI 0.66–1.25), but this reversed after adjusting for IS (aHR = 1.54, 95% CI 1.03–2.28). Results for cancer were not significantly altered after adjusting for IS. Results for lower BMI were similarly not significantly altered though generally associated with worse outcomes.
Our findings show that the associations between high BMI, acute rejection and fatal infection after kidney transplantation were significantly altered after correcting for IS suggesting that relative under-dosing of obese patients may partially explain these associations.
INTRODUCTION
High body mass index (BMI) [1] is common in the kidney transplant population [2], where over half of all recipients are either overweight (BMI ≥25 kg/m2) or obese (BMI ≥30 kg/m2) [3, 4]. These patients also experience transplant-specific complications including prolonged operating times, delayed graft function (DGF) [5–8], wound complications [6, 8, 9], longer hospital stays and higher associated costs [6], post-transplant diabetes mellitus [10], graft failure [7, 11] and potentially death [7, 11, 12].
Although rates of acute rejection have declined substantially over recent years [2, 13], acute rejection remains a major cause of morbidity for transplant recipients and is associated with increased rates of allograft loss [13, 14] and chronic rejection [15]. High BMI has been associated with an increased risk of acute rejection in most studies [5, 6], but the mechanisms underlying this relationship are unclear. One possibility is that there are inadequate dosing adjustments that are being made to maintain immunosuppressive medications according to patient weight. This may result in relative under-dosing for patients who are overweight or obese, thus predisposing them to acute rejection.
High BMI in the general population is also known to be associated with increased rates of a range of malignancies [16, 17] and cancer-related mortality [18]. Kidney transplant recipients incur an increased incidence of many types of cancer [19–21], particularly those mediated by oncogenic viruses, suggesting that long-term immunosuppression (IS) may be contributory. However, the relationship between malignancy and immunosuppressive dosing in the kidney transplant population has been less well studied.
Underweight patients are also at an increased risk of poor post-transplant outcomes. Evidence suggests that this population incurs higher rates of chronic rejection [5, 22], allograft dysfunction and loss [5, 7, 9, 12, 22, 23] and death [7, 9, 12, 24] compared with their normal-weight counterparts, as well as an increased risk of infection [7]. It is possible that, in contrast to their overweight and obese counterparts, relative over-dosing of immunosuppressive medications is occurring in patients with low BMI, thus leading to increased rates of infection and infection-related deaths [7].
We therefore sought to investigate the associations between BMI and IS dosage, and the consequent risks of acute rejection, fatal infection and cancer. We hypothesized that the risk of rejection would increase in underweight patients and decrease in overweight and obese patients after adjusting for IS exposure. We hypothesized that conversely, the risks of fatal infection and cancer would decrease in underweight patients and increase in overweight and obese patients after adjusting for IS.
MATERIALS AND METHODS
Study population
We used de-identified data from the Australia and New Zealand Dialysis and Transplant (ANZDATA) Registry. Data for this registry are collected through voluntary submissions from treating hospitals both online and via printed survey. The collection and use of this data by the ANZDATA registry are authorized via an opt-out consent process for all included patients and have been granted full ethics approval by the Royal Adelaide Hospital Human Research Ethics Committee (reference number: HREC/17/RAH/408 R20170927). At all times, data were handled in a responsible and ethical manner to protect individual privacy, in line with the national privacy principles of Australia and New Zealand.
We included all adult patients who received kidney-only transplants in Australia or New Zealand from 1 January 2000 to 31 December 2014 and whose maintenance IS consisted of prednisolone, mycophenolate and a calcineurin inhibitor. Patients with grafts from both live and deceased donors were included.
Data collection
The information collected contained patient demographics and comorbidities, including ethnicity, diabetes mellitus, smoking history, length of time on dialysis and the underlying cause of end-stage kidney disease. Details regarding both the kidney transplantation, including donor age, year of transplant, re-transplantation, ischaemic time, induction therapy, human leucocyte antigen (HLA)-matching and panel reactive antibody (PRA) status, and post-transplant care, including immunosuppressive regimens and complications such as acute rejection, graft loss and patient death, were also collected. Doses of mycophenolic acid (MPA) were converted to the equivalent dose of mycophenolate mofetil (MMF).
Statistical analyses
The primary outcomes measured were time to acute rejection, time to fatal infection, time to death from cancer, time to skin cancer (excluding melanoma) and time to non-skin cancer (including melanoma). The rejection outcome was censored at 6 months since the registry did not collect rejection data beyond 6 months until partway through the study period. When examining fatal infections, deaths from other causes were censored. Only fatal infections were studied as data on non-fatal infections collected by the registry are limited. Secondary outcomes were cancer subtypes, patient survival, overall and death-censored graft survival. Since post-transplant weight and IS data are only collected in those with a functioning graft, all analyses were censored at graft failure.
We analysed both BMI and IS dosing as time-varying covariates in extended Cox models. BMI was modelled as a restricted cubic spline with knots at 15, 20, 25 and 35 kg/m2 to account for the nonlinear associations between BMI and outcomes. Spline knots were chosen empirically at clinically relevant cut-points.
For each outcome, we constructed Cox models examining the association between BMI and the outcome (i) unadjusted, (ii) adjusted for demographics and comorbidities but not IS, (iii) adjusted for IS but not demographics or comorbidities and (iv) adjusted for immunosuppression and demographics and comorbidities. The demographics and comorbidities we included in the rejection models were recipient age, ethnicity, smoking history, duration of renal replacement therapy, HLA mismatch, peak PRA, year of transplant (2000–04, 2005–09, 2010–14), primary graft versus regraft, induction therapy (none, anti-CD25 or T-cell depletion) and donor age. For the other outcomes, we also adjusted for primary renal disease, comorbidities (diabetes mellitus, coronary artery disease, peripheral vascular disease, cerebrovascular disease, chronic lung disease) and donor type (living versus deceased). For the non-skin cancer outcomes, we also adjusted for pre-transplant non-skin cancer. Variables were included on the basis of clinical judgement, and additionally we screened variables for potential inclusion in models based on univariable statistical significance at the 0.05 level.
Analyses were restricted to patients treated with prednisolone, mycophenolate and a calcineurin inhibitor. Weight and IS data are collected at baseline, and at; months 1, 2, 3 and 6 and years 1, 2, 3, 5, 7 and 10, and every 5 years thereafter. At each of these time points, we recalculated BMI, prednisolone dose/kilogram and mycophenolate dose/kilogram. Prednisolone dose/kilogram and mycophenolate dose/kilogram were converted into quartiles at each time point. As dosing of tacrolimus and cyclosporin is based on therapeutic drug monitoring and the registry does not collect drug levels, we modelled the choice of calcineurin inhibitor as a binary covariate. Patients were then categorized by their combination of prednisolone dose/kilogram quartile, mycophenolate dose/kilogram quartile and calcineurin inhibitor at each time point. The adjustment for IS was then achieved by stratifying the Cox models by the resulting 32 groups. The association between time-varying BMI and outcomes was thus examined in strata of patients with similar degrees of overall IS. For example, patients receiving tacrolimus, high dose/kilogram steroids and low dose/kilogram MMF were only compared with other patients receiving tacrolimus, high-dose/kilogram steroids and low-dose/kilogram MMF. This stratification was only used in the models reported as being adjusted for IS.
Given the very small amount of missing data, we used complete case analysis for all Cox models. The proportional hazards assumption was assessed using plots of scaled Schoenfeld residuals and with formal hypothesis testing, and linearity of predictors was assessed using Martingale residuals. All models satisfied these assumptions. Statistical analyses were performed using Stata version 15.1 (StataCorp, College Station, TX, USA). A p < 0.05 was considered to be statistically significant, and all estimates are presented with 95% confidence intervals (CIs). The results for the BMI spline terms are presented graphically, and in tabular form for representative BMIs of 35 and 18 kg/m2 versus a reference BMI of 25 kg/m2 (the cohort’s average baseline BMI).
RESULTS
Study cohort
A total of 7919 patients were included (Table 1). Median follow-up was 5.4 years with a total of 46 538 patient-years. In total, 3.06% of patients were underweight according to their BMI, 39.95% had a normal BMI and 35.89% were overweight. Out of the remaining 21.1% of patients who had a BMI consistent with obesity, 81.8% had Class I obesity (BMI = 30–34.9), 15.5% had Class II obesity (BMI = 35–39.9) and 2.69% had Class III obesity (BMI ≥40) [1] (Supplementary data, Table S1 and Figure S1). One hundred and three patients (1.3%) were lost to follow-up after a median of 3.9 years. With the exceptions of HLA mismatch (5%) and ischaemic time (1.4%), <1% of data were missing for each variable (Supplementary data, Table S2).
Patient characteristics at transplant according to World Health Organization BMI category
| Factor | BMI <18.5 (underweight) | BMI 18.5–24.9 (normal) | BMI 25–29.9 (overweight) | BMI ≥30 (obese) | P-value |
|---|---|---|---|---|---|
| Number | 242 | 3164 | 2842 | 1671 | |
| Age at transplant, median (interquartile range) | 41 (31–50) | 47 (36–57) | 52 (42–60) | 52 (43–60) | <0.001 |
| Male sex, n (%) | 78 (32.2) | 1879 (59.4) | 1962 (69.0) | 1060 (63.4) | <0.001 |
| Ethnicity, n (%) | <0.001 | ||||
| Caucasian | 148 (61.2) | 2499 (79.0) | 2359 (83.0) | 1339 (80.1) | |
| Australian indigenous | 9 (3.7) | 82 (2.6) | 85 (3.0) | 68 (4.1) | |
| Asian | 67 (27.7) | 429 (13.6) | 207 (7.3) | 72 (4.3) | |
| Māori | 3 (1.2) | 59 (1.9) | 70 (2.5) | 80 (4.8) | |
| Pacific | 2 (0.8) | 40 (1.3) | 81 (2.9) | 83 (5.0) | |
| Other | 13 (5.4) | 55 (1.7) | 40 (1.4) | 29 (1.7) | |
| Primary renal disease, n (%) | <0.001 | ||||
| Glomerulonephritis | 131 (54.1) | 1583 (50.0) | 1292 (45.5) | 721 (43.1) | |
| Polycystic kidney disease | 19 (7.9) | 431 (13.6) | 468 (16.5) | 216 (12.9) | |
| Reflux nephropathy | 21 (8.7) | 354 (11.2) | 223 (7.8) | 119 (7.1) | |
| Hypertensive nephropathy | 10 (4.1) | 145 (4.6) | 156 (5.5) | 130 (7.8) | |
| Diabetic nephropathy | 11 (4.5) | 215 (6.8) | 317 (11.2) | 274 (16.4) | |
| Other | 50 (20.7) | 436 (13.8) | 386 (13.6) | 211 (12.6) | |
| History of smoking, n (%) | 79 (32.9) | 1280 (40.7) | 1286 (45.4) | 812 (48.7) | <0.001 |
| Comorbidities at transplant, n (%) | |||||
| Diabetes mellitus | 21 (8.7) | 305 (9.6) | 457 (16.1) | 410 (24.6) | <0.001 |
| Coronary artery disease | 23 (9.5) | 422 (13.3) | 544 (19.2) | 360 (21.5) | <0.001 |
| Peripheral vascular disease | 16 (6.6) | 211 (6.7) | 246 (8.7) | 197 (11.8) | <0.001 |
| Cerebrovascular disease | 19 (7.9) | 136 (4.3) | 157 (5.5) | 97 (5.8) | 0.014 |
| Chronic lung disease | 29 (12.0) | 229 (7.2) | 166 (5.8) | 125 (7.5) | 0.001 |
| Time on dialysis, n (%) | <0.001 | ||||
| <1 year | 64 (26.4) | 883 (27.9) | 779 (27.4) | 379 (22.7) | |
| 1–5 years | 95 (39.3) | 1359 (43.0) | 1346 (47.4) | 881 (52.7) | |
| <5 years | 83 (34.3) | 922 (29.1) | 717 (25.2) | 411 (24.6) | |
| Graft number, n (%) | <0.001 | ||||
| 1 | 213 (88.0) | 2777 (87.8) | 2611 (91.9) | 1561 (93.4) | |
| 2+ | 29 (12.0) | 387 (12.2) | 231 (8.1) | 110 (6.6) | |
| Deceased donor, n (%) | 135 (55.8) | 1861 (58.8) | 1753 (61.7) | 1113 (66.6) | <0.001 |
| Donor age, median (interquartile range) | 48 (36–57) | 48 (37–58) | 49 (37–58) | 48 (36–58) | 0.14 |
| Year of transplant, n (%) | <0.001 | ||||
| 2000–04 | 73 (30.2) | 1019 (32.2) | 787 (27.7) | 375 (22.4) | |
| 2005–09 | 96 (39.7) | 1173 (37.1) | 1046 (36.8) | 573 (34.3) | |
| 2010–14 | 73 (30.2) | 972 (30.7) | 1009 (35.5) | 723 (43.3) | |
| HLA mismatches, n (%) | 0.86 | ||||
| 0–2 | 80 (34.8) | 1089 (36.1) | 951 (35.1) | 571 (36.5) | |
| 3–4 | 83 (36.1) | 1087 (36.0) | 971 (35.8) | 538 (34.4) | |
| 5–6 | 67 (29.1) | 840 (27.9) | 790 (29.1) | 454 (29.0) | |
| Total ischaemic time, median (interquartile range), h | 8 (3–13) | 9 (3–14) | 9 (3–14) | 10 (4–14) | <0.001 |
| Induction antibody therapy, n (%) | <0.001 | ||||
| None | 72 (29.8) | 1055 (33.3) | 874 (30.8) | 447 (26.8) | |
| Anti-CD25 | 162 (66.9) | 2011 (63.6) | 1864 (65.6) | 1159 (69.4) | |
| T-cell depletion | 8 (3.3) | 98 (3.1) | 104 (3.7) | 65 (3.9) |
Immunosuppression dosing
Figure 1 illustrates the dosing of the most commonly prescribed immunosuppressants by BMI category. Dosing of prednisolone and MMF per kilogram was much higher in underweight patients than in obese patients. In contrast, there was a less significant difference in dosing practices for tacrolimus and cyclosporin, likely reflecting routine titration according to drug levels.
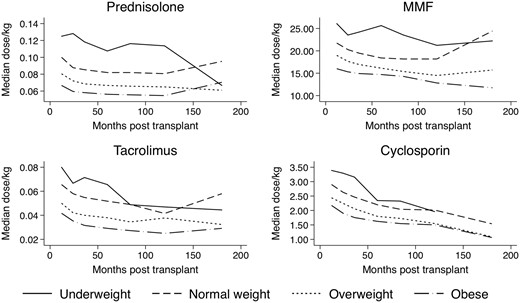
Relative drug dosing/kilogram of commonly prescribed immunosuppressants.
Acute rejection
There were 2265 cases of acute rejection in the study population in the first 6 months post-transplant. Compared with those with a BMI of 25 kg/m2, patients with a BMI of 35 kg/m2 were at a higher risk of developing acute rejection (Figure 2 andTable 2) [unadjusted hazard ratio (uHR) = 1.29, 95% CI 1.12–1.49]. However, this association largely disappeared after correcting for IS dosing (aHR = 1.09, 95% CI 0.93–1.29) (Supplementary data, Table S3). Underweight patients were less likely to have acute rejection but this association did not change when correcting for IS [adjusted hazard ratio (aHR) = 0.71, 95% CI 0.55–0.93] (Table 3).
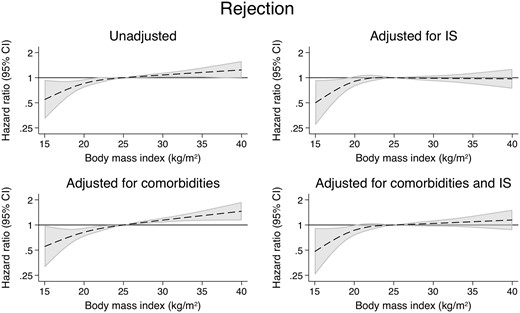
The associations between time-varying BMI and acute rejection.
The association between patient BMI of 35 kg/m2 and selected patient outcomes compared with patient BMI of 25 kg/m2
| Patient outcome | Unadjusted | Adjusted for demographics and comorbidities only | Adjusted for immunosuppressive dose only | Adjusted for demographics, comorbidities and immunosuppressive dose |
|---|---|---|---|---|
| HR (95% CI) | HR (95% CI) | HR (95% CI) | HR (95% CI) | |
| Acute rejection | 1.16 (1.01–1.32) | 1.29 (1.12–1.49) | 0.98 (0.84–1.14) | 1.09 (0.93–1.29) |
| Death from infection | 1.04 (0.77–1.41) | 0.91 (0.66–1.25) | 1.65 (1.14–2.38) | 1.54 (1.03–2.28) |
| Death from cancer | 0.85 (0.63–1.15) | 0.91 (0.67–1.24) | 0.78 (0.55–1.10) | 0.91 (0.64–1.30) |
| Skin cancer | 0.76 (0.66–0.88) | 0.86 (0.74–1.00) | 0.68 (0.58–0.80) | 0.82 (0.69–0.97) |
| Any non-skin cancer | 0.89 (0.75–1.06) | 0.90 (0.75–1.08) | 0.89 (0.73–1.09) | 0.94 (0.76–1.16) |
| Graft loss | 0.94 (0.85–1.04) | 0.84 (0.76–0.94) | 1.04 (0.92–1.17) | 0.93 (0.82–1.06) |
| Death-censored graft loss | 0.97 (0.85–1.10) | 0.88 (0.77–1.01) | 1.04 (0.88–1.23) | 0.94 (0.79–1.11) |
| Overall mortality | 0.91 (0.78–1.06) | 0.83 (0.71–0.97) | 1.03 (0.86–1.23) | 0.98 (0.81–1.18) |
The association between patient BMI of 18 kg/m2 and selected patient outcomes compared with patient BMI of 25 kg/m2
| Patient outcome | Unadjusted | Adjusted for demographics and comorbidities only | Adjusted for immunosuppressive dose only | Adjusted for demographics, comorbidities and immunosuppressive dose |
|---|---|---|---|---|
| HR (95% CI) | HR (95% CI) | HR (95% CI) | HR (95% CI) | |
| Acute rejection | 0.73 (0.59–0.91) | 0.71 (0.57–0.90) | 0.75 (0.58–0.97) | 0.71 (0.55–0.93) |
| Death from infection | 2.82 (1.97–4.04) | 3.28 (2.24–4.81) | 1.86 (1.19–2.90) | 2.27 (1.40–3.67) |
| Death from cancer | 1.68 (1.21–2.34) | 2.58 (1.83–3.65) | 2.01 (1.31–3.08) | 2.88 (1.83–4.54) |
| Skin cancer | 0.59 (0.43–0.80) | 1.00 (0.74–1.34) | 0.65 (0.47–0.89) | 0.94 (0.68–1.29) |
| Any non-skin cancer | 1.34 (1.06–1.70) | 1.70 (1.33–2.16) | 1.19 (0.89–1.60) | 1.48 (1.10–2.00) |
| Graft loss | 1.92 (1.70–2.17) | 2.11 (1.85–2.40) | 1.65 (1.41–1.93) | 1.87 (1.59–2.21) |
| Death-censored graft loss | 1.91 (1.60–2.28) | 1.75 (1.44–2.12) | 1.60 (1.28–2.00) | 1.59 (1.26–2.00) |
| Overall mortality | 1.89 (1.58–2.25) | 2.53 (2.11–3.05) | 1.71 (1.37–2.14) | 2.31 (1.82–2.92) |
Fatal infection
A total of 210 patients suffered fatal infections. Of note, patients with a BMI of 18 kg/m2 were more likely to suffer fatal infections than their counterparts with a BMI of 25 kg/m2, both before and after correcting for immunosuppressive dosing (uHR = 3.28, 95% CI 2.24–4.81; aHR = 2.27, 95% CI 1.40–3.67) (Figure 3 andTable 3). In comparison, patients with a BMI of 35 kg/m2 were also at a significantly higher risk of fatal infection, but only after correcting for immunosuppressive dosing (uHR = 0.91, 95% CI 0.66–1.25; aHR = 1.54, 95% CI 1.03–2.28) (Table 2 and Supplementary data, Table S4).
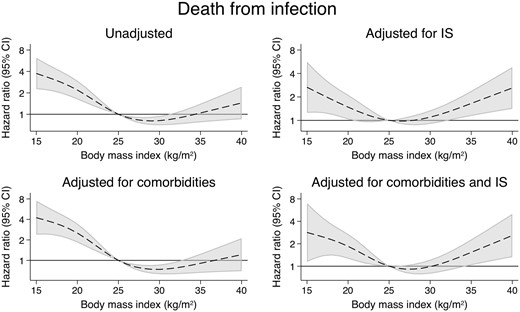
The associations between time-varying BMI and death from infection.
Malignancy
There were a total of 1535 cases of skin cancer (Figure 4), 844 cases of non-skin cancer (Figure 5) and 310 malignancy-related deaths (Figure 6). Compared with the models adjusting for demographics and comorbidities, the models additionally adjusted for IS did not substantially alter the associations between BMI and any of these outcomes (Supplementary data, Tables S5–S7). Examining cancer subtypes showed similar results [22] (Supplementary data, Figures S3–S6 and Tables S8–S13).
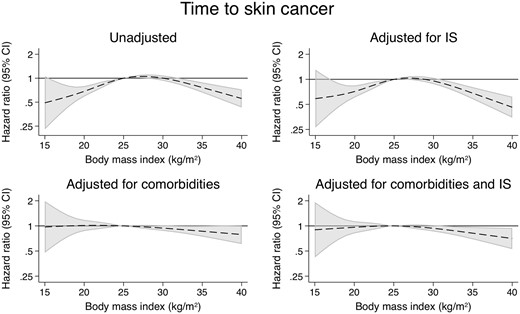
The associations between time-varying BMI and skin cancer.
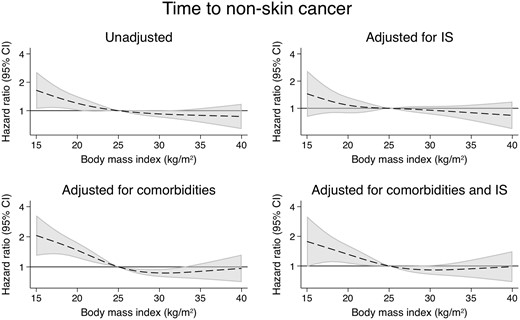
The associations between time-varying BMI and non-skin cancer.

The associations between time-varying BMI and death from cancer.
Patient and graft survival
Patients with a BMI of 35 kg/m2 had a slightly improved overall survival compared with their counterparts with a BMI of 25 kg/m2 (uHR = 0.83, 95% CI 0.71–0.97) (Figure 7 andTable 2). However, this association disappeared after correcting for IS dosing (aHR = 0.98, 95% CI 0.81–1.18). In comparison, patients with a BMI of 18 kg/m2 were found to have much higher rates of overall graft loss (uHR = 2.11, 95% CI 1.85–2.40; aHR = 1.87, 95% CI 1.59–2.21) (Figure 8) and death-censored graft loss (uHR = 1.75, 95% CI 1.44–2.12; aHR = 1.59, 95% CI 1.26–2.00) (Figure 9), as well as overall mortality (uHR = 2.53, 95% CI 2.11–3.05; aHR = 2.31, 95% CI 1.82–2.92), regardless of immunosuppressive burden (Table 3 and Supplementary data, Tables S15–S17).
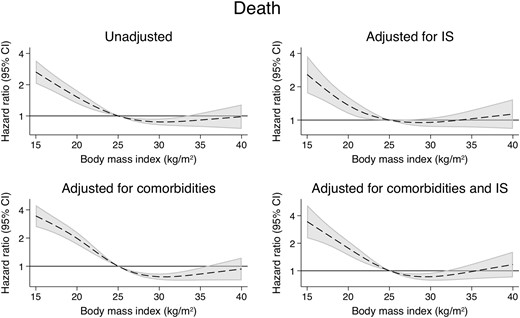
The associations between time-varying BMI and overall mortality.

The associations between time-varying BMI and overall graft loss.
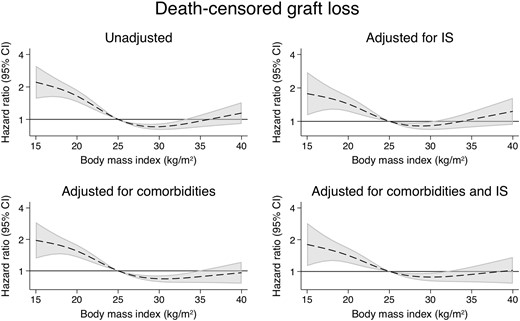
The associations between time-varying BMI and death-censored graft loss.
DISCUSSION
Using a large bi-national kidney transplant dataset, we examined in detail the relationship between BMI and acute rejection, fatal infection and malignancy, with and without correcting for IS dosing. We hypothesized that adjusting for IS would reveal a higher rejection risk in underweight patients (not confirmed) and lower risk in overweight and obese patients (confirmed). We hypothesized that adjusting for IS would reveal lower risks of fatal infection and cancer in underweight patients (confirmed and not confirmed, respectively) and higher risks in overweight and obese patients (confirmed and not confirmed, respectively).
Acute rejection
Consistent with existing studies [5, 6], we found that higher BMI was associated with an increased risk of acute rejection in the first 6 months post-transplant, independent of other risk factors. However, we found that this association largely disappeared after correcting for dosing of IS, consistent with our hypothesis that relative under-dosing of immunosuppressants may very well be a significant contributing factor. Prednisolone and MMF dosing were of particular relevance, with significant differences in dose/kilogram seen between different BMI groups.
Despite significant changes in practice over time [25], prednisolone is still used in over 90% of patients requiring maintenance IS post-kidney transplant in Australia and New Zealand [26, 27]. Dosing is typically recommended according to total rather than ideal body weight; however, insufficient data are available evaluating steroid exposure [28] or the pharmacokinetics of prednisolone and the effect of BMI, particularly in the transplant population [29]. Early prednisolone dosing may be important as rapid clearance may be seen in the very early post-transplant period [29], and prednisolone exposure (as well as other immunosuppressants) during this time is predictive of risk of DGF and rejection [30]. Dosing regimens vary between centres (Supplementary data, Figure S2), but our cohort received median dosing of 25–30 mg daily early after transplantation, gradually tapering to 6–7 mg daily 1 year post-transplant (Supplementary data, Table S14).
MMF is similarly a common component of maintenance IS. Although often prescribed at fixed doses, MMF has been shown to display nonlinear pharmacokinetics with significant inter- and intra-individual variability [32–33]. On the basis of such data, and the complex relationship between weight and both MPA area under the curve and clearance, it has been suggested that patients at the extremes of weight may be at risk of under- or over-IS unless doses are adjusted according to total body weight [34].
Our results are consistent with these suggestions, especially for overweight and obese patients, and suggest the need to consider modifying MMF dosing for patients with high BMI. Therapeutic drug monitoring, as is the case with calcineurin inhibitors, may in theory provide a means of ensuring appropriate mycophenolate exposure. However, current evidence is conflicting. Some studies have concluded that MMF dosing according to serum drug levels is associated with higher total doses, and subsequently lower rates of treatment failure and acute rejection with no significant difference in the rates of adverse effects [35, 36]. On the other hand, other research shows only non-inferiority for preventing treatment failure and acute rejection [37], and higher infection rates [38]. More studies are therefore required.
Death from infection
The increased risk of infection seen in kidney transplant recipients is believed to be mainly due to chronic IS, and may relate to the total burden of IS rather than any specific agents (with the possible exception of MMF and cytomegalovirus) [39]. Fatal infection rates have previously been shown to be higher in patients with low BMI [7]. Various hypotheses for this exist including a role for malnutrition. Our data demonstrate that low BMI is associated with higher rates of fatal infections with some attenuation after correcting for immunosuppressive dosing, thus potentially supporting the notion that excessive IS is an important factor in death from infection after transplantation. Similarly, overweight and obese patients had a lower risk of fatal infection before adjusting for IS, but a higher risk after adjusting for IS, which again is consistent with these patients receiving relatively less IS compared with underweight and normal weight patients. Whether weight adjustment of steroid and MMF dosing may reduce the burden of fatal infection among kidney recipients with low BMI remains to be proven.
Malignancy
As survival rates for kidney transplant recipients improve, malignancy has become the leading cause of death beyond the first-year post-transplant [27]. Overall, this is thought to be multifactorial, though a significant component is believed to be moderated by the duration and intensity of IS [40, 41].
Ours is the first study to investigate the impact of IS dosage in this area. Our results did not show strong changes in the associations between BMI and cancer outcomes after correcting for IS dosage, perhaps because of the multifactorial nature of cancer development. It is worth noting that there was an excess of infection-related cancers in underweight patients that were attenuated after adjusting for IS (Supplementary data, Figure S3 and Tables S8 and S13), which is consistent with the hypothesis of over-IS in this group. Nonetheless, our study was underpowered for these comparisons and our results must be interpreted cautiously in this light.
Patient and graft survival
We did not see a strong association between high BMI and adverse patient, overall graft or death-censored graft survival. Patients with a BMI of 35 kg/m2 had a relatively lower risk of death before adjusting for IS, but this benefit was no longer seen after adjusting for IS. Other data in this area are conflicting. A previous ANZDATA study found obesity not to be significantly associated with graft and patient survival, though underweight patients were found to have poorer death-censored graft survival rates [5]. However, a subsequent systematic review analysing over 209 000 kidney transplant recipients found non-obese patients to have higher rates of graft and patient survival at 3 years, though interestingly higher BMI was found to be protective for overall patient survival [6]. Another registry study, this time involving over 89 000 patients within United Network for Organ Sharing, found that while those with Classes II and III obesity had poorer outcomes, Class I obesity (BMI = 30–34.9 kg/m2) was not a significant risk factor for death-censored graft survival compared with their non-obese counterparts, and that in fact these patients had improved survival [42]. Similarly, a US Renal Data System database study found that patients with a BMI of 22–32 kg/m2 had the lowest risk for mortality [7]. In contrast, another systematic review found an association between obesity and increased rates of graft loss and death only in patients who received a transplant prior to 2000 [43]. Further research is required to explore the effect of BMI on graft and patient survival and the impact of any changes over time. It should be noted that our cohort only included a very small number of patients with Class II or III obesity.
Strengths and limitations
This study provides an extensive analysis of data collected annually on all adult patients who have undergone kidney transplantation in Australia or New Zealand over a 15-year period. However, it is not without limitations. First, this study is still limited to an extent by sample size, particularly with regards to underweight patients. Secondly, this study is retrospective. It is limited by possible indication bias where clinicians may have adjusted immunosuppressive drug regimens according to perceived risks of acute rejection, cancer and infection. For all outcomes apart from patient and overall graft survival, the presence of competing risks may have biased estimates. Furthermore, the ANZDATA registry data are restricted in some respects. For example, information is limited regarding some potential confounders (including donor-specific antibodies and patient compliance with medications), immunosuppressant drug levels (including trough levels for calcineurin inhibitors), potential drug interactions, non-fatal infections and drug dosing within the first month post-transplant (when most cases of acute rejection occurred). In addition, some data, such as skin cancers, may be underreported. Fortunately, there is evidence to suggest reporting of other malignancies may be more reliable [44].
Moreover, BMI is a crude measure of obesity. First, it fails to differentiate between muscle mass, fat and fluid as well as visceral and non-visceral fat. Secondly, associations between BMI, body fat percentages and body fat distribution differ between ethnic groups, such as Caucasians compared with Asian or Pacific Islander ethnicity groups. Debate therefore exists about the need to adjust BMI cut-offs for such populations. Waist circumference in conjunction with BMI may provide a more accurate picture of ‘fatness’ and the risk of obesity-related complications [45, 46], but these measurements are not collected by the ANZDATA registry. However, BMI remains directly related to weight, which likely has more relevance in drug dosing.
Future research
The effect of improved dose adjustments according to body weight needs to be evaluated. Further research in MMF therapeutic drug level monitoring is also required as the current evidence remains conflicting and sparse in some areas [32, 36, 47]. A better understanding of appropriate dose titration could also be beneficial in order to decrease the risk of acute rejection and graft loss associated with dose reductions in response to adverse effects [48]. The effect of obesity on the pharmacokinetics of immunosuppressants may present challenges in this respect, as might the continuing changes in prescribing practice [24]. Consequent changes in patient outcome would also need to be evaluated, particularly in the obese population where increases in prednisolone dosage may predispose to more weight gain and metabolic complications such as diabetes mellitus.
Additionally, though the clear majority of patients included in the ANZDATA registry are on immunosuppressive regimes containing corticosteroids, there is increasing conversation surrounding steroid-minimization and steroid-free regimes [27]. Further research would need to be performed to more closely examine outcomes in this group.
CONCLUSION
In summary, overweight and obese patients were at increased risk of acute rejection and reduced risk of fatal infections and overall mortality following kidney transplantation. Adjusting for IS dose/kilogram either attenuated or reversed these associations. These findings suggest that the associations between high BMI and outcomes are explained at least in part by relatively low IS exposure. Results for underweight patients and for cancer outcomes were more mixed, suggesting more complex causal pathways. These results suggest that clinicians should consider tailoring IS according to patient weight.
SUPPLEMENTARY DATA
Supplementary data are available at ndt online.
ACKNOWLEDGEMENTS
The data reported here have been supplied by the ANZDATA Registry. The interpretation and reporting of this data are the responsibility of the authors and in no way should be seen as an official policy or interpretation of the ANZDATA Registry. We are grateful to the renal units in Australia and New Zealand for their continued support of ANZDATA. No funding was received by the authors for the preparation of this manuscript.
AUTHORS’ CONTRIBUTIONS
K.F. and P.C. were involved in the acquisition, analysis and interpretation of the data and drafting the paper; K.F., P.C. and S.C. performed the research, and P.C. was involved in research conception. All authors were involved in research design and editing and final approval of the paper.
CONFLICT OF INTEREST STATEMENT
None declared.
REFERENCES
World Health Organisation. Body mass index - BMI,
ANZDATA Registry. 30th Report, Chapter 8: Transplantation. Australia and New Zealand Dialysis and Transplant Registry, Adelaide, Australia,
ANZDATA Registry. 38th Report, Chapter 8: Transplantation. Australia and New Zealand Dialysis and Transplant Registry, Adelaide, Australia,


Comments