


Abstract
Erythropoietin (EPO) has been reported as a novel determinant of fibroblast growth factor 23 (FGF23) production; however, it is unknown whether FGF23 is stimulated by chronic exposure to EPO or by EPO administration in nonpolycystic chronic kidney disease (CKD) models.
We analyzed the effects of chronic EPO on FGF23 in murine models with chronically high EPO levels and normal kidney function. We studied the effects of exogenous EPO on FGF23 in wild-type mice, with and without CKD, injected with EPO. Also, in four independent human CKD cohorts, we evaluated associations between FGF23 and serum EPO levels or exogenous EPO dose.
Mice with high endogenous EPO have elevated circulating total FGF23, increased disproportionately to intact FGF23, suggesting coupling of increased FGF23 production with increased proteolytic cleavage. Similarly, in wild-type mice with and without CKD, a single exogenous EPO dose acutely increases circulating total FGF23 out of proportion to intact FGF23. In these murine models, the bone marrow is shown to be a novel source of EPO-stimulated FGF23 production. In humans, serum EPO levels and recombinant human EPO dose are positively and independently associated with total FGF23 levels across the spectrum of CKD and after kidney transplantation. In our largest cohort of 680 renal transplant recipients, serum EPO levels are associated with total FGF23, but not intact FGF23, consistent with the effects of EPO on FGF23 production and metabolism observed in our murine models.
EPO affects FGF23 production and metabolism, which may have important implications for CKD patients.
INTRODUCTION
The development of anemia [1] and elevated fibroblast growth factor 23 (FGF23) levels [2] are among the earliest changes observed in chronic kidney disease (CKD), and complex relationships among FGF23, anemia and anemia-related factors are emerging. It has recently been demonstrated that iron deficiency [3–6] and erythropoietin (EPO) [7–10] are previously unrecognized nonmineral determinants of FGF23 production. Characterization of the relationships among these factors is important as, in CKD, both elevated FGF23 levels and anemia are associated with disease progression [11–15], cardiovascular morbidity [16–20] and all-cause mortality [12, 21, 22]. Furthermore, higher EPO dosing is itself associated with cardiovascular morbidity and mortality in CKD [23, 24].
A critically important hormone in CKD-mineral bone disorder (CKD-MBD), FGF23 is secreted by osteocytes, induces phosphaturia and decreases renal 1α-hydroxylase expression [25], physiologically functioning as a homeostatic regulator of phosphate and a counterregulatory hormone to 1,25-dihydroxyvitamin D. FGF23 levels increase early in the course of CKD and continue to rise as the glomerular filtration rate (GFR) decreases [2, 26–28]. Regulation of FGF23 in CKD remains incompletely understood. Several factors may increase FGF23 production, including phosphate [29, 30], 1,25-dihydroxyvitamin D [29, 31], parathyroid hormone (PTH) [32, 33], calcium [34], inflammation [5] and iron deficiency [3–6].
In murine models demonstrating the effect of iron deficiency on FGF23, the iron deficiency is accompanied by anemia, raising the question of whether other anemia-related factors, such as EPO, may also affect FGF23 metabolism. Indeed, recombinant human EPO (rhEPO) acutely increases circulating FGF23 levels in rodents with normal kidney function [7–10], mice with CKD (Jck model of polycystic kidney disease) [7] and humans with normal kidney function [7]. The effect of EPO on FGF23 production may be relevant for patients with impaired kidney function, during both early and late stages of CKD. Early on, endogenous serum EPO levels increase as hemoglobin declines [35]. As CKD progresses and increased serum EPO concentrations become insufficient to maintain adequate hemoglobin levels, exogenous rhEPO is administered to bolster erythropoiesis.
In order to further investigate links between EPO and FGF23, we characterized murine models with high endogenous EPO levels, assessed the effects of a single rhEPO dose in a (nonpolycystic) murine CKD model, and evaluated associations between endogenous serum EPO levels and FGF23 in nondialysis, pre- and posttransplant human CKD cohorts and between exogenous rhEPO dose and FGF23 in dialysis patients.
MATERIALS AND METHODS
Full methods are detailed in the Supplemental Material. To assess the effects of endogenous EPO on FGF23, we characterized murine models with chronically high EPO levels: transgenic mice overexpressing human EPO (Tg6 mice [36], which develop relative iron deficiency) and transgenic EPO mice supplemented with iron and beta-thalassemia intermedia mice [Hbbth3/+ mice (Th3/+), which spontaneously develop iron overload on a standard iron diet]. To assess the effects of exogenous EPO on FGF23, we injected wild-type C57BL/6 mice, with and without 0.2% adenine diet-induced CKD, with a single intraperitoneal rhEPO dose (∼67 U/g) and assessed FGF23 parameters 6 and 24 h post-injection. At the time of euthanasia, we collected whole blood, plasma, serum, livers and tibias, from which we flushed the bone marrow with saline solution and 28 G syringes. We assessed bone Fgf23 mRNA expression, marrow Fgf23 mRNA expression, plasma C-terminal (total) FGF23 and plasma intact FGF23 (iFGF23), among other parameters. Whereas the C-terminal (total) FGF23 assay detects both intact FGF23 and C-terminal FGF23 fragments, thus functioning as a surrogate measure of all translated FGF23, the intact FGF23 assay detects only full-length, bioactive FGF23.
To assess associations between serum EPO levels or rhEPO dose and FGF23 levels in humans with CKD, we characterized multiple human cohorts across the spectrum of CKD, including predialysis, dialysis-dependent and post-kidney transplant CKD patients. The nontransplant CKD patients were from the University of California Los Angeles, and the posttransplant CKD patients from the University Medical Center Groningen. The posttransplant patients comprised the largest cohort, numbering 680 subjects. Multiple linear regression models were developed to investigate EPO–FGF23 associations. Models were adjusted for age, sex, estimated GFR (eGFR), time since transplantation (in the posttransplant cohort), calcium, phosphate, PTH, hemoglobin, ferritin and C-reactive protein (CRP) levels. Mediation analysis was performed in the posttransplant cohort to assess whether hemoglobin mediated the association between EPO and FGF23, independent of adjustment for potential confounders.
RESULTS
Characterization of transgenic EPO-overexpressing mice
To assess the effects of chronically high endogenous EPO levels on FGF23, we characterized 7- to 11-week-old transgenic mice overexpressing human EPO (Tg6 mice [36]). Whereas the wild-type littermates had undetectable plasma human EPO, the Tg6 mice had increased human EPO concentrations (mean 295 ± 69 mIU/mL). Compared with their wild-type littermates, the Tg6 mice were polycythemic (Figure 1a), had similar kidney function (Figure 1b], had similar phosphate levels (Figure 1c) and were relatively iron deficient, as indicated by significantly lower liver iron (Figure 1e) and hepcidin (Figure 1f). The Tg6 mice had evidence of increased FGF23 production, with significantly elevated bone Fgf23 mRNA expression (Figure 1g), marrow Fgf23 mRNA expression (Figure 1h) and circulating total FGF23 levels [mean (SD): 3175 (1271) versus 340 (40) pg/mL, P < 0.001; Figure 1i]. Circulating intact FGF23 levels were also significantly increased [589 (100) versus 317 (36) pg/mL, P < 0.001; Figure 1j], but to a much lesser extent than total FGF23 levels. Indeed, the percentage of circulating FGF23 that was intact was very low (Figure 1k), suggesting that, in this model, increased FGF23 production is coupled, albeit incompletely, with increased proteolytic cleavage of FGF23.
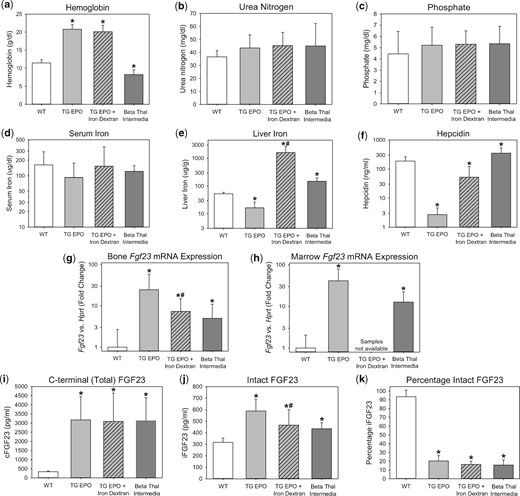
Characterization of FGF23 in transgenic EPO-overexpressing mice and beta-thalassemia intermedia mice. Groups included are wild-type mice (WT), transgenic EPO-overexpressing mice (TG EPO), transgenic EPO-overexpressing mice treated with a single intraperitoneal dose of 10 mg iron dextran 24 h prior to euthanasia (TG EPO + Iron Dextran) and beta-thalassemia intermedia mice. Parameters were measured at the age of 7–11 weeks for the WT and TG EPO mice, and at the age of 9–28 weeks for the beta-thalassemia intermedia mice, and include (a) hemoglobin, (b) serum urea nitrogen, (c) serum phosphate, (d) serum iron, (e) liver iron, (f) serum hepcidin, (g) bone Fgf23 mRNA expression, (h) marrow Fgf23 mRNA expression, (i) plasma C-terminal (total) FGF23, (j) plasma intact FGF23 and (k) percentage intact FGF23. *Denotes a statistically significant pairwise comparison versus the WT group (P < 0.05, with subsequent Benjamini–Hochberg correction for multiple comparisons). #Denotes a statistically significant pairwise comparison of TG EPO versus TG EPO + Iron Dextran (P < 0.05). Data are presented as mean and SD. n = 7–12 mice per group.
The Tg6 mice were relatively iron deficient, which may increase FGF23 levels [3–6]. Iron dextran treatment of Tg6 mice improved iron parameters (Figures 1e–f). However, iron dextran treatment only partially decreased bone Fgf23 mRNA expression (Figure 1g), did not change circulating total FGF23 levels (Figure 1i) and only partially decreased circulating iFGF23 levels (Figure 1j). Therefore, high EPO levels, as opposed to relative iron deficiency, predominantly drive increased FGF23 production in this model.
Characterization of beta-thalassemia intermedia mice
To assess the effects of chronically high endogenous EPO levels on FGF23 in a contrasting murine model, we characterized beta-thalassemia intermedia mice (Th3/+). Like the Tg6 mice, the Th3/+ mice had high EPO levels (mean serum mouse EPO 1690 ± 620 pg/mL), but they differed in their hemoglobin and iron status. Whereas the Tg6 mice were polycythemic and relatively iron deficient, the Th3/+ mice were anemic and spontaneously iron-overloaded (Figures 1a, e–f). Despite differences in iron status, FGF23 production was similarly elevated in the two models, correlating with high endogenous EPO levels. The Th3/+ mice had significantly increased bone Fgf23 mRNA expression (Figure 1g), marrow Fgf23 mRNA expression (Figure 1h) and circulating total FGF23 levels [3129 (1256) versus 340 (40) pg/mL, P < 0.001; Figure 1i]. Circulating intact FGF23 levels were also significantly increased [436 (52) versus 317 (36) pg/mL, P < 0.001; Figure 1j], but to a much lesser extent than total FGF23 levels, again suggesting coupling of increased FGF23 production with increased FGF23 proteolytic cleavage.
Administration of rhEPO to mice with normal and impaired kidney function
To evaluate the effects of exogenous EPO administration on FGF23, we analyzed wild-type mice, with and without CKD, 6 h and 24 h after a single intraperitoneal injection of rhEPO. Urea nitrogen concentrations in the EPO-treated non-CKD and CKD groups did not differ from their respective baselines or compared with saline-treated time point controls (Figure 2a). In the EPO-treated non-CKD and CKD groups, serum phosphate did not differ from their respective baselines or relative to saline-treated time point controls (Figure 2b). Serum iron decreased only at the 24-h time point in the EPO-treated non-CKD group, and did not differ from baseline in the EPO-treated CKD group (Figure 2c). In the EPO-treated non-CKD and CKD groups, at the 6-h time point, there were large increases in bone Fgf23 mRNA expression (Figure 2d), marrow Fgf23 mRNA expression (Figure 2e) and circulating total FGF23 levels versus baseline [non-CKD: geometric mean (95% confidence interval, 95% CI) of 3289 (2305–4692) versus 207 (182–236) pg/mL, P < 0.001; CKD: 9376 (2280–38 559) versus 2056 (1282–3297) pg/mL, P = 0.007; Figure 2f], demonstrating EPO-induced increased FGF23 production. In the non-CKD group, circulating intact FGF23 levels also significantly increased at the 6-h time point [385 (322–461) versus 187 (171–203) pg/mL, P < 0.001; Figure 2g), but to a lesser extent than total FGF23 levels. In the CKD group, changes in intact FGF23 did not reach statistical significance [4046 (653–25 079) versus 1648 (741–3665) pg/mL, P = 0.17]. The calculated percentage intact FGF23 in the EPO-treated CKD and non-CKD groups at the 6-h time point was decreased (Figure 2h), consistent with a coupling of FGF23 production with proteolytic cleavage. At the 24-h time point, the effect of EPO on FGF23 parameters was diminished, more so in the non-CKD group than in the CKD group.
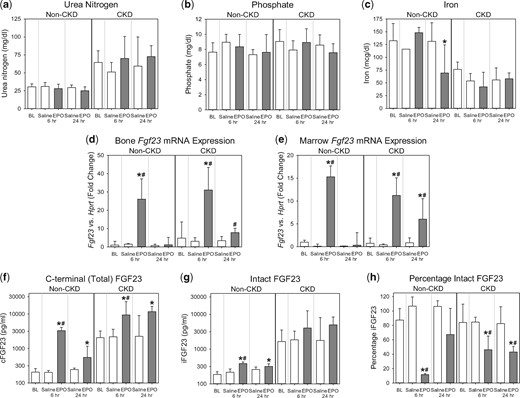
Acute effects of rhEPO on FGF23 in wild-type mice with and without CKD. Groups included are wild-type mice, with and without adenine diet-induced CKD, intraperitoneally injected with a single dose of ∼67 U/g rhEPO or saline vehicle; at baseline (BL), 6 h postinjection and 24 h postinjection. Parameters shown are (a) serum urea nitrogen, (b) serum phosphate, (c) serum iron, (d) bone Fgf23 mRNA expression, (e) marrow Fgf23 mRNA expression, (f) plasma C-terminal (total) FGF23, (g) plasma intact FGF23 and (h) percentage intact FGF23. *Denotes a statistically significant pairwise comparison of an EPO-treated group versus baseline (P < 0.05, with subsequent Benjamini–Hochberg correction for multiple comparisons). #Denotes a statistically significant pairwise comparison of an EPO-treated group versus the saline-treated group at the same time point (P < 0.05, with subsequent Benjamini–Hochberg correction for multiple comparisons). Data are presented as mean and SD. n = 4–6 mice per group, with the exception of the baseline non-CKD group, which contained 8–20 mice, depending on the parameter measured.
Expression of enzymes involved in FGF23 cleavage
In the mice with high endogenous EPO levels, and in the mice injected with rhEPO, we assessed bone and marrow mRNA expression of enzymes involved in FGF23 cleavage, including N-acetylgalactosaminyltransferase 3 (GALNT3), FAM20C, Furin and PC5/6 (Pcsk5) [37, 38]. In the high endogenous EPO models, we observed significantly decreased bone and marrow Galnt3 mRNA expression, no difference in Fam20c mRNA expression, no difference in Furin mRNA expression and significantly decreased bone and marrow Pcsk5 mRNA expression (Supplementary data, Figure S1). In the CKD and non-CKD mice injected with rhEPO, at 6 h postinjection, we observed no significant differences in bone or marrow Galnt3, Fam20c or Furin mRNA expression (Supplementary data, Figure S2). We observed no changes in bone Pcsk5 mRNA expression; however, marrow Pcsk5 mRNA expression was significantly decreased in the EPO-treated non-CKD mice (Supplementary data, Figure S2).
Associations between serum EPO and circulating FGF23 levels in nondialysis CKD patients
We next assessed associations between serum EPO and circulating FGF23 levels in a cohort of nondialysis CKD patients. Characteristics of this cohort are listed in Supplementary data, Table S1. This cohort of 42 CKD patients included both adult and pediatric subjects. The mean eGFR was 34 ± 18 mL/min/1.73 m2, and no patient received rhEPO. In multiple linear regression modeling, after adjusting for age, eGFR, calcium, phosphate, PTH, transferrin saturation (TSAT), ferritin, hemoglobin and CRP, serum EPO was positively associated with Log cFGF23 (β = 0.48, P = 0.001; model-adjusted R2 = 0.51). However, the association was attenuated when Log iFGF23 was substituted for Log cFGF23 in the fully adjusted model as the dependent variable (EPO β = 0.28, P = 0.07; model-adjusted R2 = 0.41). Qualitatively similar results were obtained when iFGF23 was measured with the Kainos assay (EPO β = 0.27, P = 0.06). In the fully adjusted model, Log cFGF23 was not associated with hemoglobin (P = 0.22) and, in a model adjusted for the aforementioned covariables, hemoglobin was not associated with serum EPO (P = 0.35).
Baseline characteristics of the posttransplant CKD cohort consisting of 680 renal transplant recipients
| Parameter | Tertiles of EPO (IU/L) | ||||
|---|---|---|---|---|---|
| All patients (n = 680) | T1 (n = 226) [1.0–5.0] | T2 (n = 226) [5.1–9.4] | T3 (n = 228) [9.5–539] | P-value | |
| Age (years) | 53 ± 13 | 50 ± 13 | 54 ± 13 | 56 ± 12 | <0.001 |
| Sex (male), n (%) | 383 (56) | 132 (58) | 131 (58) | 120 (53) | 0.37 |
| Body mass index (kg/m2) | 26.6 ± 4.8 | 25.8 ± 4.2 | 27.1 ± 5.1 | 27.1 ± 4.9 | 0.006 |
| Body surface area (m2) | 1.9 ± 0.2 | 1.9 ± 0.2 | 2.0 ± 0.2 | 1.9 ± 0.2 | 0.12 |
| Alcohol use, n (%) | 551 (81) | 182 (81) | 179 (79) | 190 (83) | 0.50 |
| Smoking status | 0.14 | ||||
| Never smoker, n (%) | 306 (45) | 110 (49) | 104 (46) | 92 (40) | |
| Former smoker, n (%) | 293 (43) | 85 (38) | 93 (41) | 112 (49) | |
| Current smoker, n (%) | 81 (12) | 31 (14) | 27 (12) | 23 (10) | |
| Time since transplantation (years) | 5.4 (1.9–12.1) | 5.1 (1.8–12.1) | 5.6 (1.8–11.0) | 5.8 (2.2–13.7) | 0.46 |
| Diabetes mellitusa, n (%) | 161 (24) | 37 (16) | 58 (26) | 66 (29) | 0.005 |
| Systolic blood pressure (mmHg) | 136 ± 17 | 135 ± 17 | 135 ± 18 | 137 ± 17 | 0.51 |
| Diastolic blood pressure (mmHg) | 82 ± 11 | 83 ± 12 | 82 ± 11 | 83 ± 10 | 0.63 |
| Laboratory measurements | |||||
| iFGF23 (pg/mL) | 61 (43–100) | 61 (46–103) | 59 (42–92) | 63 (47–106) | 0.18 |
| cFGF23 (RU/mL) | 140 (95–234) | 131 (91–184) | 137 (94–204) | 172 (107–323) | <0.001 |
| Hemoglobin (g/dL) | 13.2 ± 1.7 | 13.3 ± 1.6 | 13.4 ± 1.7 | 13.0 ± 1.9 | 0.03 |
| MCV (fL) | 91 ± 6 | 91 ± 5 | 91 ± 6 | 90 ± 7 | 0.94 |
| Ferritin (µg/L) | 118 (54–222) | 141 (80–238) | 115 (52–242) | 92 (42–184) | <0.001 |
| TSAT (%) | 25.4 ± 10.6 | 28.1 ± 10.2 | 25.2 ± 9.8 | 22.8 ± 11.1 | <0.001 |
| Total cholesterol (mmol/L) | 5.1 ± 1.1 | 5.2 ± 1.2 | 5.1 ± 1.0 | 5.1 ± 1.2 | 0.76 |
| Phosphate (mmol/L) | 1.0 ± 0.2 | 1.0 ± 0.2 | 1.0 ± 0.2 | 1.0 ± 0.2 | 0.98 |
| Calcium (mmol/L) | 2.40 ± 0.15 | 2.42 ± 0.15 | 2.39 ± 0.16 | 2.40 ± 0.14 | 0.24 |
| PTH (pmol/L) | 8.9 (5.9–14.8) | 8.5 (5.5–13.8) | 9.1 (6.2–14.5) | 9.2 (6.3–16.8) | 0.16 |
| eGFRb (mL/min/1.73 m2) | 52 ± 19 | 50 ± 19 | 52 ± 19 | 52 ± 19 | 0.33 |
| Creatinine (µmol/L) | 138 ± 59 | 146 ± 69 | 135 ± 55 | 133 ± 51 | 0.03 |
| Proteinuriac, n (%) | 154 (23) | 51 (23) | 41 (18) | 62 (27) | 0.07 |
| hs-CRP (mg/L) | 1.6 (0.7–4.6) | 1.4 (0.6–3.1) | 1.7 (0.8–4.9) | 1.8 (0.8–5.3) | 0.01 |
| Treatment | |||||
| ACE- inhibitors, n (%) | 220 (34) | 89 (39) | 72 (32) | 59 (26) | 0.009 |
| Beta-blocker, n (%) | 428 (63) | 138 (61) | 138 (61) | 152 (67) | 0.38 |
| Calcium channel blockers, n (%) | 165 (24) | 47 (21) | 67 (30) | 51 (22) | 0.06 |
| Diuretic use, n (%) | 275 (40) | 76 (34) | 88 (39) | 111 (49) | 0.004 |
| ESA use, n (%) | 15 (2) | 7 (3) | 1 (0) | 7 (3) | 0.09 |
| Iron supplements, n (%) | 41 (6) | 14 (6) | 11 (5) | 16 (7) | 0.63 |
Values are means ± SD, medians (interquartile range) or proportions (%).
Diabetes was defined as the use of antidiabetic medication or a fasting plasma glucose ≥7.0 mmol/L.
eGFR was determined using the Modification of Diet in Renal Disease equation.
Proteinuria was defined as urinary protein excretion ≥0.5 g/24 h.
ACE, angiotensin-converting enzyme; cFGF23, C-terminal fibroblast growth factor 23; hs-CRP, high-sensitivity C-reactive protein; MCV, mean corpuscular volume; RTRs, renal transplant recipients.
Associations between rhEPO dose and circulating FGF23 levels in dialysis patients
We next assessed associations between rhEPO dose and circulating FGF23 levels in a cohort of dialysis patients. Characteristics of this cohort are listed in Supplementary data, Table S1. This cohort of 79 dialysis patients included both adult and pediatric subjects. In multiple linear regression modeling, after adjusting for age, calcium, phosphate, PTH, TSAT, ferritin, hemoglobin and CRP, rhEPO/kg was positively associated with Log cFGF23 (β = 0.22, P = 0.033; model-adjusted R2 = 0.43). However, the association was attenuated when Log iFGF23 was substituted into the fully adjusted model as the dependent variable (rhEPO/kg β = 0.13, P = 0.21; model-adjusted R2 = 0.41). In a model adjusted for Log age, Log cFGF23, calcium, phosphate, Log PTH, TSAT, Log ferritin and Log CRP, hemoglobin was inversely associated with Log rhEPO/kg (β = −0.24, P = 0.038). Log cFGF23 was not associated with hemoglobin (P = 0.54) in the previously described fully adjusted model.
Associations between serum EPO and circulating FGF23 levels in kidney transplant recipients
We next assessed associations between serum EPO and circulating FGF23 levels in a large cohort of adult kidney transplant patients. Characteristics of this cohort are listed in Table 1. In this cohort of 680 stable kidney transplant recipients, the mean age was 53 ± 13 years, the mean eGFR was 52 ± 19 mL/min/1.73 m2 and assessment occurred at a median of 5.4 (1.9–12.1) years posttransplant. In univariable analysis, Log EPO was associated with Log cFGF23 levels (β = 0.24, P < 0.001), but not Log iFGF23 levels (β = 0.04, P = 0.35). In multivariable analysis, after adjusting for age, sex, eGFR, time since transplantation, calcium, phosphate, Log PTH, hemoglobin, Log ferritin and Log CRP, Log EPO remained positively and significantly associated with Log cFGF23 (β = 0.14, P < 0.001). Further, in a multivariable stepwise backward regression analysis, Log EPO remained one of the major determinants of Log cFGF23 as shown in Table 2. Total FGF23 was also independently and inversely associated with hemoglobin (β = −0.20, P < 0.001), and hemoglobin was independently and inversely associated with Log EPO (β = −0.16, P < 0.001), both after adjustment for age, sex, eGFR, time since transplantation, serum phosphate and Log CRP levels. Mediation analysis was performed to quantify how much of the association between total FGF23 and EPO was explained by variation in hemoglobin. In a multivariable model adjusted for age, sex, eGFR, time since transplantation, serum phosphate and Log CRP levels, hemoglobin mediated only 8.3% of the association between Log EPO and Log cFGF23 (Supplementary data, Table S2). In a sensitivity analysis, we excluded kidney transplant patients on erythropoiesis-stimulating agents (ESA, n = 15), and repeated the multivariable model. Log EPO remained independently and positively associated with Log cFGF23 (β = 0.13, P < 0.001).
Univariable and multivariable linear regression modeling of determinants of circulating total FGF23
| Parameter | Univariable analysis | Multivariable analysis | ||
|---|---|---|---|---|
| std. ß | P-value | std. ß | P-value | |
| EPO (IU/L) | 0.24 | <0.001 | 0.14 | <0.001 |
| Age (years) | 0.08 | 0.05 | ||
| Sex (male) (yes versus no) | 0.05 | 0.18 | −0.09 | 0.01 |
| Time since transplantation (years) | −0.04 | 0.36 | ||
| eGFR (mL/min/1.73 m2) | −0.50 | <0.001 | −0.38 | <0.001 |
| Calcium (mmol/L) | 0.01 | 0.78 | ||
| Phosphate (mmol/L) | 0.34 | <0.001 | 0.20 | <0.001 |
| PTH (pmol/L) | 0.17 | <0.001 | 0.12 | <0.001 |
| Ferritin (µg/L) | −0.34 | <0.001 | −0.33 | <0.001 |
| Hemoglobin (g/dL) | −0.37 | <0.001 | −0.09 | 0.005 |
| hs-CRP (mg/dL) | 0.19 | <0.001 | 0.14 | <0.001 |
Univariable linear regression analysis follow by multivariable stepwise backward linear regression analysis. cFGF23, EPO, ferritin, hs-CRP and PTH levels have been log-transformed due to skewed distribution.
hs-CRP, high-sensitivity C-reactive protein.
DISCUSSION
FGF23 is a key hormone in CKD-MBD pathophysiology, contributing to the maintenance of normophosphatemia until late-stage CKD [2, 28], but likely at the expense of adverse, ‘off-target’ effects such as CKD progression [11–13] and cardiac hypertrophy [17]. Studies from our group and others have demonstrated that EPO stimulates FGF23 production, but couples increased transcription with increased posttranslational cleavage, thus attenuating effects on bioactive intact FGF23 levels [7–10].
In the current study, we extend the evidence that EPO, both endogenous and exogenous, affects FGF23 production and metabolism to the settings of chronically increased circulating EPO levels and CKD, both pre- and posttransplant. In our murine models with high endogenous EPO concentrations—the transgenic EPO-overexpressing mice and the beta-thalassemia mice—circulating total FGF23 levels are markedly elevated and increased out of proportion to intact FGF23 levels, demonstrating that increased FGF23 production is coupled, albeit incompletely, with increased FGF23 cleavage. Importantly, these effects are observed independent of iron status, which is another factor that affects both FGF23 production and metabolism [3–6, 22]. In our wild-type mice injected with a single dose of rhEPO, similar effects were observed: large increases in circulating total FGF23 levels, with smaller effects on intact FGF23 concentrations. Important to note is that, in the CKD model, changes in intact FGF23 did not reach statistical significance. Our human data are consistent with the observations made in the murine models. Across the spectrum of CKD, serum EPO levels or rhEPO doses are independently associated with total FGF23, but not intact FGF23, suggesting a coupling of increased production with increased cleavage.
Our results provide further evidence that EPO-stimulated bone marrow represents a novel source of FGF23 production. Our high endogenous EPO murine models and our wild-type mice treated with rhEPO had increased marrow Fgf23 mRNA expression. This was not caused by contaminating bone fragments within the marrow, as the flushed marrow samples had little Col1a1 mRNA expression, suggesting the presence of very few residual bone cells (Supplementary data, Figure S3). We have previously demonstrated that mice with pharmacologically ablated bone marrow have attenuated increases in circulating total FGF23 levels (with no change in bone Fgf23 mRNA expression) in response to EPO [7]. Furthermore, isolated murine bone marrow cells treated ex vivo with EPO demonstrate acute increases in Fgf23 mRNA expression [7]. Although it is unknown which bone marrow cell subpopulation produces FGF23 in response to EPO, it has been shown that EPO markedly increases Fgf23 mRNA expression in Ter119+ cells (erythroid lineage) [8] and in lineage-negative, Sca1-positive, c-kit-positive (LSK) cells, a hematopoietic progenitor cell subset [7], but not in common myeloid progenitor cells [7]. Although we also observed increased bone Fgf23 mRNA expression, we cannot rule out some degree of residual marrow contamination.
Since in our murine models, circulating total FGF23 is increased out of proportion to intact FGF23, elevations in total FGF23 levels represent mostly increased C-terminal fragments, the biological activity of which is uncertain. Previously, it has been reported that C-terminal FGF23 at high concentrations may function as an FGF23 antagonist, competing with intact FGF23 for binding to the FGF receptor [39]. Additionally, it has been shown in vitro that treatment with C-terminal FGF23 increases the cell surface area of adult rat ventricular myocytes [40]. In further studies, the biological relevance of elevated concentrations of C-terminal FGF23 fragments needs to be delineated in more detail.
The mechanism by which EPO increases bone and marrow FGF23 transcription is currently unknown. Furthermore, it is unknown how EPO increases FGF23 posttranslational cleavage. Regulation of FGF23 posttranslational cleavage is a complex process involving several enzymes, including N-acetylgalactosaminyltransferase 3 (GALNT3), FAM20C, Furin and PC5/6 (Pcsk5) [37, 38]. Furin and PC5/6 are proprotein convertases that can cleave FGF23; GALNT3 glycosylates FGF23 at its cleavage site, inhibiting proteolysis; and FAM20C phosphorylates FGF23 at its cleavage site, inhibiting GALNT3-mediated glycosylation. In the current study, we assessed bone and marrow Galnt3, Fam20c, Furin and Pcsk5 mRNA expression. In the mice with chronically elevated endogenous EPO levels, we observed decreased bone and marrow Galnt3 messenger RNA expression, which may allow for increased FGF23 cleavage [41]. In wild-type mice with phlebotomy-induced acute elevations in serum EPO concentrations, Rabadi et al. observed decreased Galnt3 mRNA expression in unfractionated bone marrow cells but not in isolated Ter119+ cells [8]. Additionally, in our mice with high endogenous EPO levels, there were no changes in Fam20c or Furin mRNA expression, but we did observe decreased bone and marrow Pcsk5 mRNA expression, despite increased FGF23 cleavage. Further studies are needed to elucidate the mechanisms by which EPO may directly or indirectly affect FGF23 cleavage.
Interestingly, recent studies have also described a converse direct relationship between FGF23 and EPO. In wild-type mice, the administration of recombinant human FGF23 decreases serum EPO concentrations [42], and the administration of an FGF23 blocking peptide increases serum EPO concentrations [43]. These data suggest that FGF23 may have negative regulatory effects on erythropoiesis. In humans with CKD, elevated circulating total FGF23 levels are associated with both prevalent and incident anemia [44]. We observed a similar inverse relationship between total FGF23 and hemoglobin in our posttransplant CKD cohort. Given the inverse association between circulating total FGF23 and hemoglobin, and the inverse association between hemoglobin and serum EPO levels [35], the observed positive association between serum EPO and total FGF23 may be bidirectional in nature. As supported by our murine studies, EPO may directly increase total FGF23 levels. Conversely, higher total FGF23 may be indirectly associated with higher serum EPO via lower hemoglobin concentrations. However, mediation analysis in the posttransplant CKD cohort revealed that variation in hemoglobin concentrations explained relatively little of the positive association between serum EPO and total FGF23, supporting the possibility of a direct effect of EPO to increase total FGF23 levels.
In summary, the current results demonstrate that FGF23 production and cleavage are increased irrespective of iron status in murine models with high endogenous EPO concentrations and in wild-type mice with and without CKD treated with a single rhEPO dose. In addition, we have shown in human studies across the spectrum of CKD and postrenal transplantation that serum EPO and rhEPO dose, independent of iron status and hemoglobin, are positively associated with circulating total FGF23 levels, but not intact FGF23. Again, this suggests that EPO leads to an upregulated production and concomitantly increased cleavage of FGF23. Further studies are needed to identify the mechanisms by which EPO increases FGF23 expression, as well as the mechanisms by which EPO may affect regulation of FGF23 cleavage. In the setting of elevated endogenous EPO levels or exogenous EPO administration, the degree to which increased FGF23 proteolytic cleavage offsets increased FGF23 production determines the amount of circulating bioactive intact FGF23. As such, there may be important implications in CKD, as endogenous EPO levels are increased in early CKD [35], exogenous EPO is used almost universally in late CKD, and FGF23 cleavage may be impaired as CKD progresses [45, 46]. The current study underscores the complex interrelationships among aspects of CKD-related anemia, CKD-MBD and their respective treatment modalities.
SUPPLEMENTARY DATA
Supplementary data are available at ndt online.
FUNDING
The University of California Los Angeles (UCLA) studies were supported in part by grants NIH/NCATS UCLA CTSI UL1TR000124, NIH/NIDDK K08DK111980 and NIH/NIDDK K12HD034610. The University Medical Center Groningen (UMCG) studies are based on the TransplantLines Food and Nutrition Biobank and Cohort Study (TxL-FN) (NCT02811835), and on the TransplantLines Insulin Resistance and Inflammation (TxL-IRI) cohort study (NCT03272854).
AUTHORS’ CONTRIBUTIONS
M.R.H., E.N., I.B.S. and T.G. designed the UCLA mouse and human studies; S.J.L.B. designed the UMCG human studies; M.R.H., M.R., K.C., V.G., B.Q. and G.J. conducted the UCLA mouse experiments; B.G. and G.R. collected the UCLA human data; S.J.L.B. and J.J.v.Z. collected the UMCG human data; M.R.H. analyzed the UCLA mouse and human data and prepared the figures; M.F.E. analyzed the UMCG human data and prepared the tables; M.R.H. drafted the UCLA portion of the manuscript; M.F.E. drafted the UMCG portion of the manuscript; M.R.H., M.F.E., M.A.d.J., M.H.d.B., S.J.L.B., E.N., I.B.S., C.A.J.M.G. and T.G. reviewed and revised the manuscript; all authors approved the final version of the manuscript.
CONFLICT OF INTEREST STATEMENT
None declared.
REFERENCES
Author notes
Isidro B. Salusky, Carlo A.J.M. Gaillard and Tomas Ganz are co-senior authors.
Mark R. Hanudel and Michele F. Eisenga contributed equally to this work.


Comments