


Abstract
Patients with chronic kidney disease (CKD) have higher levels of coronary artery calcification (CAC) compared with the general population. The role of CAC in renal function decline is not well understood.
In this prospective cohort study of Stages 3–5 CKD patients with CAC scores kidney function decline, development of end-stage kidney disease (ESKD) and all-cause mortality were determined at 5 and 10 years. Baseline variables included markers of CKD and chronic kidney disease mineral and bone disorder (CKD-MBD), demographics and comorbidities. Multivariable analyses identified predictors of outcomes, and survival curves demonstrated the association of CAC score with ESKD and mortality.
One hundred and seventy-eight patients were enrolled between 2005 and 2007. Independent predictors of ESKD at 5 years were estimated glomerular filtration rate (eGFR) and urine albumin–creatinine ratio (UACR); at 10 years, eGFR was no longer a predictor, but CAC was now significant. Those who developed ESKD at the fastest rate either had the highest CAC score (≥400 AU) or were youngest and had the lowest calcidiol, and highest serum phosphate, UACR and percentage change in CAC per year. Predictors of eGFR decline over 5 years were UACR, parathyroid hormone and CAC score. Predictors of mortality at 5 years were age, diabetes and eGFR and at 10 years also included CAC score.
In Stages 3–5 CKD patients, CAC is an independent predictor of both ESKD and mortality at 10 years. Those who developed ESKD at the fastest rate either had the highest CAC score or the worst CKD-MBD derangements.
ADDITIONAL CONTENT
An author video to accompany this article is available at: https://dbpia.nl.go.kr/ndt/pages/author_videos.
INTRODUCTION
Cardiovascular disease (CVD) is one of the leading causes of mortality amongst patients with chronic kidney disease (CKD) [1]. An elevated rate of CVD-related death in CKD patients is due in part to coronary artery calcification (CAC), which is linked to abnormal calcium and phosphate homeostasis [chronic kidney disease-mineral bone disorder (CKD-MBD)] in addition to the high prevalence of traditional Framingham risk factors [2, 3].
Patients with CKD have higher prevalence and severity of CAC compared with age and sex-matched controls [4, 5]. In a study by Roy et al., patients with mild and moderate CKD were 2.2 and 6.4 times more likely to have CAC, respectively, than those with a normal estimated glomerular filtration rate (eGFR) [6]. In the Dallas Heart study, those with CKD Stages 1–2 and 3–5 had a 2- and 9-fold increased risk of having severe calcification, respectively, when compared with those without CKD [7]. Important predictors of CAC severity in the nondialysis CKD population include diabetes and gender whilst kidney function itself has not been found to be consistently associated [4, 7–11]. Predictors of CAC progression include baseline CAC score, lower eGFR, higher serum phosphate levels and traditional cardiovascular risk factors [9] including male gender and diabetes [10].
Elevated CAC score is an independent risk factor for mortality in both the general population [2, 12, 13] and in patients with CKD or end-stage kidney disease (ESKD) [14, 15]. CAC is more frequently observed and more extensive in those with atherosclerotic causes of kidney disease compared with those with nonatherosclerotic causes [16]. It is therefore conceivable that progression of calcification within the vasculature, including the renal arteries, could be part of the causal pathway toward progression to ESKD in some CKD patients. With the increasing burden of CKD within the population, there is significant public health interest in identifying predictors of declining kidney function, particularly those who are at highest risk of requiring dialysis and identifying which targets would provide maximal risk reduction.
We previously determined in a cohort of Stages 3–5 CKD patients that CAC score was a risk factor for kidney function decline at 1 year of follow-up [17]. Whether calcification burden, assessed by CAC score, is associated with long-term progression of CKD to ESKD is unknown. Therefore, we have extended the follow-up period in this cohort to 5 and 10 years to determine the association of CAC with kidney function decline, ESKD and all-cause mortality.
MATERIALS AND METHODS
Between June 2005 and March 2007, 178 Caucasian patients presenting for follow-up at the Kingston General Hospital (KGH) CKD clinics were enrolled in studies addressing risk factors for CAC in patients without a history of CVD [8] or association of CAC with Vitamins K and D status [18]. Criteria for enrollment included age of at least 18 years, dialysis-naïve CKD Stages 3–5 as per the National Kidney Foundation guidelines [19], and no history of warfarin use. All participants enrolled gave informed consent. The study was approved by Queen’s University Health Sciences and Affiliated Teaching Hospitals Research Ethics Board.
Clinical data were collected via patient history and chart review: age, gender, diabetes (Canadian Diabetes Guidelines [20]), hyperlipidemia (Canadian Cardiovascular guidelines laboratory diagnoses or by current use of lipid-lowering agents [21]), CVD (symptoms of angina or heart failure, or history of cardiovascular events), peripheral vascular disease (PVD, history of transient ischemic attack, vascular claudication, cerebral vascular accidents), hypertension (Canadian Hypertension Education Program guidelines [22]), smoking (at least one cigarette a day over the preceding 6 months), use of calcitriol, a calcium-based binder or vitamin D, and dietary intake of calcium or phosphate.
Baseline laboratory values were either averaged over the preceding 6 months or obtained as single measurements. All analyses were completed at the KGH laboratory to eliminate interlaboratory variability. Averaged values included serum phosphate, serum calcium corrected for albumin, parathyroid hormone (PTH), alkaline phosphatase and C-reactive protein (CRP). Onetime measurements included serum calcium-phosphate product (Ca/P product), percent under-γ-carboxylated osteocalcin (%ucOC), osteoprotegerin (OPG), calcidiol, uric acid, magnesium, random urine albumin–creatinine ratio (UACR) and serum creatinine (sCr, Roche Creatinine Plus Modular assay). Body mass index (BMI) was calculated using height and weight on the date of study enrollment. eGFR was calculated following the 4-variable Modification of Diet in Renal Disease study equation [23, 24].
Coronary artery calcification
CAC was measured on enrollment in all participants, with repeat scans in 2009 in a subset of patients (n = 94). CAC was measured using the Toshiba Aquillion (Nasu, Japan) computed tomographic multislice scanner (four sets of detectors) with the following parameters: four slices of scan thickness 3 mm each, simultaneously collected over a 12 mm rotation; field coverage 12 cm. Scans were analyzed using the VScore software (Vital Images Inc., Minnetonka, MN, USA) and images acquired using a prospective gating technique [25]. Total CAC score was determined using the Agatston method [26]. Where appropriate, CAC score was categorized as no CAC (0), minimal (1–9), mild (10–99), moderate (100–399) or severe (≥400).
Outcome assessments
Outcomes were assessed by electronic chart review. All-cause mortality and development of ESKD, defined by the initiation of dialysis or receipt of a kidney transplant, were determined at 5 and 10 years. Renal function at 5 years was determined by eGFR using the lowest recorded sCr within 3 months of the 5-year time point. Progression in CAC was assessed by percentage change in CAC per year, either as a continuous variable or stratified into those with at least 15% progression versus those with <15% [27].
Statistical analysis
Baseline variables were expressed as mean with standard deviation for continuous variables, count with percentage for categorical variables and median with interquartile range (IQR) for nonnormally distributed variables. Prior to analysis, PTH, UACR and CAC were logarithmically transformed to ensure normality, with 1.0 added to CAC score prior to transformation since the values of zero could otherwise not be log-transformed. Baseline variables were compared between stages of CKD and categories of CAC using chi-squared, analysis of variance or Kruskal–Wallis test where appropriate. Bivariate analysis of the variables with the outcomes, as assessed by chi-squared, Fisher’s exact test, Student’s t-test or Mann–Whitney test, identified significant associations as defined by P ≤ 0.05. Variables with significant associations at both time points were included in the multivariable analyses for the outcomes, which included a series of linear and logistic regressions. The variables with significant association for ESKD were used in the multivariable analysis of percentage eGFR decline at 5 years. Unadjusted Kaplan–Meier curves were constructed for survival and time to ESKD stratified by CAC categories.
RESULTS
Baseline characteristics
Of the 178 Caucasian patients initially enrolled, 10 and 18 were lost to follow-up at 5 and 10 years, respectively. Table 1 outlines the characteristics of the participants categorized by the stage of CKD. The mean age was 61 (±14) years ranging from 22 to 85 years, with almost half (46%) over 65 years. They had a mean eGFR of 26 (±12) mL/min/1.73 m2 and median CAC score of 217 AU (IQR 9–746). They were predominantly male (62%), almost half had diabetes (44%) and most were hypertensive (93%). Fifty-three (30%) had Stage 3 CKD, 90 (51%) had Stage 4 CKD and 35 (20%) had Stage 5 CKD. Use of calcium-based binders, calcitriol and history of CVD, sex, baseline eGFR, alkaline phosphatase, phosphate, calcium, total Ca/P product, calcidiol, uric acid, OPG, %ucOC, UACR and PTH differed significantly between stages of CKD but CAC score did not (P = 0.92).
Baseline characteristics of study participants by CKD stage
| CKD Stage | ||||||
|---|---|---|---|---|---|---|
| n | All (n = 178) | Stage 3 (n = 53) | Stage 4 (n = 90) | Stage 5 (n = 35) | P-value | |
| Categorical, N (%) | ||||||
| Diabetes | 178 | 79 (44) | 19 (36) | 43 (48) | 17 (49) | 0.33 |
| CVD history | 178 | 32 (18) | 2 (4) | 21 (23) | 9 (26) | 0.005 |
| PVD history | 178 | 22 (12) | 4 (8) | 11 (12) | 7 (20) | 0.22 |
| Male | 178 | 110 (62) | 40 (76) | 53 (59) | 17 (49) | 0.029 |
| Hypertension | 178 | 165 (93) | 50 (94) | 83 (92) | 32 (91) | 0.85 |
| Hyperlipidemia | 176 | 148 (84) | 42 (81) | 78 (88) | 28 (80) | 0.43 |
| Statin | 178 | 96 (54) | 30 (57) | 51 (57) | 15 (43) | 0.34 |
| Smoking | 178 | 110 (62) | 30 (57) | 54 (60) | 26 (74) | 0.22 |
| Calcitriol intake | 178 | 16 (9) | 1 (2) | 5 (6) | 10 (29) | <0.001 |
| Calcium-based binders | 178 | 41 (23) | 6 (11) | 16 (18) | 19 (54) | <0.001 |
| Continuous, mean ± SD | ||||||
| Age | 178 | 61 ± 14 | 61 ± 13 | 61 ± 14 | 63 ± 14 | 0.64 |
| eGFR (mL/min/1.73 m2) | 178 | 26 ± 12 | 40 ± 7 | 23 ± 5 | 11 ± 3 | <0.001 |
| BMI (kg/m2) | 178 | 31 ± 8 | 32 ± 8 | 32 ± 8 | 30 ± 7 | 0.45 |
| AlkPhos (U/L) | 176 | 86 ± 32 | 81 ± 28 | 84 ± 30 | 99 ± 38 | 0.019 |
| Phosphate (mmol/L) | 178 | 1.3 ± 0.3 | 1.1 ± 0.2 | 1.3 ± 0.2 | 1.7 ± 0.4 | <0.001 |
| Calcium (mmol/L) | 176 | 2.3 ± 0.2 | 2.4 ± 0.2 | 2.4 ± 0.2 | 2.3 ± 0.2 | 0.002 |
| Ca/P product (mmol2/L2) | 176 | 3.1 ± 0.7 | 2.7 ± 0.5 | 3.1 ± 0.6 | 3.7 ± 1 | <0.001 |
| Calcidiol (nmol/L) | 164 | 68 ± 27 | 77 ± 30 | 66 ± 24 | 59 ± 25 | 0.01 |
| Uric acid (umol/L) | 97 | 517 ± 133 | 466 ± 105 | 545 ± 131 | 509 ± 161 | 0.042 |
| Magnesium (mmol/L) | 166 | 0.86 ± 0.14 | 0.88 ± 0.18 | 0.85 ± 0.12 | 0.87 ± 0.14 | 0.42 |
| OPG (pg/mL) | 102 | 3219 ± 1731 | 2537 ± 1012 | 3151 ± 1694 | 4213 ± 2093 | 0.004 |
| %ucOC | 164 | 27 ± 22 | 16 ± 19 | 32 ± 22 | 30 ± 23 | <0.001 |
| Vitamin D (IU) | 173 | 377 ± 350 | 358 ± 281 | 389 ± 357 | 375 ± 427 | 0.89 |
| Diet phosphate (mg) | 171 | 1277 ± 451 | 1362 ± 436 | 1280 ± 466 | 1133 ± 408 | 0.078 |
| Diet calcium (mg) | 173 | 1013 ± 598 | 984 ± 530 | 975 ± 570 | 1159 ± 750 | 0.29 |
| Nonnormally distributed, median (IQR) | ||||||
| UACR (mg/mmol) | 173 | 38 (6–110) | 13 (2–43) | 54 (13–143) | 81 (16–176) | <0.001 |
| CRP (mg/mL) | 169 | 3.6 (1.4–6.8) | 2.5 (1.4–4.9) | 3.9 (1.4–7.3) | 4.6 (1.4–12) | 0.17 |
| PTH (pmol/L) | 178 | 9 (5–17) | 6 (4–8) | 12 (6–21) | 16 (10–34) | <0.001 |
| CAC (AU) | 178 | 217 (9–746) | 182 (14–891) | 183 (9–659) | 264 (3–828) | 0.92 |
AlkPhos, alkaline phosphatase.
End-stage kidney disease
The rate of ESKD in survivors was 33% (n = 58) and 50% (n = 89) at 5 and 10 years, respectively. In the unadjusted model, use of calcitriol and calcium-based binders, and baseline eGFR, UACR, PTH, phosphate, calcium, Ca/P product, OPG, CRP, %ucOC and calcidiol were significantly associated with ESKD at 5 years. At 10 years, calcitriol, calcium-based binders and CRP were no longer significant but associations now included diabetes and uric acid. Baseline CAC score was not significant at either time point but percentage change in CAC per year was significant at 5 years (P < 0.001, Supplementary data, Table S1). To simplify the adjusted model, only Ca/P product was included to represent the significant associations of phosphate, calcium and Ca/P product. In the adjusted model, independent predictors of ESKD at 5 years were UACR and eGFR (Table 2). At 10 years, eGFR was no longer significant but increasing CAC score was now an independent predictor with odds ratio (OR) 2.3 [95% confidence interval (95% CI) 1.07–4.93].
Predictors of ESKD at 5 and 10 years by logistic regression
| 5 years | 10 years | |||
|---|---|---|---|---|
| OR (95% CI) | P-value | OR (95% CI) | P-value | |
| eGFR | 0.85 (0.74–0.98) | 0.024 | 0.99 (0.9–1.09) | 0.88 |
| OPG | 1 (1–1) | 0.073 | 1 (1–1) | 0.82 |
| Ca/P product | 0.63 (0.17–2.34) | 0.49 | 2.03 (0.57–7.28) | 0.28 |
| Calcidiol | 0.98 (0.95–1.01) | 0.12 | 0.99 (0.96–1.02) | 0.37 |
| PTHa | 6.45 (0.48–86.44) | 0.16 | 2.28 (0.09–57.39) | 0.62 |
| %ucOC | 1.04 (0.99–1.09) | 0.1 | 1.03 (0.99–1.08) | 0.2 |
| UACRa | 4.54 (1.46–14.18) | 0.009 | 3.03 (1.23–7.47) | 0.016 |
| CACa | 0.65 (0.28–1.5) | 0.31 | 2.3 (1.07–4.93) | 0.032 |
Prior to analysis, PTH, UACR and CAC were logarithmically transformed to ensure normality, with 1.0 added to CAC score prior to transformation.
Characteristics of participants stratified by CAC
| CAC category | |||||||
|---|---|---|---|---|---|---|---|
| Total | 0 | 1–9 | 10–99 | 100–399 | 400+ | P-value | |
| (n = 178) | (n = 21) | (n = 25) | (n = 31) | (n = 35) | (n = 66) | ||
| Diabetes | 79 (44) | 3 (14) | 9 (36) | 11 (36) | 18 (51) | 38 (58) | 0.005 |
| CVD history | 32 (18) | 0 (0) | 4 (16) | 7 (23) | 5 (14) | 16 (24) | 0.13 |
| PVD history | 22 (12) | 1 (5) | 0 (0) | 4 (13) | 6 (17) | 11 (17) | 0.16 |
| Male | 110 (62) | 13 (62) | 14 (56) | 17 (55) | 23 (66) | 43 (65) | 0.82 |
| Hypertension | 165 (93) | 18 (86) | 23 (92) | 29 (94) | 34 (97) | 61 (92) | 0.63 |
| Hyperlipidemia | 148 (84) | 14 (67) | 23 (92) | 22 (76) | 33 (94) | 56 (85) | 0.038 |
| Statin | 96 (54) | 6 (29) | 8 (32) | 15 (48) | 24 (69) | 43 (65) | 0.002 |
| Smoking | 110 (62) | 8 (39) | 16 (64) | 18 (58) | 19 (54) | 49 (74) | 0.034 |
| Calcitriol | 16 (9) | 2 (10) | 2 (8) | 2 (7) | 5 (14) | 5 (8) | 0.8 |
| Calcium-based binders | 41 (23) | 2 (10) | 6 (24) | 7 (23) | 9 (26) | 17 (26) | 0.63 |
| Age (years) | 61 ± 14 | 52 ± 15 | 50 ± 16 | 61 ± 12 | 63 ± 12 | 68 ± 10 | <0.001 |
| eGFR (mL/min/1.73 m2) | 26 ± 12 | 26 ± 11 | 23 ± 11 | 29 ± 11 | 25 ± 13 | 25 ± 12 | 0.42 |
| BMI (kg/m2) | 31 ± 8 | 27 ± 7 | 32 ± 6 | 32 ± 8 | 33 ± 7 | 32 ± 8 | 0.057 |
| Alk Phos (U/L) | 86 ± 32 | 80 ± 22 | 102 ± 45 | 88 ± 29 | 83 ± 29 | 83 ± 29 | 0.07 |
| Phosphate (mmol/L) | 1.3 ± 0.3 | 1.3 ± 0.3 | 1.5 ± 0.4 | 1.2 ± 0.3 | 1.3 ± 0.3 | 1.4 ± 0.3 | 0.016 |
| Calcium (mmol/L) | 2.3 ± 0.2 | 2.3 ± 0.2 | 2.3 ± 0.2 | 2.4 ± 0.2 | 2.3 ± 0.2 | 2.4 ± 0.2 | 0.29 |
| Ca/P product (mmol2/L2) | 3.1 ± 0.7 | 3 ± 0.7 | 3.3 ± 1 | 2.8 ± 0.5 | 3.1 ± 0.7 | 3.2 ± 0.7 | 0.13 |
| Calcidiol (nmol/L) | 68 ± 27 | 74 ± 27 | 56 ± 21 | 82 ± 29 | 71 ± 29 | 62 ± 23 | 0.002 |
| Uric acid (umol/L) | 517 ± 133 | 473 ± 108 | 503 ± 149 | 495 ± 147 | 486 ± 114 | 559 ± 133 | 0.15 |
| Magnesium (mmol/L) | 0.86 ± 0.14 | 0.85 ± 0.1 | 0.83 ± 0.12 | 0.83 ± 0.11 | 0.89 ± 0.2 | 0.87 ± 0.12 | 0.37 |
| OPG (pg/mL) | 3219 ± 1731 | 2431 ± 2125 | 3011 ± 2297 | 3311 ± 1786 | 3259 ± 1414 | 3472 ± 1500 | 0.47 |
| % ucOC | 27 ± 22 | 23 ± 23 | 29 ± 23 | 29 ± 23 | 25 ± 19 | 28 ± 24 | 0.89 |
| Vitamin D (IU) | 377 ± 350 | 367 ± 409 | 360 ± 439 | 502 ± 346 | 445 ± 389 | 297 ± 247 | 0.077 |
| Diet phosphate (mg) | 1277 ± 451 | 1230 ± 358 | 1355 ± 484 | 1371 ± 503 | 1315 ± 437 | 1202 ± 446 | 0.38 |
| Diet calcium (mg) | 1013 ± 598 | 978 ± 640 | 1215 ± 779 | 1157 ± 552 | 1013 ± 605 | 879 ± 495 | 0.092 |
| Percentage change in CAC/year | 75 ± 209 | 123 ± 311 | 261 ± 425 | 66 ± 110 | 28 ± 21 | 10 ± 17 | 0.006 |
| UACR (mg/mmol) | 38 (6–110) | 27 (3–58) | 100 (40–204) | 20 (3–72) | 30 (6–81) | 39 (4–162) | 0.024 |
| CRP (mg/mL) | 3.6 (1.4–6.8) | 1.9 (1–4.6) | 5.2 (3.1–7.4) | 3.3 (1.2–7) | 4 (1.3–6.9) | 3.9 (1.5–7.3) | 0.26 |
| PTH (pmol/L) | 9 (5–17) | 7 (5–19) | 11 (5–24) | 8 (5–13) | 10 (6–21) | 9 (5–16) | 0.68 |
Variables represented as n (%), mean (±SD) or median (IQR).
In the unadjusted survival model stratifying patients based on categories of CAC, participants with lower CAC score generally had a longer time to ESKD just below the level of significance (P = 0.078). Although this general trend held true for most participants, the 25 patients with minimal CAC (1–9) had the highest rate of ESKD (Figure 1). These patients with minimal CAC were the youngest but had the highest CKD-MBD-related parameters including alkaline phosphatase, phosphate, Ca/P product, PTH and UACR, and the lowest eGFR, and calcidiol compared with the other CAC categories, although only age, phosphate, calcidiol, UACR, diabetes, hyperlipidemia, statin use and smoking were statistically significant between categories of CAC (Table 3). Additionally, this cohort showed the most significant CAC progression with the highest percentage change in CAC per year (P = 0.006).
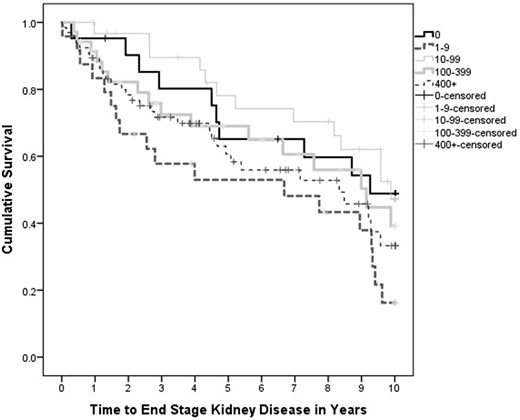
Unadjusted survival curve for time to ESKD stratified by CAC category. Time to ESKD stratified by CAC score is not significant, P = 0.078. CAC score does not differ significantly between stages of CKD (P = 0.92).
Predictors of percentage decline in eGFR at 5 years by linear regression
| Individual predictors | 95% CI | ||||
|---|---|---|---|---|---|
| B | β | P-value | Lower bound | Upper bound | |
| eGFR | 0.6 | 0.21 | 0.29 | −0.6 | 1.8 |
| OPG | 0.001 | 0.061 | 0.72 | −0.006 | 0.008 |
| Ca/P product | −3.5 | −0.07 | 0.67 | −20 | 13.1 |
| Calcidiol | 0.1 | 0.17 | 0.47 | −0.2 | 0.5 |
| PTHa | 41.0 | 0.44 | 0.02 | 7 | 76.6 |
| %ucOC | −0.1 | −0.10 | 0.57 | −0.6 | 0.4 |
| UACRa | 14 | 0.4 | 0.008 | 3.8 | 23.4 |
| CACa | 9.9 | 0.4 | 0.024 | 1.4 | 18.4 |
| Constant | −70.8 | ||||
Prior to analysis, PTH, UACR and CAC were logarithmically transformed to ensure normality, with 1.0 added to CAC score prior to transformation.
Kidney function decline
At 5 years, 71 participants who had not developed ESKD had a mean percentage decline in eGFR of 15% (±33%). Of these, 41 had baseline values for all included variables and were included in the multivariable analysis. Increasing PTH, UACR and CAC score were independent predictors of eGFR decline at 5 years (Table 4).
Mortality
The mortality rate was 15% (n = 27) and 30% (n = 54) at 5 and 10 years, respectively. In the unadjusted model, predictors of mortality at 5 years included age, eGFR, PTH, CAC score, CRP, diabetes and use of calcium-based binders. At 10 years, PTH, CRP and calcium-based binders were no longer significant, but significant associations now also included PVD, CVD, smoking, calcidiol and uric acid (Supplementary data, Table S1). In the adjusted model, independent predictors of mortality at 5 and 10 years were age, diabetes and baseline GFR (Table 5). Although the association of CAC score with mortality was significant at 5 and 10 years in the unadjusted model (Supplementary data, Table S1), it was only significant at 10 years in the adjusted model with OR of 2.05 (95% CI 1.24–3.39) (Table 5). In the unadjusted survival curves, there was a strong relationship between higher CAC and worse survival, with the worst survival observed in participants with severe CAC (P < 0.001, Figure 2).
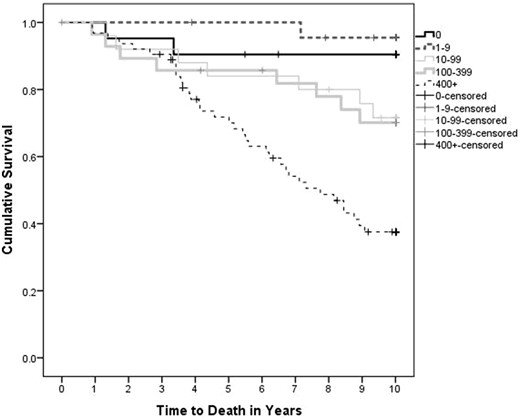
Unadjusted all-cause mortality curves stratified by CAC category. Survival stratified by CAC score is significant, P < 0.001. CAC score does not differ significantly between stages of CKD (P = 0.92).
Predictors of all-cause mortality at 5 and 10 years by logistic regression
| 5 years | 10 years | |||
|---|---|---|---|---|
| OR (95% CI) | P-value | OR (95% CI) | P-value | |
| Age | 1.08 (1.03–1.14) | 0.004 | 1.11 (1.05–1.17) | <0.001 |
| eGFR | 0.94 (0.89–0.98) | 0.01 | 0.93 (0.89–0.97) | 0.001 |
| Diabetes | 2.96 (1.09–8.04) | 0.033 | 5.27 (1.98–14.02) | 0.001 |
| CACa | 1.5 (0.9–2.51) | 0.12 | 2.05 (1.24–3.39) | 0.005 |
Prior to analysis CAC score was logarithmically transformed to ensure normality, with 1.0 added prior to transformation.
Progression of calcification
Of the initial 178 participants, 94 had a follow-up computed tomography scan to assess CAC score with mean follow-up of 36.5 (±5.8) months. Initial univariate analysis to identify variables associated with at least a 15% progression per year revealed significant associations with eGFR, BMI, alkaline phosphatase, phosphate, %ucOC, CRP and UACR (Supplementary data, Table S2). Subsequent multivariate analysis with percentage change in CAC per year identified UACR and %ucOC as independent predictors but not baseline CAC (P = 0.11) (Table 6).
Predictors of percentage change in CAC per year
| Individual predictors | 95% CI | ||||
|---|---|---|---|---|---|
| B | β | P-value | Lower bound | Upper bound | |
| eGFR | 0.5 | 0.03 | 0.84 | −4.5 | 5.6 |
| BMI | −3.8 | −0.13 | 0.26 | −10.5 | 2.9 |
| UACRa | 69.2 | 0.27 | 0.014 | 14.5 | 124 |
| AlkPhos | 1 | 0.15 | 0.15 | −0.4 | 2.4 |
| Phosphate | 109.9 | 0.15 | 0.22 | −69 | 288.8 |
| %ucOC | 2.7 | 0.26 | 0.025 | 0.4 | 5 |
| CRPa | 64.6 | 0.14 | 0.19 | −32.1 | 161.3 |
| CACa | −31.4 | −0.17 | 0.11 | −69.6 | 6.9 |
| Constant | −167.6 | ||||
Prior to analysis, UACR, CRP and CAC were logarithmically transformed to ensure normality, with 1.0 added to CAC score prior to transformation.
DISCUSSION
The primary objective of this study was to assess the relationship between CAC score and kidney function decline, development of ESKD and all-cause mortality at 5 and 10 years in patients with Stages 3–5 CKD. Our results support those of previous studies that have shown that increased CAC scores are independent risk factors for all-cause mortality in patients with CKD or ESKD [14, 15, 28]. To our knowledge, no study has looked at the association between CAC severity and long-term kidney function decline and development of ESKD, aside from our previous study looking at kidney function decline at 1 year [17]. Overall, we report that CAC is associated with kidney function decline, development of ESKD and all-cause mortality in patients with Stages 3–5 CKD.
CAC score was an independent predictor of eGFR decline at 5 years and development of ESKD at 10 years. When broken into categories, higher degrees of calcification were generally associated with progression to ESKD in the unadjusted survival analysis, aside from those with minimal calcification (1–9) who had accelerated development of ESKD surpassing those with severe calcification. Analysis of this subgroup identified a cohort that was younger with a higher burden of traditional risk factors for kidney disease including lowest eGFR and highest UACR, as well as advanced CKD-MBD including highest alkaline phosphatase, phosphate and Ca/P product and lowest calcidiol, and highest degree of percentage change in CAC per year. Of these parameters, only age, calcidiol, phosphate and UACR and percentage change in CAC reached significance between categories of CAC. The reason for the higher rates of ESKD in this subgroup is likely multifactorial with contribution from traditional CKD parameters (UACR and eGFR) as well as younger age and longer survival, and more advanced CKD-MBD, and potentially due in part to CAC progression. In our study population, biomarkers of CKD-MBD and other bone-related biomarkers (OPG, %ucOC) were independent predictors of ESKD in the unadjusted model at both 5 and 10 years.
In this study CAC severity was not associated with eGFR or stage of CKD, consistent with other studies [5, 9, 16, 29, 30] including our own [8]. This is in contrast to other studies that demonstrate a linear increase in CAC severity with worsening renal function [4, 7, 11]. This discrepancy may relate to the fact that CAC is multifactorial in etiology, is a composite of medial and intimal calcification and is not a static variable. In addition to eGFR, degree of CAC could be linked to other markers of kidney function decline such as UACR or CKD-MDB, or to factors linked to CAC such as diabetes [7, 31] and statin use [32], both of which had increasing prevalence with increasing CAC severity in our population. Furthermore, the bias of sampling at a single time point is demonstrated by our cohort of patients with minimal CAC who had the highest degree of CAC progression on reassessment highlighting the potential utility of repeat CAC measurements if CAC is to be used in risk assessment.
Vascular calcification is strongly associated with CKD-MBD [33, 34]. Whilst calcification occurs widely throughout the vasculature, it has been most commonly quantified within the coronary arteries due to its link with CVD and mortality. CKD-MBD is a known consequence of CKD and markers of CKD-MBD have been shown to be important in CAC severity and progression in both CKD and ESKD patients. Controlling for eGFR, age and presence of diabetes, we have previously identified serum calcium and BMI as risk factors for CAC [8]. In univariate analysis, parameters of CKD and CKD-MBD were significant predictors of CAC progression including eGFR, UACR, alkaline phosphatase and phosphate. However, in the multivariate analysis only UACR and %ucOC, a biomarker that reflects bone vitamin K status in healthy people, was significantly associated with increased CAC progression. In predominantly Stage 1 CKD patients, CAC progression over 6 years was associated with baseline CAC score, lower eGFR, higher phosphate and presence of traditional CVD risk factors [9]. In Stages 3–5 CKD patients, serum phosphate was the sole predictor of CAC progression [35]. Taken together, our findings in combination with those from other studies highlight the role of both advanced kidney disease, as seen by either low eGFR or significant albuminuria, and CKD-MBD derangements in CAC progression. These findings highlight CKD-MBD and its drivers as potentially modifiable targets in preventing CAC progression.
If we consider CAC as a surrogate marker for systemic vascular calcification, then those with increased CAC would reasonably be expected to have increased calcification within the aorta and the renal vasculature. The presence of renal artery calcification was first reported in 1979 by Ibels et al. who compared the renal arteries of hemodialysis patients undergoing renal transplantation with age-matched controls without CKD [36]. The transplant recipients not unexpectedly had significantly greater intimal and medial thickness and calcification burden. Studies have investigated the consequences of CAC on cardiovascular function, such as arterial wall stiffening, left ventricular hypertrophy, heart failure and valvular calcification, all of which directly affect CVD progression and may be implicated in the development of Type 2 cardio-renal syndrome [29, 37, 38]. In line with this, decreased renal perfusion due to cardiac dysfunction from calcification or altered renal hemodynamics related to aortic stiffness could lead to overall accelerated renal function decline. Additionally, it must be considered that the relationship between CKD and CAC is likely bi-directional, with worsening kidney function and subsequent CKD-MBD promoting calcification. It is noteworthy that treatment with non-calcium-based phosphate binders has been shown to attenuate the progression of CAC in CKD patients [39]. The impact of stricter control of phosphate, and possibly other CKD-MBD parameters, on important outcomes such as kidney function decline or ESKD development thus requires further investigation and could have important management implications.
In this study, both kidney function and CAC score were important predictors of all-cause mortality: in the adjusted model, eGFR was a predictor of mortality at 5 and 10 years, and CAC score was a predictor at 10 years. Furthermore, in the unadjusted survival analysis, higher CAC scores were associated with worse survival. Over a median follow-up period of 79 months, Hwang et al. also found a positive association between CAC score and mortality in Stages 3–5 CKD patients; however, in their study, the increased risk required the association of increased CRP [14]. In our cohort, CRP was only significantly associated with mortality in the unadjusted model at 5 years suggesting that the increased risk within our cohort was not as strongly dependent on systemic inflammation although it was not included in the adjusted model. Additional predictors of mortality in our study were age and presence of diabetes. Although 32 (18%) participants had a history of CVD, this was not identified as an independent predictor of mortality. A possible reason for this was a skew in our participant population toward individuals without a history of CVD as initially studied by Garland et al. [8].
To our knowledge, this is the first study to assess the association of CAC with kidney function decline and development of ESKD over a 5- to 10-year period. However, our study does have some limitations to consider. First, only about half of our participants had follow-up CAC scans, which limited our ability to include this variable in our multivariate analyses. Preliminary findings presented here, particularly in the cohort with minimal calcification that had the highest percentage of CAC progression, may highlight a link between CAC progression and development of ESKD. This could be important in identifying a role for repeat CAC measurements in ESKD risk stratification; a larger cohort assessing this relationship is required. Second, we used the Agatston score to assess CAC although this may be more variable and less reliable than the volumetric method of assessing calcification. Lastly, our study demographic was limited to the Caucasian population. It has been demonstrated that the Caucasian population has at least equal amounts of CAC in comparison with African-American, Chinese-American or Hispanic populations [10].
Overall, we found that CAC score is associated with accelerated kidney function decline, shorter time to ESKD and increased all-cause mortality in Stages 3–5 CKD patients. Given the previously demonstrated link between lower eGFR and CKD-MBD derangements, the associations between CKD-MBD parameters with CAC severity and progression and our demonstrated association of CAC score with rate of ESKD development and mortality, it then reasons that more aggressive management targeted at drivers of vascular calcification within this population could provide therapeutic options in preventing progression of CKD and ESKD, and may offer some risk reduction to all-cause mortality.
ACKNOWLEDGEMENTS
The authors would like to thank Laura Couture for her help with some of the writing.
FUNDING
The work was supported by the Kidney Foundation of Canada and the Department of Medicine, Queen’s University.
AUTHORS’ CONTRIBUTIONS
J.S.G. and R.M.H. collected baseline data. M.C.L. collected the follow-up data. M.C.L. and R.M.H. completed the analyses, interpretation and wrote the paper. W.M.H. completed the statistical analyses and assisted with interpretation. All authors reviewed and edited the final draft.
CONFLICT OF INTEREST STATEMENT
This paper has not been published previously in whole or part, except in abstract format. Preliminary data was presented as a poster at the 2016 Canadian Society of Nephrology Conference.
REFERENCES
K/DOQI Clinical Practice Guidelines for Chronic Kidney Disease: Evaluation, classification, and stratification.


Comments