


ABSTRACT
Compared with conventional haemodialysis (HD), online haemodiafiltration (OL-HDF) achieves a more efficient removal of uraemic toxins and reduces inflammation, which could favourably affect nutritional status. We evaluate the effect of OL-HDF on body composition and nutritional status in prevalent high-flux HD (HF-HD) patients.
In all, 33 adults with chronic kidney disease (CKD) Stage 5 undergoing maintenance HF-HD were assigned to post-dilution OL-HDF (n = 17) or to remain on HF-HD (n = 16, control group) for 12 months. The primary outcome was the change in lean tissue mass (LTM), intracellular water (ICW) and body cell mass (BCM) assessed by multifrequency bioimpedance spectroscopy (BIS) at baseline and 4, 8 and 12 months. The rate of change in these parameters was estimated with linear mixed-effects models.
Compared with OL-HDF, patients assigned to HF-HD experienced a gradual reduction in LTM, ICW and BCM. These differences reached statistical significance at Month 12, with a relative difference of 7.31 kg [95% confidence interval (CI) 2.50–12.11; P = 0.003], 2.32 L (95% CI 0.63–4.01; P = 0.008) and 5.20 kg (95% CI 1.74–8.66; P = 0.004) for LTM, ICW and BCM, respectively. The normalized protein appearance increased in the OL-HDF group compared with the HF-HD group [0.26 g/kg/day (95% CI 0.05–0.47); P = 0.002], with a relative reduction in high-sensitive C-reactive protein [−13.31 mg/dL (95% CI −24.63 to −1.98); P = 0.02] at Month 12.
OL-HDF for 1 year compared with HF-HD preserved muscle mass, increased protein intake and reduced the inflammatory state related to uraemia and dialysis, supporting the hypothesis that high convection volume can benefit nutritional status and prevent protein-energy wasting in HD patients.
INTRODUCTION
Although maintenance haemodialysis (HD) undoubtedly prolongs life in patients with end-stage renal disease (ESRD), patient morbidity and mortality remain unacceptably high [1]. Protein-energy wasting (PEW, e.g. progressive losses of muscle and fat stores) and inadequate dialysis have been postulated as important modifiable risk factors that could explain the high mortality risk of these patients [2, 3]. More intensive HD treatments to conventional HD thrice weekly, such as short daily and nocturnal HD, have been shown to improve some nutritional parameters [4–7], which may lead to better survival [8–11].
Post-dilution online haemodiafiltration (OL-HDF) is considered the most efficient renal replacement treatment modality and its use is steadily increasing in regions such as Europe and Japan [12]. Compared with conventional HD, OL-HDF enables better removal of middle molecular weight uraemic toxins by combining convective and diffusive clearance [13]. Although higher convection volume exchange has been associated with an increased survival advantage for dialysis patients, the mechanisms by which OL-HDF improves outcomes remain unknown [14].
On the basis of improved toxin removal, a potential benefit of OL-HDF on nutritional status has been postulated [15–17]. However, evidence on the effect of OL-HDF on nutritional status is scarce and at times conflicting (18). Some observational and interventional studies have suggested that OL-HDF is associated with improved nutritional parameters [6, 7, 11, 19–22], while others have found no effect [23–29], and one study even reported negative effects of OL-HDF on nutritional status [30]. Many of these observations come from cohort studies, non-controlled interventions and/or secondary analysis of controlled trials. Further, there are currently no data examining the plausible effect of post-dilution OL-HDF on body composition. To clarify this important knowledge gap, we performed a prospective, controlled, quasi-randomized study to evaluate the effects of high-volume post-dilution OL-HDF on body composition and nutritional status in prevalent HD patients.
MATERIALS AND METHODS
Study design and patients
The ProtEin Stores prEservaTion (PESET) study was a 12-month, single-centre, controlled, open-label prospective intervention study that tested the hypothesis that OL-HDF, as compared with high-flux HD (HF-HD), may positively affect nutritional status and body composition in patients with chronic kidney disease (CKD) Stage 5 undergoing maintenance HD. Patients were recruited from the outpatient dialysis unit of Dr Peset University Hospital in Valencia from January to March 2012. Patients were eligible for inclusion if they were ≥18 years of age, had been receiving stable HF-HD treatment for at least 3 months (Kt/Vurea ≥1.2 and HD performed 3.0–6.0 h, three times per week) and gave informed consent. Patients with malabsorption syndrome, active malignant disease or other critical illnesses or those treated with steroids or antiandrogens were excluded. The study was registered with ClinicalTrials.gov (NCT03190629) and was approved by the Dr Peset Hospital Research Ethics Committee (approval no. 63/16). Written informed consent was obtained for all participating patients, in accordance with the Declaration of Helsinki.
Intervention
Patients were assigned to OL-HDF treatment or to remain on HF-HD according to their dialysis schedule: patients that had their HF-HD on a Tuesday/Thursday/Saturday schedule were switched to OL-HDF (treatment group) and patients that had their HF-HD on a Monday/Wednesday/Friday schedule remained on HF-HD (control group).
In both groups, patients received dialysis treatment thrice weekly with the high-flux FX-100 dialyzer (Fresenius Medical Care, Bad Homburg, Germany; membrane: Helixone; surface area: 2.2 m2; ultrafiltration coefficient: 73 mL/h/mmHg), including a minimum target dialysis dose (Kt/Vurea) ≥1.2 and a session length of 3.0–6.0 h. All treatments were performed with the 5008 HD system (Fresenius Medical Care) and ultrapure dialysis fluid containing <0.1 colony-forming units/mL and <0.03 endotoxin units/mL. Patients who were assigned to the treatment group received post-dilution OL-HDF with automatic adjustment of the substitution fluid flow rate [31]. The dialysate flow rate was set to 500 mL/min in both study arms. Patients were regularly followed in the dialysis clinic and routine patient care was performed according to national and international quality of care guidelines. Although general advice was given regarding proper dietary counselling and adequate dietary intake, a dietician did not routinely assess the patients.
Study outcomes
The primary outcome measures were the change from baseline to the end of the study in lean tissue mass (LTM), intracellular water (ICW) and body cell mass (BCM; the metabolically active component of LTM) measured quarterly throughout the 12-month intervention. The secondary outcomes considered changes from baseline in other bioimpedanciometry parameters [fat, adipose tissue mass (ATM), total body water (TBW), extracellular water (ECW), overhydration (OH) and phase angle at 50 kHz] and serum pre-albumin concentration. Additional nutritional status surrogates with monthly or bimonthly measurements were albumin, transferrin, creatinine, total cholesterol, triglyceride, high-sensitivity C-reactive protein (hs-CRP), phosphate and β2-microglobulin, pre- and post-dialysis weight and protein intake assessed by normalized protein appearance (nPNA) [32]. Creatinine index, as a surrogate of lean body mass, was calculated from Kt/V, pre-dialysis creatinine serum levels and anthropometric characteristics according to the simplified formula proposed by Canaud et al. [33]: [16.21 + 1.12 × (1 if male; 0 if female] − 0.06 × age (years) − 0.08 × spKt/V urea + 0.009 × Crpre(μmol/L)].
Data collection
Comorbidity data were collected by chart review and direct patient interview. Changes in body composition were assessed by whole-body bioimpedance spectroscopy (BIS; Fresenius Medical Care) at baseline and 4, 8 and 12 months by experienced research staff blinded to all clinical and biochemical data of the patients [34]. In order to control for potential variability and the effect of OH, all BIS analyses were performed before a mid-week dialysis session. The BIS monitor uses a whole spectrum of low and high frequencies from 5 to 1000 kHz to estimate body composition and fluid status in dialysis patients, including ECW, ICW and TBW [34]. OH is the excess fluid and represents an expansion of only the ECW. As the BIS monitor describes the intracellular and ECW content of LTM and ATM, the expected ‘normal’ volume of ECW of these tissues can be calculated. OH is assessed by subtracting the measured ECW from the expected ‘normal’ volume of ECW of LTM and ATM. Dialysis dose was assessed in each dialysis session by ionic dialysance [35] and every 2 months using the percent reduction in urea (60 Da), phosphate (95 Da), uric acid (168 Da) and β2-microglobulin (11.8 kDa) concentrations from pre- to post-treatment using standard techniques [36]. The pre- to post-treatment reduction ratios for β2-microglobulin were determined after correcting post-dialysis concentrations for the extracellular fluid contraction due to ultrafiltration, using the method of Bergström and Wehle [37]: {uncorrected post-dialysis β2-microglobulin/[1 + (Δbody weight/0.2 post-dialysis weight)]}. Pre-albumin was determined by nephelometry with the IMMAGE800 Immunochemistry System (Beckman Coulter, Galway, Ireland). Handgrip strength was measured using the Baseline Smedley spring-type dynamometer. The measurements were repeated three times on the side opposite to the vascular access and the highest score was recorded in kilograms. Patients underwent subjective global assessment (SGA) [38], and self-reported appetite was assessed by the Appetite and Diet Assessment Tool (ADAT) [39]. Blood pressure (BP) was measured at 30-min intervals throughout the dialysis session. Intradialytic symptomatic hypotension was defined as a decrease in systolic BP ≥20 mmHg associated with clinical events (i.e. dizziness, cramp) and the need for nursing interventions (i.e. administration of a saline bolus, tilting of the bed) [40].
Statistical analyses
Descriptive statistical results are presented as mean ± SD, median and interquartile range (IQR) or as a percentage of all patients as appropriate. Comparison of baseline characteristics between the two treatment arms was assessed using two-sample t-tests or Pearson χ2 for continuous and categorical variables, respectively. Linear mixed-effects models were used for the analysis of the repeated measures data. The changes in the adjusted mean of the outcomes between treatment groups from baseline to each follow-up period were estimated using linear mixed-effects analyses, with covariate adjustment for the baseline level of the outcome, time and treatment as fixed effects and patient as a random term in order to identify the cause of the repeated measurements [41]. The results are presented with a 95% confidence interval (CI).
BIS measurements have an inherent within-patient variation in their assessment. We estimated the within-patient (intra-patient) and between-patient (interpatient) variation of BIS parameters to calculate the percentage change between serial body composition measurements needed to exclude biological (method) variation. The coefficient of variation (CV) was assessed for the differences between BIS measurements [within-run analytic CV (CVa)] and between patients (CVb) (42). The within-patient CV (CVi) was calculated from the median CV between different time points of an individual (CVt) adjusted for the CVa, as follows: [CVi = (CVt2 − )1∕2. The reference change value (RCV) was calculated to determine the percentage change in the BIS parameters within a patient that is necessary to reflect a true (statistically significant) change [43]. The index of individuality (II) was calculated as CVt/CVb to determine whether the BIS parameters are best used within a reference intervals strategy (II > 0.6) or whether a relative-change monitoring strategy (II < 0.6) would be more useful for describing changes in BIS parameters [44]. With a ratio between analytical and within-patient variation of <0.5 for BIS parameters, we estimated that our study, with a sample of 32 patients undergoing BIS parameters measuring on four occasions, would have a power of 0.99 to estimate the within-person CV with a 95% CI [45].
The statistical power calculation was assessed with the R Statistical Software package ‘longpower’ (R Foundation for Statistical Computing, Vienna, Austria), which contains functions to compute sample sizes for linear mixed models [46]. With a sample size of 16 subjects in each treatment group, we have a statistical power of 80% to detect a difference between groups of 2.09 kg, 0.75 L and 1.51 kg in LTM, ICW and BCM, respectively.
All analyses were conducted using R Statistical Software version 3.3.1, using, in particular, the ‘lme4’, ‘lsmeans’ and ‘longpower’ packages.
RESULTS
Patient characteristics
Screening comprised 37 patients, 4 of whom did not meet inclusion criteria or fulfilled exclusion criteria. In all, 33 patients accepted to participate and were enrolled in the study. A total of 17 patients received post-dilution OL-HDF (treatment group) and 16 patients remained on HF-HD (control group) for 12 months. During this period we recorded three withdrawals from the study: two patients died and another was transferred to peritoneal dialysis by patient preference. These three patients were included in our intention-to-treat study design (Figure 1). Patient characteristics and dialysis procedure features at baseline are summarized in Tables 1 and 2, respectively. All patients were Caucasian. No baseline differences were noted between groups in BIS, anthropometric, biochemical or dialysis parameters. Patients did not receive treatment with oral supplements throughout the study.
Patient characteristics at baseline
| Characteristic | All (n = 33) | OL-HDF (n = 17) | HF-HD (n = 16) | P-value |
|---|---|---|---|---|
| Age (years) | 60.5 ± 17.5 | 57.3 ± 17.4 | 63.9 ± 17.5 | 0.28 |
| Sex (female/male, n (%) | 14/19 (42/58) | 8/9 (47/53) | 6/10 (38/62) | 0.42 |
| CKD aetiology, n (%) | ||||
| Nephrosclerosis | 5 (15) | 2 (12) | 2 (12) | 0.9 |
| Diabetic nephropathy | 5 (15) | 3 (18) | 3 (19) | |
| Glomerular | 8 (24) | 5 (28) | 3 (19) | |
| Interstitial | 4 (12) | 2 (12) | 2 (12) | |
| Other causes | 6 (19) | 3 (18) | 3 (19) | |
| Unknown | 5 (15) | 2 (12) | 3 (19) | |
| Dialysis vintage (months), median (IQR), months | 40 (11–137) | 40 (7–137) | 41 (12–136) | 0.9 |
| Comorbidity history, n (%) | ||||
| Diabetes mellitus | 6 (18) | 4 (24) | 2 (12) | 0.36 |
| Coronary artery disease | 4 (12) | 2 (12) | 2 (12) | 0.68 |
| Chronic heart failure | 7 (21) | 4 (24) | 3 (19) | 0.54 |
| Cerebrovascular disease | 2 (6) | 0 (0) | 2 (12) | 0.23 |
| Peripheral vascular disease | 6 (18) | 4 (24) | 2 (12) | 0.36 |
| Charlson comorbidity index (months), median (IQR), months | 7 (4–9) | 7 (4–9) | 8 (5–9) | 0.71 |
| BMI (kg/m2) | 24.7 ± 4.9 | 24.5 ± 5.3 | 24.9 ± 4.6 | 0.82 |
| SGA score | 14.5 ± 4.4 | 13.7 ± 4.5 | 15.4 ± 4.3 | 0.25 |
| Appetite (good or very good), n (%) | 24 (73) | 13 (77) | 11 (69) | 0.46 |
| nPNA (g/kg/day) | 1.17 ± 0.41 | 1.05 ± 0.44 | 1.30 ± 0.33 | 0.07 |
| Handgrip strength (kg) | 24.9 ± 10.9 | 23.8 ± 6.8 | 26.1 ± 14.1 | 0.57 |
| LTM (kg) | 35.6 ± 10.7 | 32.9 ± 9.1 | 38.4 ± 11.8 | 0.14 |
| Fat (kg) | 21.6 ± 11.2 | 24.1 ± 11.2 | 19.0 ± 10.9 | 0.20 |
| ATM (kg) | 29.3 ± 15.2 | 32.7 ± 15.2 | 25.8 ± 14.9 | 0.20 |
| BCM (kg) | 19.6 ± 7.1 | 17.9 ± 6.0 | 21.5 ± 7.9 | 0.15 |
| TBW (L) | 34.1 ± 6.4 | 32.5 ± 6.6 | 35.7 ± 5.9 | 0.15 |
| Extracellular body water (L) | 16.7 ± 3.0 | 15.9 ± 3.4 | 17.4 ± 2.4 | 0.51 |
| Intracellular body water (L) | 17.4 ±4.0 | 16.6 ± 3.7 | 18.3 ± 4.3 | 0.22 |
| ECW/ICW ratio | 0.98 ± 0.16 | 0.98 ± 0.14 | 0.99 ± 0.19 | 0.88 |
| OH (L) | 2.3 ± 1.7 | 1.9 ± 1.5 | 2.6 ± 1.9 | 0.24 |
| Phase angle at 50 kHz (degrees) | 4.5 ± 1.2 | 4.6 ± 1.0 | 4.4 ± 1.4 | 0.63 |
| Prealbumin (mg/dL) | 25.5 ± 7.0 | 25.3 ± 6.7 | 25.7 ± 7.6 | 0.9 |
| Albumin (g/L) | 3.9 ± 0.4 | 3.8 ± 0.3 | 4.0 ± 0.5 | 0.16 |
| Transferrin (mg/dL) | 251 ±67 | 257 ± 71 | 246 ± 64 | 0.61 |
| Creatinine (mg/dL) | 9.0 ± 2.8 | 8.8 ± 2.5 | 9.4 ± 3.2 | 0.55 |
| Creatinine index (mg/kg/day) | 20.3 ± 3.1 | 20.2 ± 2.9 | 20.4 ± 3.3 | 0.87 |
| Total cholesterol (mg/dL) | 131 ± 21 | 135 ± 24 | 128 ± 17 | 0.35 |
| Triglycerides (mg/dL) | 105 ± 36 | 115 ± 35 | 93 ± 34 | 0.08 |
| hs-CRP (mg/dL) | 3.3 (1.4–12.9) | 1.9 (1.3–9.7) | 4.9 (1.8–13.7) | 0.31 |
| Hemoglobin (g/dL) | 11.3 ± 1.0 | 11.3 ± 1.3 | 11.3 ± 0.8 | 0.46 |
| Calcium adjusted by albumin (mg/dL) | 8.8 ± 0.6 | 8.6 ± 0.6 | 9.0 ± 0.6 | 0.08 |
| Phosphate (mg/dL) | 4.1 ± 1.1 | 4.4 ± 1.2 | 3.8 ± 1.0 | 0.08 |
| i-PTH (pg/mL) | 299 (138–450) | 310 (133–524) | 254 (142–417) | 0.87 |
| Bicarbonate (mmol/L) | 25.3 ± 2.0 | 24.6 ± 1.8 | 26.0 ± 2.0 | 0.05 |
| β2-microglobulin (mg/L) | 27.6 ± 10.9 | 29.2 ± 14.1 | 25.7 ± 5.8 | 0.36 |
Results are shown as mean ± SD unless otherwise noted.
BMI, body mass index; i-PTH, intact parathyroid hormone.
Comparison of dialysis features and adequacy at baseline
| Treatment parameter | All (n = 33) | OL-HDF (n = 17) | HF-HD (n = 16) | P-value |
|---|---|---|---|---|
| Length of dialysis (h) | 4.2 ± 0.6 | 4.2 ± 0.8 | 4.2 ± 0.5 | 0.9 |
| Blood flow (mL/min) | 338 ± 44 | 340 ± 50 | 337 ± 38 | 0.86 |
| Dialysate flow rate (mL/min) | 500 ± 0 | 500 ± 0 | 500 ± 0 | n.a. |
| Vascular access, n (%) | ||||
| Arteriovenous fistula | 25 (76) | 12 (71) | 13 (81) | 0.32 |
| Arteriovenous graft | 1 (3) | 0 (0) | 1 (6) | |
| Tunnelled catheter | 7 (21) | 5 (29) | 2 (13) | |
| Residual kidney function (urine volume >200 mL/day), n (%) | 4 (12) | 3 (18) | 1 (6) | 0.32 |
| Systolic BP (mmHg) | ||||
| Treatment start | 141 ± 20 | 141 ± 21 | 141 ± 19 | 0.9 |
| Treatment end | 138 ± 20 | 138 ± 19 | 138 ± 22 | 0.9 |
| Diastolic BP (mm Hg) | ||||
| Treatment start | 71 ± 17 | 73 ± 17 | 68 ± 17 | 0.33 |
| Treatment end | 70 ± 17 | 74 ± 17 | 65 ± 17 | 0.17 |
| Pre-dialysis weight (kg) | 68.7 ± 15.3 | 68.1 ± 16.8 | 69.5 ± 14.1 | 0.80 |
| Post-dialysis weight (kg) | 66.6 ± 14.9 | 65.9 ± 16.3 | 67.3 ± 13.9 | 0.80 |
| Ultrafiltration volume (L) | 2.2 ± 0.8 | 2.2 ± 1.1 | 2.2 ± 0.8 | 0.9 |
| Kt (L) | 55.0 ± 8.2 | 54.6 ± 9.0 | 55.4 ± 7.6 | 0.79 |
| Kt/V | 1.8 ± 0.4 | 1.8 ± 0.4 | 1.9 ± 0.4 | 0.64 |
| TAC | 33.5 ± 8.5 | 32.2 ± 9.6 | 34.8 ± 8.1 | 0.42 |
| Urea reduction rate (%) | 77.8 ± 6.2 | 77.1 ± 6.5 | 78.5 ± 6.0 | 0.55 |
| Uric acid reduction rate (%) | 79.0 ± 4.9 | 79.0 ± 4.1 | 79.1 ± 5.8 | 0.9 |
| Phosphate reduction rate (%) | 57.1 ± 9.9 | 54.4 ± 11.0 | 59.9 ± 7.9 | 0.11 |
| β2-microglobulin reduction rate (%) | 68.6 ± 7.0 | 68.51 ± 7.57 | 68.63 ± 6.52 | 0.9 |
Results are shown as mean ± SD unless otherwise noted. TAC, time-averaged concentration of urea.
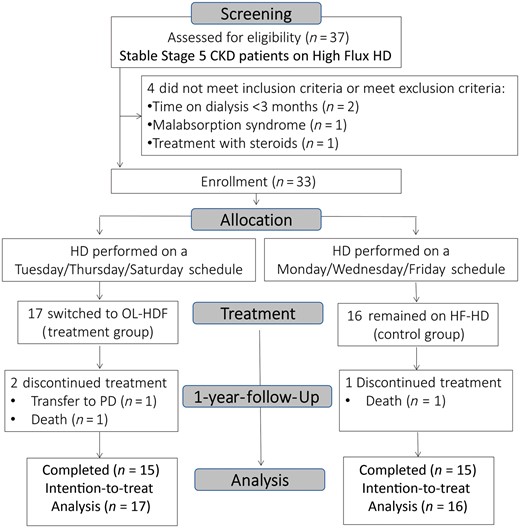
Patient flow throughout the study.
Body composition measured by multifrequency BIS
Lean body mass, estimated by LTM and BCM, remained stable in the OL-HDF group but decreased in the HF-HD group (Table 3, Figure 2a and 2b). These differences were statistically significant at Month 12, with a relative difference of 7.31 kg (95% CI 2.50–12.11) and 5.20 kg (95% CI 1.74–8.66) for LTM and BCM, respectively. In the HF-HD group there was a relative increase in adiposity estimated by ATM, which was evident at Month 4 and remained statistically significant at Months 8 and 12 (Table 3, Figure 2c). Changes in lean body mass mirrored those of ICW, with a relative difference between groups of 2.32 L (95% CI 0.63–4.01) at Month 12 (Table 3, Figure 3a). Similar changes were observed in TBW (Figure 3b), suggesting that the relative variations in TBW were driven by changes in ICW. There were neither significant relative changes in ECW nor OH (Table 3, Figure 3c and 3d). The phase angle increased in the treatment group compared with controls (Table 3), reflecting preservation of lean body mass in the treatment group.
Effects of treatment on body composition and nutrition
| Observed data (mean ± SD) | Treatment effectsa | ||||||||||
|---|---|---|---|---|---|---|---|---|---|---|---|
| Month 4 | Month 8 | Month 12 | |||||||||
| Parameter | Treatment | Baseline | Month 4 | Month 8 | Month 12 | Change from baseline, mean ± SE) | Treatment comparison, mean (95% CI) | Change from baseline, mean ± SE | Treatment comparison, mean (95% CI) | Change from baseline, mean ± SE | Treatment comparison, mean (95% CI) |
| LTM (kg) | OL-HDF | 32.90 ± 9.08 | 32.61 ± 10.56 | 32.87 ± 9.18 | 32.39 ± 10.62 | −0.29 ± 1.64 | 3.78 (−0.88–8.45), P = 0.11 | 0.83 ± 1.70 | 4.26 (−0.55–9.06), P = 0.08 | 0.34 ± 1.70 | 7.31 (2.50–12.11), P = 0.003 |
| HF-HD | 38.39 ± 11.84 | 34.31 ± 14.27 | 35.17 ± 10.95 | 31.64 ± 11.66 | −4.08 ± 1.69 | −3.44 ± 1.72 | −6.97 ± 1.72 | ||||
| Fat (kg) | OL-HDF | 24.07 ± 11.19 | 23.15 ± 12.21 | 23.80 ± 14.20 | 24.05 ± 13.15 | −0.92 ± 1.47 | −4.86 (−9.05 to −0.67), P = 0.02 | −0.49 ± 1.53 | −4.47 (−8.8 to −0.14), P = 0.04 | −0.24 ± 1.53 | −6.27 (−10.6 to −1.94), P = 0.005 |
| HF-HD | 18.97 ± 10.93 | 22.91 ± 13.89 | 24.62 ± 12.03 | 26.17 ± 11.25 | 3.94 ± 1.52 | 4.96 ± 1.55 | 6.51 ± 1.55 | ||||
| ATM (kg) | OL-HDF | 32.74 ± 15.22 | 31.49 ± 16.64 | 32.37 ± 19.32 | 32.73 ± 17.86 | −1.25 ± 2.00 | −6.61 (−12.32 to −0.90), P = 0.02 | −0.67 ± 2.08 | −7.44 (−13.32 to −1.53), P = 0.01 | −0.31 ± 2.08 | −9.16 (−15.03 to −3.28), P = 0.003 |
| HF-HD | 25.81 ± 14.86 | 31.18 ± 18.9 | 33.52 ± 16.37 | 35.59 ± 15.31 | 5.37 ± 2.06 | 6.77 ± 2.10 | 6.77 ± 2.10 | ||||
| BCM (kg) | OL-HDF | 17.88 ± 5.99 | 17.67 ± 7.04 | 17.93 ± 6.21 | 17.51 ± 7.11 | −0.21 ± 1.18 | 2.72 (−0.62–6.07), P = 0.11 | 0.60 ± 1.22 | 3.07 (−0.39–6.53), P = 0.08 | 0.18 ± 1.22 | 5.20 (1.74–8.66), P = 0.004 |
| HF-HD | 21.47 ± 7.92 | 18.54 ± 9.68 | 19.21 ± 7.34 | 16.65 ± 7.91 | −2.93 ± 1.21 | −2.47 ± 1.24 | −5.23 ± 1.24 | ||||
| TBW (L) | OL−HDF | 32.48 ± 6.63 | 32.69 ± 7.94 | 31.29 ± 5.81 | 31.35 ± 6.85 | 0.21 ± 0.83 | 1.68 (−0.68–4.04), P = 0.16 | −0.59 ± 0.87 | 2.16 (−0.27–4.59), P = 0.08 | −0.52 ± 0.87 | 2.87 (0.44–5.30), P = 0.02 |
| HF-HD | 35.74 ± 5.93 | 34.27 ± 7.73 | 33.23 ± 5.49 | 32.59 ± 6.48 | −1.47 ± 0.86 | −2.76 ± 0.88 | −3.39 ± 0.88 | ||||
| Extracellular body water (L) | OL-HDF | 15.94 ± 3.44 | 16.37 ± 4.29 | 14.79 ± 2.84 | 15.03 ± 3.10 | 0.43 ± 0.41 | 0.63 (−0.55–1.81), P = 0.29 | −0.90 ± 0.43 | 0.95 (−0.27–2.17), P = 0.12 | −0.66 ± 0.43 | 0.52 (−0.70–1.73), P = 0.39 |
| HF-HD | 17.44 ± 2.36 | 17.24 ± 3.12 | 15.77 ± 2.60 | 16.35 ± 2.58 | −0.20 ± 0.42 | −1.84 ± 0.43 | −1.17 ± 0.43 | ||||
| Intracellular body water (L) | OL-HDF | 16.55 ± 3.71 | 16.32 ± 4.15 | 16.50 ± 3.49 | 16.33 ± 4.16 | −0.23 ± 0.57 | 1.04 (−0.58–2.67), P = 0.21 | 0.29 ± 0.59 | 1.18 (−0.51–2.87), P = 0.17 | 0.11 ± 0.59 | 2.32 (0.63–4.01), P = 0.008 |
| HF-HD | 18.29 ± 4.27 | 17.02 ± 5.14 | 17.56 ± 4.10 | 16.23 ± 4.48 | −1.27 ± 0.59 | −0.89 ± 0.60 | −2.22 ± 0.60 | ||||
| OH (L) | OL-HDF | 1.91 ± 1.49 | 2.59 ± 2.60 | 0.81 ± 0.96 | 1.13 ± 0.74 | 0.68 ± 0.42 | 0.41 (−0.77–1.59), P = 0.49 | −1.07 ± 0.43 | 0.73 (−0.51–1.97), P = 0.24 | −0.75 ± 0.43 | −0.34 (−1.58–0.90), P = 0.59 |
| HF-HD | 2.62 ± 1.92 | 2.89 ± 1.73 | 0.70 ± 2.47 | 2.08 ± 1.71 | 0.27 ± 0.43 | −1.79 ± 0.44 | −0.41 ± 0.44 | ||||
| Phase angle at 50 kHz (degrees) | OL-HDF | 4.61 ± 1.00 | 4.39 ± 1.11 | 4.72 ± 1.10 | 4.75 ± 4.21 | −0.21 ± 0.14 | −0.01 (−0.40–0.38), P = 0.9 | 0.18 ± 0.14 | 0.34 (−0.05–0.73), P = 0.09 | 0.21 ± 0.14 | 0.47 (0.08–0.86), P = 0.02 |
| HF-HD | 4.40 ± 1.44 | 4.19 ± 1.32 | 4.31 ± 1.18 | 4.21 ± 0.99 | −0.21 ± 0.14 | −0.16 ± 0.14 | −0.26 ± 0.14 | ||||
| Pre-albumin (mg/dL)b | OL-HDF | 25.3 ± 6.7 | 23.3 ± 6.3 | 25.2 ± 4.4 | 25.6 ± 4.9 | −2.09 ± 1.02 | −4.20 (−7.12 to −1.28), P = 0.005 | −0.18 ± 1.07 | −2.26 (−5.27–0.75), P = 0.14 | 0.20 ± 1.07 | −0.36 (−3.37–2.75), P = 0.81 |
| 0.57 ± 1.08 | |||||||||||
| HF-HD | 25.7 ± 7.6 | 27.8 ± 8.9 | 28.5 ± 8.7 | 27.0 ± 9.1 | 2.12 ± 1.05 | 2.10 ± 1.08 | |||||
| Albumin (g/L)b | OL-HDF | 3.8 ± 0.3 | 3.5 ± 0.3 | 3.5 ± 0.3 | 3.6 ± 0.2 | −0.029 ± 0.06 | −0.19 (−0.36 to −0.02), P = 0.03 | −0.27 ± 0.06 | −0.20 (−0.37 to −0.03), P = 0.02 | −0.21 ± 0.06 | −0.16 (−0.32–0.01), P = 0.06 |
| HF-HD | 4.0 ± 0.5 | 3.9 ± 0.3 | 3.9 ± 0.3 | 4.0 ± 0.4 | −0.10 ± 0.06 | −0.08 ± 0.06 | −0.05 ± 0.06 | ||||
| Transferrin (mg/dL)b | OL-HDF | 257.4 ± 71.1 | 201.9 ± 45.2 | 184.4 ± 51.0 | 191.5 ± 40.5 | −55.53 ± 13.55 | −28.81 (−67.70–9.98), P = 0.14 | −72.44 ± 13.78 | −36.68 (−75.47–2.11), P = 0.06 | −64.82 ± 14.03 | −0.56 (−40.20–39.08), P = 0.9 |
| HF-HD | 245.5 ± 63.8 | 228.7 ± 47.2 | 209.7 ± 42.5 | 180.2 ± 24.4 | −26.72 ± 14.97 | −35.76 ± 13.97 | −64.27 ± 14.22 | ||||
| Creatinine (mg/dL)b | OL-HDF | 8.8 ± 2.5 | 8.9 ± 2.6 | 8.7 ± 2.8 | 9.4 ± 3.4 | 0.11 ± 0.27 | 0.39 (−0.38–1.16), P = 0.32 | 0.10 ± 0.28 | 0.21 (−0.58–1.00), P = 0.60 | 0.82 ± 0.28 | 0.88 (0.08–1.78), P = 0.03 |
| HF-HD | 9.4 ± 3.2 | 9.1 ± 3.2 | 9.3 ± 3.0 | 9.5 ± 3.1 | −0.29 ± 0.28 | −0.12 ± 0.28 | −0.08 ± 0.29 | ||||
| Creatinine index (mg/kg/day)b | OL-HDF | 20.2 ± 2.9 | 20.3 ± 3.0 | 20.0 ± 3.2 | 20.6 ± 3.7 | 0.08 ± 0.22 | 0.31 (−0.31–0.94), P = 0.32 | 0.07 ± 0.22 | 0.18 (−0.46–0.81), P = 0.59 | 0.62 ± 0.23 | 0.69 (0.05–1.34), P = 0.04 |
| HF-HD | 20.4 ± 3.3 | 20.1 ± 3.3 | 20.3 ± 3.3 | 20.4 ± 3.4 | −0.24 ± 0.23 | −0.11 ± 0.23 | −0.07 ± 0.23 | ||||
| Total cholesterol (mg/dL)b | OL-HDF | 134.6 ± 23.6 | 131.3 ± 24.7 | 124.6 ± 24.2 | 138.7 ± 16.7 | −3.30 ± 3.79 | −0.65 (11.32–10.03), P = 0.9 | −8.37 ± 3.86 | −7.73 (−18.61–3.15), P = 0.16 | 4.03 ± 3.94 | 4.84 (−6.26–15.94), P = 0.39 |
| HF-HD | 127.8 ± 16.8 | 125.1 ± 14.9 | 127.1 ± 17.1 | 128.1 ± 20.6 | −2.66 ± 3.90 | −0.64 ±3.90 | −0.82 ± 3.98 | ||||
| Triglyceride (mg/dL)b | OL-HDF | 115.2 ± 34.8 | 101.5 ± 29.5 | 94.0 ± 35.5 | 110.6 ± 52.9 | −13.72 ± 7.84 | −12.36 (−34.57–9.85), P = 0.27 | −21.01 ± 7.99 | −38.95 (−61.55 to −16.35), P < 0.001 | −3.99 ± 8.16 | −12.49 (−35.54–10.56), P = 0.28 |
| HF-HD | 93.4 ± 33.8 | 92.0 ± 32.1 | 111.3 ± 57.1 | 103.5 ± 46.9 | −1.37 ± 8.08 | 17.95 ± 8.08 | 8.51 ± 8.24 | ||||
| nPNA (g/kg/day)b | OL-HDF | 1.05 ± 0.44 | 1.16 ± 0.28 | 1.20 ± 0.26 | 1.30 ± 0.33 | 0.11 ± 0.07 | 0.10 (−0.10–0.30), P = 0.33 | 0.16 ± 0.07 | 0.15 (−0.06–0.36), P = 0.15 | 0.24 ± 0.07 | 0.26 (0.05–0.47), P = 0.002 |
| HF-HD | 1.30 ± 0.33 | 1.31 ± 0.26 | 1.29 ± 0.28 | 1.27 ± 0.36 | 0.01 ± 0.07 | −0.01 ± 0.08 | −0.02 ± 0.08 | ||||
| Handgrip | OL−HDF | 23.80 ± 6.81 | 23.44 ± 8.06 | 23.25 ± 8.36 | 25.27 ± 9.06 | −0.36 ± 0.88 | −2.39 (−4.86–0.08), P = 0.06 | −0.21 ± 0.89 | −0.95 (−3.45–1.55), P = 0.45 | 1.81 ± 0.89 | 0.90 (−1.60–3.40), P = 0.48 |
| strength (kg) | HF-HD | 26.05 ± 14.07 | 27.83 ± 16.06 | 26.54 ± 14.74 | 26.72 ± 15.48 | 2.03 ± 0.89 | 0.75 ± 0.89 | 0.93 ± 0.89 | |||
| hs-CRP | OL-HDF | 9.3 ± 16.2 | 11.8 ± 21.2 | 5.9 ± 8.4 | 3.3 ± 2.9 | 2.49 ± 3.87 | −0.10 (−11.06– | −3.40 ± 3.87 | −1.01 (−11.97– | 4.96 ± 4.02 | −13.31 (−24.63 to |
| (mg/dL)b | HF-HD | 10.1 ± 13.2 | 12.7 ± 15.6 | 7.6 ± 11.8 | 18.4 ± 20.8 | 2.54 ± 3.99 | 10.86), P = 0.9 | −2.38 ± 4.07 | 8.36) P = 4.07 | 9.95) P = 0.86 | −1.98), P = 0.02 |
| Phosphate (mg/dL)b | OL-HDF | 4.44 ± 1.16 | 4.02 ± 0.91 | 3.80 ± 1.06 | 3.98 ± 1.07 | −0.41 ± 0.20 | −0.26 (−0.82–0.30), P = 0.36 | −0.55 ± 0.20 | −0.06 (−0.63–0.51), P = 0.83 | −0.39 ± 0.21 | −0.14 (−0.72–0.44), P = 0.63 |
| HF-HD | 3.76 ± 0.95 | 3.61 ± 1.15 | 3.27 ± 0.92 | 3.57 ± 0.81 | −0.15 ± 0.20 | −0.49 ± 0.20 | −0.25 ± 0.21 | ||||
| Bicarbonate (mmol/L)b | OL-HDF | 24.62 ± 1.82 | 24.50 ± 1.46 | 25.66 ± 2.51 | 24.69 ± 1.51 | −0.12 ± 0.46 | −0.75 (−2.05–0.55), P = 0.26 | 0.95 ± 0.47 | 1.04 (−0.27–2.35), P = 0.12 | 0.10 ± 0.48 | 0.54 (−0.81–1.89), P = 0.43 |
| HF-HD | 25.98 ± 2.04 | 26.61 ± 2.32 | 25.88 ± 2.07 | 25.55 ± 1.75 | 0.64 ± 0.47 | −0.10 ± 0.47 | −0.44 ± 0.48 | ||||
| β2-microglobulin (mg/L)b | OL-HDF | 29.24 ± 14.11 | 26.90 ± 10.81 | 27.32 ± 11.82 | 27.72 ± 12.69 | −2.34 ± 1.08 | −2.79 (−5.85–0.27), P = 0.07 | −2.38 ± 1.10 | −2.06 (−5.17–1.05), P = 0.19 | −1.45 ± 1.12 | −1.25 (−4.41–1.91), P = 0.43 |
| HF-HD | 25.73 ± 5.84 | 26.19 ± 6.52 | 25.43 ± 5.90 | 25.21 ± 5.85 | 0.45 ± 1.11 | −0.31 ± 1.11 | −0.02 ± 1.13 | ||||
Adjusted means and treatment effects were estimated under mixed-effects models with adjustment for the baseline level of the variable.
For variables measured monthly or bimonthly, Months 4, 8 and 12 designate the average over Months 1–4, 5–8 and 10–12, respectively.
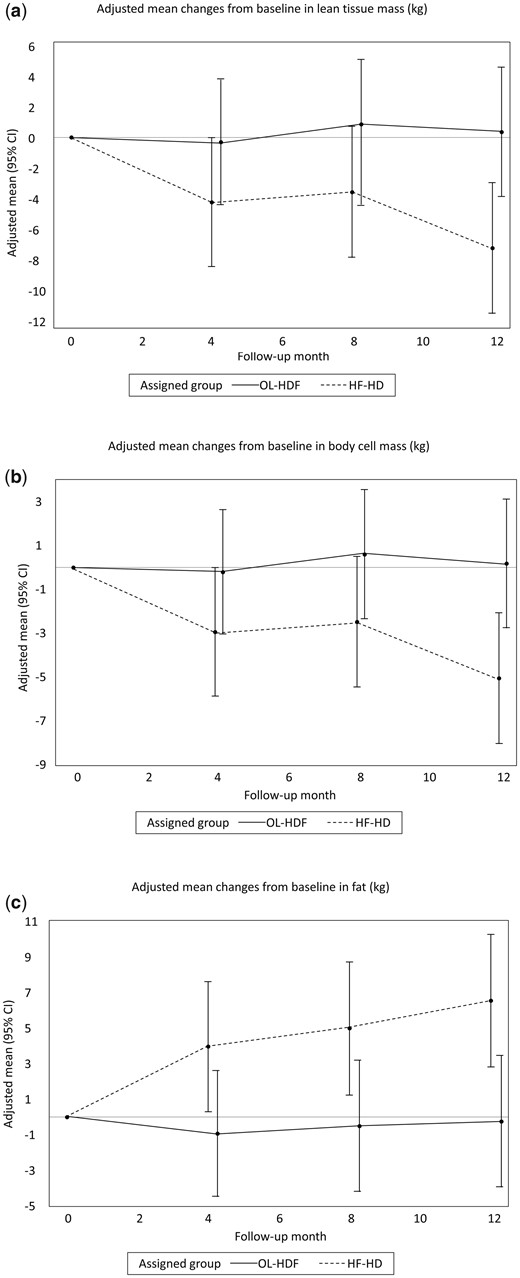
Effects of OL-HDF and HF-HD on body composition measured by BIS. Adjusted mean changes from baseline in (A) LTM, (B) BCM and (C) fat.
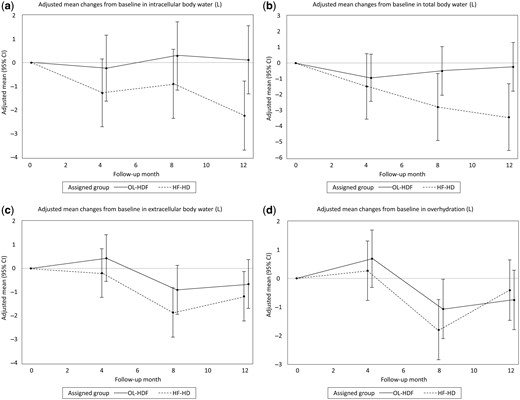
Effects of OL-HDF and HF-HD on fluid status measured by BIS. Adjusted mean changes from baseline in (a) intracellular body water, (b) TBW, (c) extracellular body water and (d) OH.
Serum pre-albumin concentration and other nutritional parameters
Pre-dialysis serum pre-albumin decreased at Month 4 in the OL-HDF group compared with HF-HD group, with a relative difference of −4.20 mg/dL (95% CI −7.12 to −1.28), although this difference was not sustained over Months 8 and 12 (Table 3, Figure 4a). Albumin levels decreased in both groups (Table 3, Figure 4b), but the reduction was significantly more pronounced in the OL-HDF group compared with the HF-HD group over Months 4–8, and with no statistically significant difference between treatment groups at Month 12. There was a relative increase in the creatinine index in the OL-HDF group, with a significant difference between groups at Month 12 [relative difference 0.69 mg/kg/day (95% CI 0.05–1.34)]. Changes in the creatinine index mirrored those of creatinine levels (Table 3). None of the between-group comparisons in other biochemical markers of nutritional status reached statistically significant differences (Table 3).
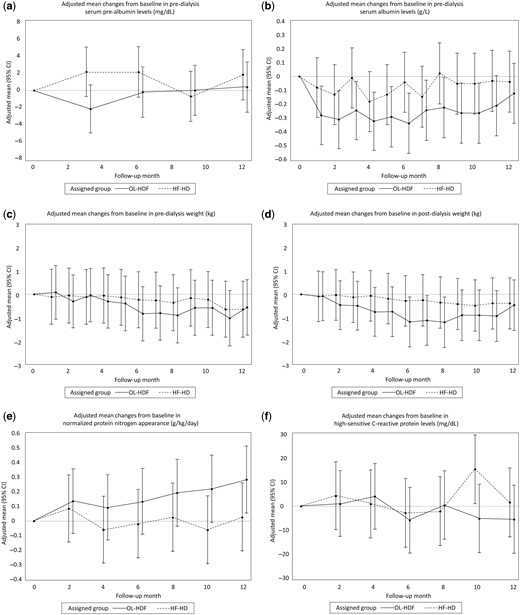
Effects of OL-HDF and HF-HD on serum prealbumin, serum albumin, pre- and post-dialysis weight, nPNA and hs-CRP. Adjusted mean changes from baseline in (a) predialysis prealbumin, (b) predialysis albumin, (c) pre- and (d) post-dialysis weight, (e) nPNA and (f) hs-CRP.
Secondary outcomes
There were no significant between-group differences at any time in pre- or post-dialysis weight (Supplementary data, Table S1, Figure 4c and 4d). nPNA increased in the OL-HDF group compared with the HF-HD group (Table 3, Figure 4e), reaching statistical significance at Month 12 with a relative difference of 0.26 g/kg/day (95% CI 0.05–0.47). The 12-month relative change in hs-CRP was −13.31 mg/dL (95% CI −24.63 to −1.98) in the OL-HDF group (Table 3, Figure 4f), whereas there were no significant relative changes in acid–base parameters. A positive trend toward improved appetite in the OL-HDF group versus the HF-HD group was observed during follow-up, which reached borderline significance at Month 8 (P = 0.050) (Supplementary data, Figure S1). There were no between-group differences in handgrip strength (Table 3).
Dialysis adequacy and treatment features
Changes in dialysis features and adequacy during follow-up are shown in Supplementary data, Table S1. As per protocol, dialysate flow was not changed over the study, whereas there was a mild relative increase in blood flow in the OL-HDF group. This change was statistically significant at Month 12, reflecting the effort to maximize the substitution flow rate. After administering a mean of a time-averaged substitution volume of 23.6 ± 3.4 L in the OL-HDF group, a higher reduction rate for small and middle molecules was noted (Supplementary data, Table S1). Kt/V increased significantly in OL-HDF compared with HF-HD, with relative differences of 0.24 (95% CI 0.04–0.44) and 0.21 (95% CI 0.00–0.42) at Months 8 and 12, respectively. Changes in Kt assessed by ionic dialysance mirrored those of Kt/V. Between baseline and Months 8 and 12, the relative change in the urea reduction rate was significantly higher in the OL-HDF group (Supplementary data, Table S1; Supplementary data, Figure S2a), in which there were also larger relative increases in β2-microglobulin reduction rates (Supplementary data, Table S1; Supplementary data, Figure S2b). Phosphate reduction rates tended to increase in the OL-HDF group compared with the HF-HD group, reaching significance at Month 8 [relative difference 7.80% (95% CI 0.15– 15.45)].
Safety
The safety profile of OL-HDF was comparable to that of HF-HD (Supplementary data, Table S2). There were no adverse events considered as related to the therapy. The mortality rate was 6% (one patient) in both groups (P = 0.74). The causes of death were pneumonia and sudden death at home in the OL-HDF and HF-HD group, respectively. The mean number of hospitalizations per patient from baseline to study end was similar for patients in the OL-HDF and HF-HD groups [0.88 (95% CI 0.28–1.48) versus 0.50 (95% CI 0.11–0.89); P = 0.27]. Tolerance to dialysis sessions was similar, with no significant changes in BP (Supplementary data, Table S1) and a similar mean number of intradialytic symptomatic hypotensive episodes [0.47 (95% CI 0.06–0.88) versus 0.38 (95% CI −0.10 to 0.85), OL-HDF compared with HF-HD; P = 0.75].
Biological variation indices
All BIS parameters showed a CVa and a CVi <15%, whereas CVb was >20%, especially for the fat parameter (Supplementary data, Table S3). The RCVs for LTM, ICW and BCM were 31%, 41% and 23%, respectively. The II was <0.6 for all BIS parameters.
DISCUSSION
Patients on HD are at an elevated risk for morbidity and mortality, which has been directly correlated to poor nutritional status [1–3]. Although several interventions are available for preventing PEW, including adequate diet counselling, oral supplements and appetite stimulants, PEW remains a challenge in the treatment of HD patients and additional strategies to enhance the nutritional status of these patients are needed [47]. We conducted this study to test the hypothesis that high convection volume improves PEW markers in HD patients. To our knowledge, this is the first controlled study evaluating the effect of high-volume OL-HDF on nutritional parameters and body composition in prevalent HD patients. Results suggest that 12 months of OL-HDF, compared with conventional HF-HD, has beneficial effects on preserving lean body mass. We also demonstrated increases in nPNA, an indicator of protein intake, and a mild reduction in serum hs-CRP levels.
Four major randomized clinical trials have compared OL-HDF with conventional HD [11, 27–29]. In the analysis of secondary endpoints, they briefly reported that nutritional parameters did not vary between groups and concluded that nutritional status is not affected by OL-HDF therapy. However, all of these studies have focused on biochemical parameters (principally albumin levels) and weight, both of which are poor indicators of PEW [2]. The present study quantifies the effect of OL-HDF on the four dimensions currently considered to define PEW. We present the novel finding that lean body mass is preserved in OL-HDF versus HF-HD. Supporting this, we also observed a relative increase in creatine index and serum creatinine, which in the absence of renal function represents muscle mass [48]. Savica et al. [6] initially observed a significant increase in fat-free mass and phase angle among 12 HD patients after switching for 6 months from standard bicarbonate HD with ultrapure dialysis fluid to OL-HDF, proposing the hypothesis that high convective extracorporeal treatment may be used to prevent malnutrition in individuals at risk. In a crossover trial of 76 patients, switching from low-flux conventional bicarbonate-buffered HD to high-flux ultrapure HD or OL-HDF resulted in an increase in the upper mid-arm muscle circumference [49]. Whereas low muscle mass has been associated with inflammation, cardiovascular disease and higher mortality risk in HD patients [50, 51], higher fat mass has been linked to frailty and worse physical performance [52, 53]. Perhaps not surprisingly, muscle mass preservation did not affect muscle strength in our study, which may require other therapeutic strategies such as resistance exercise [51].
In parallel, we also observed that dietary protein intake, as assessed by nPNA, is improved in OL-HDF versus HF-HD. This is in agreement with observational data as well as the ESHOL (OL-HDF Survival Study) randomized study [11, 22]. In contrast, the FRENCHIE (French Convective versus HD in the Elderly) study did not show differences between the OL-HDF and HF-HD arms [29]. None of the other existing trials estimated this parameter [27, 28, 49], which limits comparison. In spite of using ultrapure dialysate in both treatment groups, we also report a mild reduction in hs-CRP levels in OL-HDF, in agreement with observations that OL-HDF may cause less systemic inflammation [11, 13, 54]. This, theoretically, could result in less catabolism, a major component of the PEW syndrome [55]. We also observed a positive trend toward improved appetite in the OL-HDF group, in line with a previous prospective study of therapy intensification with nocturnal OL-HDF in paediatric patients [21]. Retention of uraemic toxins is believed to be causally involved in the anorexia and decreased protein intake of ESRD [2, 55]. Our study and previous evidence indicate a better removal of both low and middle molecular weight toxins with OL-HDF [17]. In this regard, it is noteworthy that the HDF modality tested in our study was high-volume OL-HDF, with a mean substitution volume > 21 L, which is increasingly recognized as the threshold volume of substitution fluid associated with better outcomes compared with HF-HD, including overall and cardiovascular survival [11, 27]. Lastly, our study also confirmed that OL-HDF results in greater removal of phosphate than standard HD [56]. This finding, besides improving phosphate control, could potentially translate into a reduced number of phosphate binders and a more liberal/increased dietary intake [18]. However, we acknowledge the lack of information on phosphate binder changes in our study, which makes our previous statement speculative.
We observed that albumin levels and weight did not significantly vary between the OL-HDF and HF-HD groups in our study. Although these findings may appear as inconsistent with the better lean body mass preservation and inflammation reduction observed, similar discrepancy results have been noted in the previous major randomized clinical trials. Whereas in ESHOL and CONTRAST (Convective Transport Study) a significant decline in albumin levels was reported [11, 57], no albumin change was noted in the Turkish and FRENCHIE studies [28, 29]. Similarly, a decrease in body weight over time has been observed in some [27, 57] but not all previous trials [11, 28, 29]. An explanation is that both albumin and body weight are not sensitive enough parameters to denote nutritional changes, as they are influenced by many other aspects of the disease, including fluid overload, infections and inflammation. In addition, body weight may be maintained, but body composition varies. Our comprehensive assessment of nutritional surrogates is thus a strength compared with the previous literature. However, our reduced sample size is a limitation that prevents us from making firm conclusions. Overall, our study and previous trials emphasize the safety well-tolerance of OL-HDF.
Finally, our study provides the indices of biological variation for the BIS parameters to ensure that observed changes over time in BIS parameters certainly reflect a significant change, far from what might be expected from the ‘normal’ biological fluctuation. Although we noted that the biological variation for BIS parameters overlapped the observed changes over time in BIS parameters, the CVi and the RCV for the primary endpoints of our study were quite narrow, indicating that observed changes could be considered as relevant changes despite assessment variation. The observed II was <0.6 for all BIS parameters, which indicates that population-derived references should not be applied and that patient-specific set points would be more accurate when interpreting the results [44].
A strengths of this study is the use of the preferred BIS methodology for assessment of primary outcomes, which has been validated against the gold standard reference methods [58]. Although OH before the dialysis session may theoretically overestimate muscle mass, we compare intra-individual changes under similar conditions and days of the week. To eliminate confounding, oral supplements were not prescribed during the intervention, low (Kt/V) and middle molecule (β2-microglobulin reduction rate) efficacy was matched and the same membrane, ultrapure dialysate and dialysate flow were applied to both groups. Although the study was prospective and controlled, the assignment to study arms based on the days of the week in which dialysis was performed was not completely random (quasi-randomization), and we acknowledge our inability to sufficiently control for unmeasured confounders. This, and the relatively small sample size, makes us see this study as a pilot trial in need of verification. Although the lack of blinding is an additional limitation, BIS was performed by staff blinded to the clinical and biochemical characteristics of the patients. We did not assess the caloric and nutritional intake during the study, nor did we measure other uraemic toxins or other interesting nutritional markers such as leptin.
To conclude, this study supports the hypothesis that high convection volume can positively impact on the protein hypercatabolic state of HD patients, suggesting that OL-HDF compared with HF-HD may contribute to preserve lean body mass, stabilize protein and fat stores, increase protein intake and reduce inflammation. Future trials adequately powered and better designed are warranted to confirm high-volume OL-HDF as an additional strategy for improving nutritional status in dialysis patients.
ACKNOWLEDGEMENTS
The authors gratefully thank the patients and nursing staff who participated in this study. We are grateful to Prof Francisco Maduell for stimulating comments and guidance in the estimation of the percent reduction in uraemic toxins concentrations.
The European Renal Nutrition (ERN) working group is an initiative of and supported by the European Renal Association–European Dialysis Transplant Association (ERA-EDTA).
This study was presented in abstract form at the 2013 American Society of Nephrology meetings, November 2013, Atlanta, GA, USA.
Portions of this work will be presented in thesis form in fulfilment of the requirements for a PhD for Belén Vizcaíno from University of Valencia.
SUPPLEMENTARY DATA
Supplementary data are available at ndt online.
AUTHORS’ CONTRIBUTIONS
P.M., B.V. and J.J.C. provided the research idea and study design. P.M., B.V., S.B., M.G-M, A.M., C.C-A., J.K., A.I.A., N.E. and J.J.C. provided data analysis and interpretation. P.M., M.D.M. and J.J.C. provided statistical analysis. J.L.G., L.M.P. and D.F. provided supervision and mentorship. All authors contributed important intellectual content during manuscript drafting or revision and accept responsibility for the overall work.
CONFLICT OF INTEREST STATEMENT
P.M. acknowledges speaker honoraria from Abbott Nutrition, Nutricia and Fresenius Clinical Care and consultancy fees from ViforPharma. J.J.C. acknowledges speaker honoraria from Abbott Nutrition; consultancy fees for Baxter Healthcare, ViforPharma, Laboratorios Rubió and Astellas and research grants from AstraZeneca and ViforPharma. D.F. received honoraria and lecture fees from Fresenius Medical Care, Fresenius Kabi, Sanofi and Vifor. All the other authors declared no relevant competing interests. The results presented in this paper have not been published previously in whole or part except in abstract format.


Comments
We remain uncertain, however, of whether the hypothesis can be successfully proven. First, because of the reported glucose losses during hemodialysis (HD) secondary to diffusive transport (7), which may counterbalance the amount of glucose delivered in the replacement fluid. Because of the molecular weight of glucose is only 180 Daltons, glucose can thus move easily across the filtering membrane in favor of the concentration gradient. It has been shown that a dialysis fluid containing glucose is necessary to prevent HD-induced hypoglycemia (8,9). This diffusive movement may explain why hyperglycemia in diabetic patients can be ameliorated in spite of using a 90 mg/dL glucose concentration in the dialysate fluid (10). The constant glucose concentration in the dialysate may maintain the levels of plasma glucose relatively constant, preventing both HD-induced hypo and hyperglycemia in patients undergoing OL-HDF. Finally, as observed in peritoneal dialysis patients, glucose absorption may lead to hyperinsulinemia and weight gain, primarily driven by an increase in fat mass (11). This contrasts with the observed preservation in lean body mass in our study, without increasing fat mass, in the OL-HDF group compared to conventional HD (1). Collectively, we believe that a better removal of uremic toxins, the reduction in the inflammation state and the improvement in appetite and protein intake are the putative mechanisms that may explain the preservation of the nutritional status linked to OL-HDF treatment (12). Thanks again for your interest in our work.
Pablo Molina1, MD, PhD; and Juan J. Carrero2, Pharm, PhD.
1Department of Nephrology, Hospital Universitari Dr Peset, REDinREN, Department of Medicine, Universitat de València, Spain.
2Department of Medical Epidemiology and Biostatistics, Karolinska Institutet, Stockholm, Sweden.
1. Molina P, Vizcaíno B, Molina MD, et al. The effect of high-volume online haemodiafiltration on nutritional status and body composition: the ProtEin Stores prEservaTion (PESET) study. Nephrol Dial Transplant. 2018 Jan 22. doi: 10.1093/ndt/gfx342. [Epub ahead of print]
2. Marano M, Cirillo G. The Forgotten Issue of Glucose Delivery to Diabetes Patients in On-Line Hemodiafiltration. Ther Apher Dial. 2016 Apr;20(2):205. doi: 10.1111/1744-9987.12385.
3. Maduell F, Moreso F, Pons M, et al. High-efficiency postdilution online hemodiafiltration reduces all-cause mortality in hemodialysis patients. J Am Soc Nephrol. 2013;24(3):487-97.
4. Grooteman MP, van den Dorpel MA, Bots ML, et al. Effect of online hemodiafiltration on all-cause mortality and cardiovascular outcomes. J Am Soc Nephrol. 2012;23(6):1087-96.
5. Ok E, Asci G, Toz H, et al. Turkish Online Haemodiafiltration Study. Nephrol Dial Transplant. 2013;28(1):192-202.
6. Morena M, Jaussent A, Chalabi L, et al. Treatment tolerance and patient-reported outcomes favor online hemodiafiltration compared to high-flux hemodialysis in the elderly. Kidney Int. 2017;91(6):1495-1509.
7. Gutierrez A, Bergström J, Alvestrand A. Hemodialysis-associated protein catabolism with and without glucose in the dialysis fluid. Kidney Int. 1994;46(3):814-22.
8. Jackson MA, Holland MR, Nicholas J, et al. Hemodialysis-induced hypoglycemia in diabetic patients. Clin Nephrol. 2000;54(1):30-4.
9. Sangill M, Pedersen EB. The effect of glucose added to the dialysis fluid on blood pressure, blood glucose, and quality of life in hemodialysis patients: a placebo-controlled crossover study. Am J Kidney Dis 2006;47:636-43.
10. Burmeister JE, Campos JF, Miltersteiner DR. Effect of different levels of glucose in the dialysate on the risk of hypoglycaemia during hemodialysis in diabetic patients. J Bras Nefrol. 2012;34(4):323-7.
11. da Silva DR, Figueiredo AE, Antonello IC, et al. Solutes transport characteristics in peritoneal dialysis: variations in glucose and insulin serum levels. Ren Fail. 2008;30(2):175-9.
12. ter Wee PM, Fouque, D. Nutritional Aspects of On-Line Hemodiafiltration. In: MJ Nubé, Muriel PC, and Grooteman PB, eds. Hemodiafiltration: Theory, Technology and Clinical Practice. Switzerland: Springer International Publishing; 2016:233-8.
I congratulate the Authors of the PESET study for having corroborated the hypothesis that online-HDF can improve nutritional status and counteract protein-energy wasting in hemodialysis patients. An undeniable explanation for this effect, however, doesn’t yet exist and the sizeable amount of glucose delivered in by online-HDF could be taken into account.
Having performed high-volume treatments with substitution volume larger than 21 L per session, being the substitution volume nothing else than dialysis bath, recalling that dialysis bath contains 1g glucose each liter, the patients assigned to on-line HDF received at least glucose 21 grams per venam every other day. It might also be relevant that in the post-dilution mode the substitution fluid (and glucose 1g/L) is delivered directly in the patient’s bloodstream, bypassing the filtering membrane and, therefore, it was somewhat belatedly affected by the diffusive mass transfer. Although being only a theoretical conjecture, this is based on undeniable facts. This could be a neglected issue contributing to better survival rates associated with on-line HDF. Quite surprisingly in the PESET study, blood glucose levels (or more appropriate glycemic indexes) do not seem to be assessed; hence, the opportunity to investigate the issue is missed .
Marco Marano, MD
Hemodialysis Unit. Maria Rosaria Clinic. Pompeii. Italy
e-mail: [email protected]
The Author declares having not conflict of interest