


Abstract
With its convective component, hemodiafiltration (HDF) provides better middle molecule clearance compared with hemodialysis (HD) and is postulated to improve survival. A previous analysis of Dialysis Outcomes and Practice Patterns Study (DOPPS) data in 1998–2001 found lower mortality rates for high replacement fluid volume HDF versus HD. Randomized controlled trials have not shown uniform survival advantage for HDF; in secondary (non-randomized) analyses, better outcomes were observed in patients receiving the highest convection volumes.
In a ‘real-world’ setting, we analyzed patients on dialysis >90 days from seven European countries in DOPPS Phases 4 and 5 (2009–15). Adjusted Cox regression was used to study HDF (versus HD) and mortality, overall and by replacement fluid volume.
Among 8567 eligible patients, 2012 (23%) were on HDF, ranging from 42% in Sweden to 12% in Germany. Median follow-up was 1.5 years during which 1988 patients died. The adjusted mortality hazard ratio (95% confidence interval) was 1.14 (1.00–1.29) for any HDF versus HD and 1.08 (0.92–1.28) for HDF >20 L replacement fluid volume versus HD. Similar results were found for cardiovascular and infection-related mortality. In an additional analysis aiming to avoid treatment-by-indication bias, we did not observe lower mortality rates in facilities using more HDF (versus HD).
Our results do not support the notion that HDF provides superior patient survival. Further trials designed to test the effect of high-volume HDF (versus lower volume HDF versus HD) on clinical outcomes are needed to adequately inform clinical practices.
INTRODUCTION
Due to its convective component, hemodiafiltration (HDF) provides higher clearance of middle molecular solutes compared with low- or high-flux hemodialysis (HD) [1], and may plausibly improve clinical outcomes. At present, ∼18% (∼70 000 patients) of all dialysis patients in Europe receive online HDF, with substantially lower rates in Japan (8%; ∼35 000 patients) and no use in the USA [2]. This large variation across countries is due in part to differences in regulatory approval for online production of replacement fluid and other technique-related issues (relative complexity, cost, safety concerns). Another major reason is the lack of definitive evidence demonstrating the superiority of HDF. Several studies, including a prior analysis of Dialysis Outcomes and Practice Patterns Study (DOPPS) data, have suggested that HDF may result in better outcomes than HD [3–7], but these findings may be prone to residual confounding and selection bias. Results from randomized trials were inconclusive, with only one study demonstrating a survival benefit of HDF versus HD [8–10]. The most recent French randomized controlled trial (RCT) [11], which focused on elderly patients, did not find a significant difference in either all-cause or cardiovascular mortality between HD and HDF, or between HDF patients with convective volume below versus above 20 L; post hoc analyses did not identify differences between the treatments outside of the number of sessions with asymptomatic hypotension. Further, results may not be applicable to ‘average’ dialysis patients, due to rigorous inclusion/exclusion criteria in the study design. Based on these considerations, we revisited the association of HDF with mortality in a ‘real-world’ setting using a more recent DOPPS cohort that reflects current application of HDF in clinical practice.
MATERIALS AND METHODS
Data source
The DOPPS is an international prospective cohort study of patients aged 18 years or older treated with in-center HD or HDF. Patients were randomly selected from national samples of dialysis facilities within each country [12, 13]. In this analysis, data from participants in seven European countries (Belgium, France, Germany, Italy, Spain, Sweden and the UK) in DOPPS Phase 4 (2009–11) and Phase 5 (2012–15) were used. Data on demographics, comorbid conditions, laboratory values and prescriptions were abstracted from medical records using uniform and standardized data collection tools. Mortality events were collected during study follow-up. Among 11 885 potential subjects, we excluded patients with vintage <90 days, not dialyzing three times per week, missing type of dialysis (HDF versus HD) and with no follow-up; 8567 patients remained eligible and were used in our analysis. In a separate analysis, DOPPS 2014 Medical Director Survey (MDS) data from 92 facilities across these seven European countries were used to summarize responses to the question, ‘To what extent do you consider the following clinical conditions to be indications for HDF or hemofiltration in your facility?’ for 12 patient characteristics.
Defining HDF
Two separate variables were abstracted from the DOPPS medical questionnaire: (i) whether the patient was receiving HDF and (ii) if so, how many liters of intravenous replacement fluid were prescribed: <4.0 L, 4.0–8.0 L, 8.1–15.0 L, 15.1–20.0 L, 20.1–30.0 L or >30.0 L. We prioritized the latter question, categorizing a patient with at least 4.0 L of replacement fluid volume as HDF and <4.0 L as HD. If fluid replacement volume was missing, then the former question was used to define HDF versus HD, resulting in some patients classified as HDF but missing replacement fluid volume. Patients missing data on both variables were excluded. For analysis, replacement fluid volume categories were condensed into three groups to avoid sparse cells: 4.0–15.0 L, 15.1–20.0 L and >20.0 L. Facility percentage of patients on HDF (any volume > 4 L) was calculated for facilities with more than five eligible patients. Regarding HD, patient-level data on high versus low-flux were not available in this cohort. However, responses from the 2014 MDS among European DOPPS facilities indicated that high-flux HD was used for the majority of patients in ∼85% of facilities, including ∼70% of facilities where high-flux HD was used for all or almost all patients. These survey data suggest that our reference group of HD patients was primarily using high-flux HD.
Statistical analysis
We used Cox regression to estimate the association between HDF (versus HD) and all-cause mortality. All models were stratified by DOPPS phase and country, and accounted for facility clustering using robust sandwich covariance estimators. Models were progressively adjusted for the following potential confounders: age, sex, dialysis vintage, 13 summary comorbidities (listed in Table 1), vascular access, blood flow rate, body mass index (BMI), serum albumin and hemoglobin. Time at risk started at study enrollment and ended at the time of death, 7 days after leaving the facility due to transfer or change in kidney replacement therapy modality, loss to follow-up, transplantation or end of study phase (whichever event occurred first).
Patient characteristics by HDF use and replacement fluid volume
| All patients | HD | All HDF | HDF | HDF | HDF | |
|---|---|---|---|---|---|---|
| 4.0–15.0L | 15.1–20.0L | >20.0L | ||||
| Number of patients | 8567 | 6555 | 2012 | 314 | 538 | 1010 |
| Age (years) | 65.8 ± 15.0 | 66.2 ± 14.9 | 64.8 ± 15.0 | 66.8 ± 15.4 | 65.2 ± 14.7 | 64.4 ± 15.1 |
| Sex (% male) | 61 | 60 | 66 | 56 | 65 | 69 |
| Vintage (years) | 2.5 (0.8–5.8) | 2.3 (0.7–5.4) | 3.2 (1.1–7.0) | 3.3 (1.1–7.2) | 2.9 (1.0–6.1) | 3.4 (1.2–7.1) |
| Residual kidney function (%) | 40 | 42 | 35 | 30 | 31 | 39 |
| Vascular access (%) | ||||||
| AV fistula | 67 | 65 | 73 | 73 | 70 | 75 |
| AV graft | 6 | 6 | 6 | 6 | 9 | 5 |
| Catheter | 27 | 29 | 21 | 22 | 22 | 20 |
| Achieved blood flow rate (mL/min) | 319 ± 59 | 315 ± 58 | 333 ± 58 | 312 ± 54 | 327 ± 54 | 342 ± 59 |
| Achieved treatment time (min) | 239 ± 27 | 238 ± 26 | 243 ± 30 | 234 ± 30 | 240 ± 26 | 249 ± 31 |
| Intradialytic weight loss (%) | 2.5 ± 1.5 | 2.5 ± 1.5 | 2.5 ± 1.5 | 2.7 ± 1.6 | 2.6 ± 1.6 | 2.5 ± 1.5 |
| BMI (kg/m2) | 26.0 ± 5.4 | 26.0 ± 5.4 | 26.1 ± 5.6 | 25.4 ± 5.5 | 26.3 ± 5.5 | 26.1 ± 5.7 |
| spKt/V | 1.53 ± 0.33 | 1.50 ± 0.32 | 1.62 ± 0.34 | 1.49 ± 0.31 | 1.63 ± 0.32 | 1.66 ± 0.34 |
| Albumin (g/dL) | 3.73 ± 0.57 | 3.74 ± 0.57 | 3.68 ± 0.57 | 3.68 ± 0.48 | 3.72 ± 0.61 | 3.65 ± 0.57 |
| nPCR (g/kg/day) | 1.00 ± 0.25 | 1.00 ± 0.25 | 1.00 ± 0.23 | 1.00 ± 0.22 | 1.01 ± 0.24 | 1.00 ± 0.24 |
| Phosphorus (mg/dL) | 4.9 ± 1.6 | 5.0 ± 1.6 | 4.9 ± 1.6 | 5.0 ± 1.6 | 4.8 ± 1.7 | 4.8 ± 1.5 |
| Hemoglobin (g/dL) | 11.4 ± 1.4 | 11.3 ± 1.4 | 11.5 ± 1.4 | 11.5 ± 1.3 | 11.5 ± 1.4 | 11.5 ± 1.4 |
| Ferritin (ng/mL) | 380 (200–601) | 377 (200–599) | 392 (203–610) | 376 (189–546) | 399 (193–605) | 394 (212–641) |
| CRP (mg/L) | 6.0 (2.9–15.0) | 6.0 (2.9–14.6) | 5.4 (2.9–15.3) | 7.4 (4.0–17.4) | 5.5 (2.9–14.9) | 5.0 (2.5–15.4) |
| WBC count (1000 cells/mm3) | 7.1 ± 2.3 | 7.1 ± 2.3 | 6.9 ± 2.2 | 7.1 ± 2.1 | 6.8 ± 2.1 | 7.0 ± 2.3 |
| Pre-dialysis SBP (mmHg) | 137.9 ± 21.9 | 137.7 ± 21.7 | 138.4 ± 22.6 | 136.7 ± 24.3 | 137.5 ± 22.6 | 138.9 ± 22.0 |
| Post-dialysis SBP (mmHg) | 132.0 ± 22.6 | 132.1 ± 22.2 | 132.0 ± 23.9 | 130.7 ± 23.9 | 130.4 ± 23.3 | 132.8 ± 24.2 |
| Transplant waiting list | 12 | 11 | 13 | 12 | 12 | 13 |
| Comorbid conditions (%) | ||||||
| Coronary artery disease | 35 | 35 | 36 | 35 | 35 | 38 |
| Cancer (non-skin) | 17 | 17 | 17 | 17 | 16 | 18 |
| Other cardiovascular disease | 31 | 31 | 31 | 31 | 29 | 33 |
| Cerebrovascular disease | 17 | 16 | 17 | 21 | 16 | 18 |
| Congestive heart failure | 19 | 20 | 16 | 15 | 15 | 17 |
| Diabetes | 36 | 36 | 37 | 36 | 36 | 38 |
| Gastrointestinal bleeding | 5 | 5 | 5 | 4 | 4 | 4 |
| Hypertension | 86 | 86 | 84 | 81 | 81 | 87 |
| Lung disease | 14 | 14 | 12 | 15 | 14 | 11 |
| Neurologic disease | 12 | 12 | 10 | 13 | 10 | 9 |
| Psychiatric disorder | 17 | 18 | 16 | 13 | 19 | 15 |
| Peripheral vascular disease | 30 | 30 | 32 | 32 | 31 | 33 |
| Recurrent cellulitis, gangrene | 9 | 9 | 10 | 10 | 11 | 10 |
Values are presented as mean ± SD or median (interquartile range) or percentage shown; residual kidney function defined as urine output >200 mL/day; intradialytic weight loss defined as percentage of body weight shown, normalized to midweek; AV, arteriovenous; CRP, C-reactive protein; nPCR, normalized protein catabolic rate; SBP, systolic blood pressure and WBC, white blood cell.
Similar models were used to assess the association between HDF and cause-specific mortality: cardiovascular-related mortality and infection-related mortality. In addition to analyzing any HDF versus HD, we also investigated differences by HDF replacement fluid volume; HD was treated as the reference and hazard ratios (HRs) and 95% confidence intervals (CIs) were estimated for three groups of HDF: 4–15 L, 15.1–20 L and >20 L. We also tested effect modification by six factors: congestive heart failure, catheter use, albumin (≥4 versus <4 g/dL), age (>70 versus ≤70 years), sex and diabetes.
Due to the observational nature of this study, covariate adjustment for a wide set of covariates may not account for all of the differences between HDF and HD patients; we thus provide an alternate approach utilizing practice differences between DOPPS facilities. To avoid the treatment-by-indication bias resulting from patients being selected as good candidates for HDF within each facility, we divided facilities into four groups based on their propensity to prescribe HDF to patients. Among the 258 facilities with more than five eligible patients, 30% did not prescribe HDF to any patients, 27% prescribed HDF to 1–14% of patients, 24% prescribed HDF to 15–49% of patients and 19% prescribed HDF to at least 50% of patients. Because confounding is more likely at the facility level than at the patient level in this model, we additionally adjusted for five facility-level covariates likely associated with mortality: the percentage of patients in a facility with a catheter, with single-pool Kt/V (spKt/V) <1.2, with albumin <3.5 g/dL and with phosphorus ≥5.5 mg/dL, and mean within-facility hemoglobin level. We performed a sensitivity analysis assessing patient-level HDF and mortality after excluding the 30% of facilities that did not prescribe HDF to any patients. We also performed a sensitivity analysis excluding HDF patients for which post-dilution could not be confirmed as the typical location used for replacement fluid by DOPPS MDS data.
Missing covariate values were addressed by multiple imputations using the Sequential Regression Multiple Imputation Method [14] by IVEware [15]. Results from 20 such imputed datasets were combined for the final analysis using Rubin’s formula [16]. The proportion of missing data was <5% for all model covariates, with the exception of albumin (12%), BMI (8%) and blood flow rate (6%). All analyses were conducted using SAS, version 9.4 (SAS institute, Cary, NC, USA).
RESULTS
HDF use
Our study sample included ∼20 HD facilities from each of the seven European DOPPS countries, for a total of 135 dialysis facilities in DOPPS Phase 4 and 128 in DOPPS Phase 5; 8567 patients were included, of whom 2012 (23%) were on HDF. We observed wide variation in the proportion of patients prescribed HDF across facilities (Figure 1). A handful of sampled facilities (6%) across these countries prescribed HDF to all of their patients, while 30% did not prescribe HDF at all. Figure 2 shows that in recent years (Phase 5: 2012–15), HDF use was most common in Sweden (52%) and least common in Germany (13%). Low-volume HDF (4–15 L replacement fluid, including acetate-free biofiltration) was fairly common in Italy and the UK, but in the three countries with the greatest HDF usage (Sweden, France and Belgium), nearly all HDF patients had >15 L replacement fluid volume.
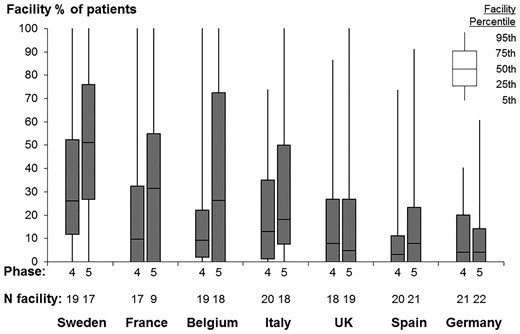
Dialysis facility use of HDF, by country and DOPPS phase. DOPPS Phase 4: 2009–11; DOPPS Phase 5: 2012–15. Data suppressed from five facilities with sparse data (five or fewer eligible patients).

HDF replacement fluid volume, by country and DOPPS phase. DOPPS Phase 4: 2009–11; DOPPS Phase 5: 2012–15.
Patient characteristics
Among 2012 HDF patients, replacement fluid volume was 4–15 L for 314 patients (16%), 15.1–20 L for 538 patients (27%) and >20 L for 1010 patients (50%) [including 279 with >30 L (14%)]. Information on replacement volume was missing for 150 patients (7%); these patients were included in the primary analysis of any HDF versus HD but excluded from analyses by replacement fluid volume. Table 1 displays patient characteristics by replacement fluid volume. Compared with HD, HDF patients tended to be younger and were more likely to be male, especially those on the highest volume HDF. HDF patients had longer dialysis vintage, and were less likely to have residual kidney function or to dialyze with a catheter. Blood flow rate and Kt/V were higher for HDF patients, particularly for high-volume HDF. Most laboratory values were comparable between HDF and HD patients; similarly, the presence of comorbid conditions varied slightly between groups. Intradialytic weight loss (IDWL) was ∼2.5% of body weight—equal to 2 L for an 80 kg patient—among patients on HDF >20 L and so convection volume (replacement fluid volume + IDWL) was approximately >22 L in this group.
HDF and mortality
Median follow-up was 1.5 years (interquartile range: 0.7–2.5) and 1988 patients died, resulting in a mortality rate of 14.8 per 100 patient-years. In unadjusted models, only stratified by DOPPS phase and country (Table 2, Model 1), the HR (95% CI) of HDF versus HD was 1.01 (0.88–1.16) and the HR (95% CI) of high volume (>20 L) HDF versus HD was 0.90 (0.75–1.08). Because of differences in patient characteristics shown in Table 1, adjustment for confounding factors results in less biased effect estimates. The adjusted HR (95% CI) was 1.14 (1.00–1.29) for HDF versus HD and 1.08 (0.92–1.28) for HDF >20 L versus HD (Table 2, Model 5). In a sensitivity analysis excluding 30% of facilities that did not prescribe HDF to any patients, we observed an HR (95% CI) of 1.11 (0.98–1.26) for HDF versus HD. We found no evidence of effect modification by congestive heart failure, catheter use, albumin, sex or diabetes (P for interaction >0.3). The HR (95% CI) for HDF versus HD was 1.23 (1.06–1.43) among age >70 years and 0.99 (0.82–1.19) among age ≤70 years (P for interaction = 0.05).
HDF and all-cause mortality, by level of adjustment
| Model 1 | Model 2 | Model 3 | Model 4 | Model 5 | |
|---|---|---|---|---|---|
| Stratified by phase and country | +Age, sex, vintage | +13 summary comorbidities | +Vascular access, blood flow rate | +BMI, Hgb, albumin | |
| Overall | |||||
| Any HDF versus HD | 1.01 (0.88–1.16) | 1.08 (0.95–1.23) | 1.09 (0.97–1.24) | 1.14 (1.01–1.29) | 1.14 (1.00–1.29) |
| By volume replacement | |||||
| HD (Ref.) | 1 (Ref.) | 1 (Ref.) | 1 (Ref.) | 1 (Ref.) | 1 (Ref.) |
| HDF, 4.0–15.0 L | 1.35 (1.05–1.74) | 1.30 (1.04–1.62) | 1.28 (1.03–1.58) | 1.28 (1.03–1.58) | 1.26 (1.01–1.57) |
| HDF, 15.1–20.0 L | 1.04 (0.86–1.25) | 1.09 (0.91–1.31) | 1.10 (0.92–1.32) | 1.15 (0.96–1.37) | 1.16 (0.97–1.40) |
| HDF, >20.0 L | 0.90 (0.75–1.08) | 1.00 (0.84–1.19) | 1.02 (0.86–1.21) | 1.09 (0.92–1.29) | 1.08 (0.92–1.28) |
Values are presented as HR (95% CI); Hgb, hemoglobin; 13 comorbidities listed in Table 1.
In similarly adjusted models analyzing cardiovascular-related mortality (n = 758 events; 9% of patients) and infection-related mortality (n = 330 events; 4% of patients), we observed an HR (95% CI) for HDF versus HD of 1.20 (1.01–1.43) and 1.14 (0.83–1.56), respectively.
In an additional analysis using facility percentage of patients prescribed HDF as the exposure, with facilities that do not prescribe HDF to any patients as the reference group, the adjusted HR (95% CI) was 1.17 (1.00–1.37) for facilities prescribing HDF to 1–14% of patients, 1.09 (0.92–1.30) for facilities prescribing HDF to 15–49% of patients and 1.31 (1.08–1.57) for facilities prescribing HDF to ≥50% of patients. Results were consistent when analyzing cardiovascular-related mortality and infection-related mortality (Table 3). A sensitivity analysis categorizing facilities by percentage of patients prescribed HDF >20 L rather than any volume also yielded similar results.
Facility percentage of HDF use and mortality
| Number of facilities (%) | All-cause mortality | CV-related mortality | Infection-related mortality | |
|---|---|---|---|---|
| Facility percentage of patients using HDF | ||||
| 0% (all HD) | 78 (30%) | 1 (Ref.) | 1 (Ref.) | 1 (Ref.) |
| 1–14% | 69 (27%) | 1.17 (1.00–1.37) | 1.33 (1.04–1.72) | 1.28 (0.89–1.83) |
| 15–49% | 61 (24%) | 1.09 (0.92–1.30) | 1.11 (0.83–1.47) | 1.29 (0.88–1.87) |
| ≥50% | 50 (19%) | 1.31 (1.08–1.57) | 1.37 (1.03–1.81) | 1.31 (0.85–2.01) |
Values are represented as HR (95% CI); Cox models stratified by DOPPS phase and country, adjusted for age, sex, vintage, 13 comorbidities (listed in Table 1), vascular access, blood flow rate, BMI, serum albumin, hemoglobin and five facility-level characteristics: percentage of patients in a facility with a catheter, with spKt/V <1.2, with albumin <3.5 g/dL and with phosphorus ≥5.5 mg/dL, and mean within-facility hemoglobin level; n = 8549 patients from 258 facilities (five facilities with less than or equal to five eligible patients excluded). CV, cardiovascular.
In a sensitivity analysis excluding 597 HDF patients for whom post-dilution could not be confirmed as the typical location used for replacement fluid by DOPPS MDS data (n = 218 pre-dilution, n = 93 mid or mixed dilution, n = 286 missing MDS data), we observed an adjusted all-cause mortality HR = 1.03 (95% CI 0.85–1.25) comparing HDF >20 L versus HD (adjusted as in Table 2, Model 5).
Nephrologists’ perception on clinical indications for HDF use
Based on responses to the 2014 DOPPS MDS, nephrologists indicated which patient characteristics they considered as ‘strong indications’ for HDF use (Table 4). Overall, the most common indications were dialysis-related amyloidosis (84% of medical directors), polyneuropathy (77%), hemodynamic instability (75%) and longer life expectancy (74%), but some differences were observed across countries; for instance, large patient size was a clinical indication for HDF in Spain (88% of medical directors) but not in Germany (8%).
Nephrologists’ perception on clinical indications for HDF usea
| Patient characteristic | All | Belgium | France | Germany | Italy | Spain | Sweden | UK |
|---|---|---|---|---|---|---|---|---|
| Dialysis-related amyloidosis (%) | 84 | 86 | 100 | 67 | 73 | 94 | 88 | 82 |
| Polyneuropathy (%) | 77 | 79 | 80 | 67 | 73 | 100 | 75 | 65 |
| Hemodynamic instability (%) | 75 | 57 | 100 | 50 | 82 | 88 | 81 | 76 |
| Longer life expectance (%) | 74 | 64 | 100 | 33 | 73 | 100 | 81 | 71 |
| Has been on dialysis 10 years (%) | 63 | 50 | 80 | 25 | 27 | 82 | 81 | 82 |
| Heart failure (%) | 58 | 50 | 60 | 42 | 64 | 82 | 56 | 47 |
| Has been on dialysis 5 years (%) | 58 | 50 | 80 | 17 | 27 | 71 | 69 | 82 |
| Worsening nutritional status (%) | 55 | 43 | 100 | 25 | 55 | 100 | 38 | 47 |
| Coronary artery disease (%) | 51 | 36 | 80 | 33 | 55 | 76 | 56 | 35 |
| Diabetes (%) | 51 | 36 | 80 | 25 | 64 | 76 | 50 | 41 |
| Large patient size (%) | 49 | 57 | 40 | 8 | 27 | 88 | 38 | 59 |
| Elderly (%) | 28 | 21 | 40 | 25 | 18 | 35 | 25 | 35 |
As reported by medical directors at DOPPS facilities in Phase 5 (2014) MDS; n = 92 medical directors surveyed: 14 in Belgium, 5 in France, 12 in Germany, 11 in Italy, 17 in Spain, 16 in Sweden and 17 in the UK; the proportion of medical directors in each country who indicated that the given patient characteristic was a ‘strong indication’ for HDF is reported.
DISCUSSION
The current study of a contemporary cohort of patients across seven countries found no evidence of a survival benefit with HDF, even at replacement fluid volumes >20 L (convection volumes above ∼22 L after accounting for ∼2 kg ultrafiltration). Our findings are in contrast to prior cohort studies that suggested better outcomes for HDF versus HD, including a prior analysis of DOPPS data [3–7].
In recent years, three RCTs tested the impact of HDF on mortality [8–10]. However, results of these studies were inconsistent, with only one study indicating a survival benefit [10] although with some methodological drawbacks [17]. Two meta-analyses [18, 19] of the same RCTs concluded that HDF resulted in lower mortality, especially among patients receiving the highest convection volume. One potential explanation for the discrepancy between results of the meta-analyses and those from the two RCTs included in the meta-analyses could be that the majority of patients in these two trials [8, 9] did not reach the target replacement fluid volume. In the ESHOL trial [10], the only study showing a positive effect of HDF on survival at primary analysis, patients were excluded after randomization if the pre-set 18 L volume of replacement fluid was not reached. Patients with better vascular access flow and intradialytic cardiovascular stability, who also tend to be generally healthier, would be more likely to achieve larger replacement fluid volumes, resulting in a potential selection bias [17].
Three other meta-analyses [20–22] have emphasized important methodological limitations of the RCTs. Peters et al. [18] showed better survival in the primary analysis; however, the secondary analyses considered achieved convection volumes and thus no longer followed the randomization protocol. As RCT data outside of the context of randomization are considered to reach only observational evidence levels with insufficient data on potential confounders, their conclusions should be interpreted with caution.
Along with these methodological limitations, the most plausible explanation for the discrepancies between our findings and those of the meta-analysis of Peters et al. [18] is the substantial difference in study populations due to stringent inclusion/exclusion criteria of the trials considered by Peters et al. [18]. Conversely, the DOPPS design [12, 13] results in samples of dialysis facilities and patients who are representative of practices as implemented in each country. Hence, results of this analysis may be more relevant to ‘real-world’ HD patients compared with those of clinical trials.
Our results are consistent with the Nistor et al. [20] meta-analysis and Siriopol et al. [5] study, which did not find any relation between high convection volumes and survival. Additionally, Buchanan et al. [23], using functional magnetic resonance imaging (fMRI), found no difference in cardiac wall motion abnormalities for HDF versus HD. In contrast to the secondary analyses of randomized trials [8, 9] and the Peters et al. [18] meta-analysis, we did not find any survival benefit from HDF even among patients with the highest convection volume. Patient selection for trial participation may have contributed to this discrepancy, since only ‘healthier’ patients (e.g. those with permanent vascular access, able to deliver higher blood flows) could reach the high convection volumes of HDF. The positive effect of higher convection volumes may not apply to an overall dialysis population such as the one assessed in the present study, since usually only healthier patients with good cardiovascular status are able to reach and tolerate the high convection volumes.
Physicians’ attitudes toward HDF use and its indications vary widely across countries, again reflecting the uncertainty surrounding the potential benefits of this technique. Along with complications from long time on dialysis (e.g. amyloidosis), longer life expectancy was one of the most common indications reported by medical directors, which suggests the possibility that HDF patients may be overall healthier compared with HD patients. This indication suggests an important patient selection and a potentially strong confounder that would favor better outcomes for HDF.
Our study has some strengths and weaknesses. Strengths include detailed data collection on potential confounders and causes of death. The variation in facility practice patterns allowed the facility percentage HDF use to be used as an exposure variable in secondary analyses, reducing treatment-by-indication bias. Compared with the previous DOPPS analysis [3], which showed seemingly conflicting results, the current study had a much larger sample size, a larger proportion of patients using high-volume HDF and a more contemporary cohort where the quality of HD care has improved. Therefore, the current study provides a more accurate representation of clinical practices in a contemporary care setting. One limitation of our study is that follow-up began at DOPPS entry rather than at initiation of HDF because information on the exposure prior to DOPPS entry was not available. Thus, patients for whom HDF was discontinued due to ineffectiveness or other reasons prior to DOPPS entry were misclassified as HD in the analysis. In addition, due to the observational nature of the DOPPS, it is possible that model adjustment failed to adequately account for selected confounders so that residual confounding may remain and affect our findings. However, because patients prescribed HDF tended to be slightly younger and healthier, each of these limitations would more likely bias results toward an HDF benefit. On the other hand, we were unable to account for intradialytic hemodynamic instability—an indication for HDF as shown in Table 4—in our models, which may result in bias in the opposite direction.
In conclusion, our analyses of current dialysis practices do not support the wide spread notion that HDF, especially with high convection volume, provides superior patient survival, hence supporting the equipoise of HDF and HD. Further trials specifically designed to test the effect of different convection volumes on clinical outcomes are needed in order to adequately inform clinical practices.
AUTHORS’ CONTRIBUTIONS
All authors were involved in: conception or design, or analysis and interpretation of data, or both; drafting the article or revising it; providing intellectual content of critical importance to the work described; and final approval of the version to be published.
FUNDING
The DOPPS Program is supported by Amgen, Kyowa Hakko Kirin and Baxter Healthcare. Additional support for specific projects and countries is provided by Amgen, AstraZeneca, European Renal Association-European Dialysis and Transplant Association (ERA-EDTA), German Society of Nephrology (DGfN), Hexal AG, Janssen, Japanese Society for Peritoneal Dialysis (JSPD), Keryx, Proteon, Relypsa, Roche, Società Italiana di Nefrologia (SIN), Spanish Society of Nephrology and Vifor Fresenius Medical Care Renal Pharma. Public funding and support is provided for specific DOPPS projects, ancillary studies or affiliated research projects by: Australia: National Health & Medical Research Council (NHMRC); Canada: Canadian Institutes of Health Research (CIHR) and Ontario Renal Network; France: Agence Nationale de la Recherche; Thailand: Thailand Research Foundation (TRF), Chulalongkorn University Matching Fund, King Chulalongkorn Memorial Hospital Matching Fund and the National Research Council of Thailand (NRCT); UK: National Institute for Health Research (NIHR) via the Comprehensive Clinical Research Network (CCRN); and USA: National Institutes of Health (NIH) and Patient-Centered Outcomes Research Institute (PCORI). All support is provided without restrictions on publications. FT is supported in part by NIDDK grant K01DK087762.
CONFLICT OF INTEREST STATEMENT
F.L. has received lecture fees from B. Braun and is a Member of the EUDIAL Group of ERA-EDTA. B.M.R. has received lecture fees from Kyowa Hakko Kirin. R.V. has received lecture fees from Fresenius Medical Care. S.H.J. has received lecture fees from Amgen. C.C. has received lecture fees from Fresenius. F.T. has received consulting fees from MedScape and is employed by Davita. W.K. is an employee of Davita Germany. All other authors have nothing to declare.
REFERENCES


Comments
Our results contradict a previous DOPPS analysis by Canaud et al. (2), which showed the all-cause mortality HR=0.65 for high-efficiency (>15L) HDF vs. HD. This study only used DOPPS phase 1 (1998-2001) data – not phases 1-3 as mentioned above by Canaud et al. – and the primary result was based on only 15 deaths in 97 patients on high-efficiency (>15L) HDF. The recent study by Locatelli et al. [1] analyzed 8567 patients (1988 deaths), including over 200 deaths in over 1000 patients on high-volume (>20L replacement) HDF, in a more contemporary cohort of DOPPS phase 4-5 (2009-2015) data. Changes in clinical care for both HDF and HD over the past 15 years justified our re-examination of this research question in the DOPPS. The larger and more contemporary sample in a “real world” experience is a strength rather than a limitation of our recent study.
We also note that the amount of convection in our study was not based on a questionnaire reflecting the opinions of medical directors, but rather on medical records reflecting the true prescribed convective volume. Having acknowledged limitations [1], our finding of an all-cause mortality hazard ratio (HR) of 1.14 (95% CI: 1.00-1.29) for HDF vs. HD and HR=1.08 (95% CI: 0.92-1.28) for high-volume HDF (>20L replacement or >22-23L convection volume) vs. HD, it is extremely unlikely that any differences between prescribed and delivered volumes would reverse the results to the extent that a clear HDF benefit would be observed. Our findings on mortality for high volume HDF versus HD are useful, in combination with mixed results from previous studies [3-8], for providing equipoise needed for future randomized clinical trials including the CONVINCE trial [9] led by Canaud and colleagues. Development of the CONVINCE trial is an implicit acknowledgement that the current body of evidence is inconclusive, and we look forward to the results evaluating the effect of high-volume HDF vs. HD on survival.
Authors: Francesco Locatelli1, Angelo Karaboyas2, Bruce M. Robinson2,3, Friedrich K. Port3,4
Affiliations:
1 Department of Nephrology and Dialysis, Alessandro Manzoni Hospital, ASST Lecco, Lecco, Italy
2 Arbor Research Collaborative for Health, Ann Arbor, MI, USA
3 Department of Internal Medicine, University of Michigan, Ann Arbor, MI, USA
4 Department of Epidemiology, University of Michigan, Ann Arbor, MI, USA
References:
1. Locatelli F, Karaboyas A, Pisoni RL, Robinson BM, Fort J, Vanholder R, Rayner HC, Kleophas W, Jacobson SH, Combe C, Port FK, Tentori F. Mortality risk in patients on hemodiafiltration versus hemodialysis: a 'real-world' comparison from the DOPPS. Nephrol Dial Transplant. 2017 Oct 11. doi: 10.1093/ndt/gfx277
2. Canaud B, Bragg-Gresham JL, Marshall MR, Desmeules S, Gillespie BW, Depner T, Klassen P, Port FK. Mortality risk for patients receiving hemodiafiltration versus hemodialysis: European results from the DOPPS. Kidney Int. 2006;69(11):2087-93
3. Locatelli, F., Mastrangelo, F., Redaelli, B., et al. Effects of different membranes and dialysis technologies on patient treatment tolerance and nutritional parameters. Kidney Int 1996, 50(4), 1293-1302
4. Ward, R. A., Schmidt, B., Hullin, J., et al. A comparison of on-line hemodiafiltration and high-flux hemodialysis: a prospective clinical study. J Am Soc Nephrol 2000, 11(12), 2344-2350
Locatelli, F., Altieri, P., Andrulli, S., et al. Hemofiltration and hemodiafiltration reduce intradialytic hypotension in ESRD. J Am Soc Nephrol 2010, ASN-2010030280
5. Grooteman, M. P., van den Dorpel, M. A., Bots, M. L., et al. Effect of online hemodiafiltration on all-cause mortality and cardiovascular outcomes. J Am Soc Nephrol 2012, ASN-2011121140
6. Maduell, F., Moreso, F., Pons, M., et al. High-efficiency postdilution online hemodiafiltration reduces all-cause mortality in hemodialysis patients. J Am Soc Nephrol 2013, 24(3), 487-497
7. Morena, M., Jaussent, A., Chalabi, L., et al. Treatment tolerance and patient-reported outcomes favor online hemodiafiltration compared to high-flux hemodialysis in the elderly. Kidney Int 2017, 91(6), 1495-1509
8. Ok, E., Asci, G., Toz, H., et al. Turkish Online Haemodiafiltration Study. Mortality and cardiovascular events in online haemodiafiltration (OL-HDF) compared with high-flux dialysis: results from the Turkish OL-HDF Study. Nephrol Dial Transpl 2013, 28(1), 192-202
9. The comparison of high-dose haemodiafiltration (HDF) with high-flux haemodialysis (HD) – CONVINCE. Horizon 2020 . https://ec.europa.eu/programmes/horizon2020/
Bernard Canaud, MD1,2, Sudhir Bowry, PhD3, Anke Winter, MD4
Title and Affiliation
1. CMS, Centre of Excellence Medical, FMC EMEA Deutschland, Bad Homburg
2. University of Montpellier, Montpellier-F
3. Scientific Value Creation, Fresenius Medical Care Deutschland, Bad Homburg-G
4. Director Epidemiologic Research, Fresenius Medical Care Deutschland, Bad Homburg-G
Address of correspondence
Professor Bernard Canaud
FMC EMEA Deutschland
Else Kröner Strass, 1
61352 Bad Homburg – Germany
Email : [email protected]
Dear Editor,
We read with interest the recently published DOPPS study by Locatelli et al. evaluating the mortality risk of patients on hemodiafiltration (HDF) compared to those patients treated with hemodialysis (HD). In contrast to prior observational studies including a study utilizing DOPPS data [ ] and interventional studies [ ], the results of the study do not suggest a survival benefit for patients receiving HDF [ ].
As the authors acknowledge, their study has a number of limitations due to its observational nature, the prevalent user design and the imputation for missing data. These limitations can bias the observed findings and indeed affect the overall conclusions drawn from the study [ ].
We wish to point out four additional methodological concerns that may have implications for the interpretation of the study findings and it’s translation into clinical practice. Firstly, the assessment of hemodiafiltration performance (i.e. substitution volume and/or ultrafiltration volume) is based on prescription data. Defining convective dose on the basis of a medical questionnaire reflecting prescription rather than the treatment delivery reduces the value of such a key indicator of performance [ ]. Considering the fact that the clinical and biological benefits of hemodiafiltration depend entirely on the effective convective dose delivered [ , ], it is difficult to consider that classification of substitution volume based merely on a dose prescribed abstracted from the medical questionnaire and not from an actual dose delivered has any value in providing reliable information for further analysis. In addition, by not specifying in the medical questionnaire the substitution mode (post-, pre- or mixed-dilution) or the exact treatment modality option (HDF, HF or ABF) drastically reduces the informative value of convective dose concept. The second point of concern relates to the fact that the effective time of exposure to different treatment modalities (HD or HDF) was not assessed. It is well known that switching between modalities (HD to HDF or vice versa) is frequently observed in about 50 to 60% of dialysis patients, an aspect that affects significantly patient outcomes as previously reported [ ]. The third one is the fact that the study was performed as intent-to-treat (ITT) analysis since the substitution volume was estimated at study baseline and never reassessed regularly to show that the prescription was maintained during follow-up. In other words, the initial estimated prescription remained unchanged over the entire study period as an indicator of convective dose without any time point check. Recognizing the large variability of HDF performance as reflected by the convective dose delivered in all reported studies, it is difficult from a clinical practice perspective to accept this assumption. The fourth issue relates to the study period: only phases 4 and 5 of DOPPS have been considered in the study of Locatelli et al [2], while the previous DOPPS analysis referring to phases 1 to 3 showed 35% reduction mortality in the high-volume HDF group [1]. This discrepancy is likely to reflect a selection of different population and different clinical practices.
To conclude, while we agree with the authors that further studies are required to ascertain the superiority of HDF over high-flux HD with optimal convective dosing, we wish to point out that this crucial concern will specifically be addressed in the randomized controlled multicenter CONVINCE Study starting in 2018. The study, supported by the EU (Horizon 2020 programme) is intended to enroll 1800 end stage kidney disease patients with two targets, the primary objective addressing outcomes and the secondary objective addressing patient perception [ ].
References
1. Canaud B, Bragg-Gresham JL, Marshall MR, Desmeules S, Gillespie BW, Depner T, Klassen P, Port FK. Mortality risk for patients receiving hemodiafiltration versus hemodialysis: European results from the DOPPS. Kidney Int. 2006;69(11):2087-93
2. Peters SA, Bots ML, Canaud B, Davenport A, Grooteman MP, Kircelli F, Locatelli F, Maduell F, Morena M, Nubé MJ, Ok E, Torres F, Woodward M, Blankestijn PJ; HDF Pooling Project Investigators. Haemodiafiltration and mortality in end-stage kidney disease patients: a pooled individual participant data analysis from four randomized controlled trials. Nephrol Dial Transplant. 2016;31(6):978-84.
3. Locatelli F, Karaboyas A, Pisoni RL, Robinson BM, Fort J, Vanholder R, Rayner HC, Kleophas W, Jacobson SH, Combe C, Port FK, Tentori F. Mortality risk in patients on hemodiafiltration versus hemodialysis: a 'real-world' comparison from the DOPPS. Nephrol Dial Transplant. 2017 Oct 11. doi: 10.1093/ndt/gfx277
4. Johnson ES, Bartman BA, Briesacher BA, Fleming NS, Gerhard T, Kornegay CJ, Nourjah P, Sauer B, Schumock GT, Sedrakyan A, Stürmer T, West SL, Schneeweiss S. The Incident User Design in Comparative Effectiveness Research. Effective Health Care Program Research Report No. 32. (Prepared under Contract No. HHSA290200500161). AHRQ Publication No. 11(12)-EHC054-EF. Rockville, MD: Agency for Healthcare Research and Quality. May 2012. http://effectivehealthcare.ahrq.gov/reports/final.cfm.
5. Tattersall JE, Ward RA; EUDIAL Group. Online haemodiafiltration: definition, dose quantification and safety revisited. Nephrol Dial Transplant. 2013;28(3):542-50.
6. Davenport A, Peters SA, Bots ML, Canaud B, Grooteman MP, Asci G, Locatelli F, Maduell F, Morena M, Nubé MJ, Ok E, Torres F, Woodward M, Blankestijn PJ; HDF Pooling Project Investigators. Higher convection volume exchange with online hemodiafiltration is associated with survival advantage for dialysis patients: the effect of adjustment for body size. Kidney Int. 2016;89(1):193-9.
7. Canaud B, Koehler K, Bowry S, Stuard S. What Is the Optimal Target Convective Volume in On-Line Hemodiafiltration Therapy? Contrib Nephrol. 2017;189:9-16.
8. Canaud B, Bayh I, Marcelli D, Ponce P, Merello JI, Gurevich K, Ladanyi E, Ok E, Imamovic G, Grassmann A, Scatizzi L, Gatti E. Improved survival of incident patients with high-volume haemodiafiltration: a propensity-matched cohort study with inverse probability of censoring weighting. Nephron. 2015;129(3):179-88.
9. The comparison of high-dose haemodiafiltration (HDF) with high-flux haemodialysis (HD) – CONVINCE. Horizon 2020 . https://ec.europa.eu/programmes/horizon2020/