


Abstract
Obesity is associated with albuminuria and incident kidney disease. Increased vulnerability of the glomerular microcirculation to elevated systemic blood pressure is postulated to contribute to adverse effects of obesity on the kidney. We therefore hypothesized that obesity would modulate the association between systolic blood pressure (sBP) and albuminuria.
The relationship between obesity and albuminuria [fractional albumin excretion (FEalb) or albumin:creatinine ratio (ACR)] was modelled using linear/logistic regression in the US National Health and Nutrition Examination Survey 1999–2010 cohorts (N = 23 710). Associations between sBP and albuminuria were examined across strata of waist circumference and body mass index (BMI) using interaction terms.
Obesity was associated with albuminuria through an interaction with sBP. Among participants in the 4th/5th quintiles of waist circumference each 10 mmHg increase in sBP was accompanied by approximately double the increment in FEalb observed among those in quintile 2 (14% versus 7%, P < 0.001). There was also evidence of a lower sBP threshold for the relationship between sBP and albuminuria in obesity. While FEalb increased with sBP >110 mmHg in quintile 5 of waist circumference, in quintile 2 FEalb did not increase until sBP was >130 mmHg. Findings were consistent when defining obesity by BMI or waist circumference and when quantifying albuminuria by ACR or FEalb. Assessing albuminuria as the odds ratio of ACR >30 mg/g also gave similar results.
The interaction between sBP and obesity supports the premise that obesity sensitizes the kidney to increased systemic blood pressure.
INTRODUCTION
Obesity is an independent predictor of incident chronic kidney disease (CKD) [1–3] and end-stage renal disease [4, 5]. Intrarenal haemodynamic effects of obesity may contribute to this phenomenon; severe obesity is accompanied by glomerular hyperfiltration, reversible after successful bariatric surgery [6], while filtration fraction increases with body mass index (BMI) even in non-obese subjects [7]. These observations are consistent with renal afferent arteriolar vasodilation and/or efferent vasoconstriction, potentially placing the glomerular microcirculation at greater risk of injury from elevated systemic arterial pressure [8].
Albuminuria is a feature of glomerular hypertension and hypertensive renal target organ damage [9, 10]. In keeping with its postulated haemodynamic effects, obesity has been associated with elevated urine albumin excretion in several cohorts [11–13]. Furthermore, the heavy proteinuria and focal segmental glomerulosclerosis of obesity-related glomerulopathy are reminiscent of features attributed to glomerular hypertension in the setting of reduced nephron mass [14, 15]. If obesity sensitizes the kidney to hypertensive injury this effect could be an important contributor to CKD incidence/progression. We hypothesized that a given systolic blood pressure (sBP) increment would be associated with a greater increase in albuminuria in the presence of obesity. We tested this in a representative sample of the US population: the National Health and Nutrition Examination Survey (NHANES) 1999–2010.
MATERIALS AND METHODS
Study population
The US NHANES uses a multistage sampling strategy to generate a study population representative of the non-institutionalized US population [16]. For this analysis, non-pregnant participants aged >20 years with complete clinical and biochemical data were included from the NHANES cycles 1999–2010. Comorbidities and demographic variables were defined as described previously [17].
Measures of obesity
Although BMI is a well-established measure of body habitus, waist circumference provides a better assessment of obesity-associated health risks [18, 19]. Central body fat distribution has also been reported to be associated with unfavourable renal haemodynamics independently of BMI [20]. Therefore, waist circumference, categorized into gender-specific quintiles, was used as the primary measure of obesity in this study. As a second method of obesity assessment, BMI (weight/height2) was classified according to the World Health Organization definitions [21] of underweight (BMI <18.5 kg/m2), normal (18.5 ≤ BMI < 25), overweight (25 ≤ BMI < 30), class I obesity (30 ≤ BMI < 35), class II obesity (35 ≤ BMI < 40) and class III obesity (BMI ≥40).
Quantification of albumin leak
Albuminuria is quantified in NHANES as the albumin:creatinine ratio (ACR) in a clean-catch random spot urine sample. A potential confounding factor in this assessment is the greater creatinine excretion rate observed in obesity [22]. Another consideration is the fact that hyperfiltration associated with obesity may drive increased albumin efflux purely by convection in the absence of changes in glomerular pressure or permeability [17], [23]. Therefore, urinary albumin excretion was assessed herein primarily as the fractional excretion of albumin relative to creatinine (FEalb), calculated as: (urine albumin concentration × serum creatinine concentration)/(urine creatinine concentration × serum albumin concentration). This is a measure of total renal albumin permeability [17] that is not confounded by the creatinine excretion rate. ACR was used as a secondary assessment in continuous analyses and to categorize according to the established threshold of moderately increased albuminuria (ACR ≥30 mg/g) [24].
Blood pressure
Blood pressure was measured in a sitting position using a mercury sphygmomanometer after 5 min quiet resting. Three pairs of systolic/diastolic BP measurements were taken and a fourth attempted if one or more were unsuccessful. The average of the readings was calculated, with exclusion of the first successful reading. Where only one reading was successful, this was taken as the average. The postulated interaction between obesity and BP was examined in terms of the sBP since this component is the major determinant of renal target organ damage and is mostly consistently associated with albumin leak [17].
Statistical analyses
This report is a cross-sectional analysis of data collected at single time points from participants in successive NHANES cycles. Statistical analyses were performed using SAS version 9.3 (SAS Institute, Cary, NC, USA) with incorporation of participant sample weights [25]. Taylor series linearization was used for estimation of standard errors, accounting for the multistage sampling design. Characteristics of the US population represented by NHANES participants were compared across strata of obesity by linear and logistic regression for means and proportions, respectively. Log-transformation was applied to ACR and FEalb (both positively skewed) prior to parametric analyses.
Associations between obesity and measures of albumin leak were examined by univariate linear regression. Adjustment was then performed a priori for relevant covariates: age, sex, race, sBP and diastolic BP, diabetes mellitus, estimated glomerular filtration rate (eGFR), smoking status, C-reactive protein (CRP), number of antihypertensives, use of angiotensin-converting enzyme inhibitors (ACEi), use of angiotensin receptor blockers (ARB), use of renin inhibitors and history of cardiovascular disease. We previously reported that 2-slope linear regression best captured the relationship between BP and log-transformed albumin leak in this population [17], so the same approach was adopted here, with inflection points at 110 mmHg and 70 mmHg for sBP and diastolic BP, respectively. Interaction terms for diabetes × sBP and eGFR category × sBP were included because there were known to be significant interactions between these variables [17]. To determine whether obesity alters the relationship between sBP and albumin leak, an interaction term for waist circumference quintile × sBP (or BMI category × sBP) was entered into the model, retaining waist circumference quintile (or BMI category) as a separate variable. Interactions with sBP were modelled specifically at ≥110 mmHg using the 2-slope regression model.
To investigate whether obesity lowers the sBP threshold from which BP increments are associated with albuminuria, associations were examined for categories of obesity across 10 mmHg sBP intervals. Odds ratios of moderately increased albuminuria (ACR ≥30 mg/g) were also calculated for quintiles of waist circumference or categories of BMI, adjusting for other covariates as above.
RESULTS
Population characteristics
Characteristics of the US population represented by the NHANES 1999–2010 participants are presented by quintiles of waist circumference in Table 1. Overall, 51.5% and 32.5% were classified as obese by waist circumference (>88 cm in women and >102 cm in men [26]) and BMI (≥30 kg/m2) criteria, respectively. Increasing waist circumference was associated with higher sBP, diastolic BP, pulse pressure and CRP, greater prevalence of diabetes, eGFR <60 mL/min/1.73 m2, antihypertensive use and cardiovascular disease, but a lower prevalence of smoking. The same pattern of associations was observed when participants were compared across categories of BMI (Supplementary data, Table S1 ).
Characteristics of the US population represented by NHANES 1999–2010 participants, by waist circumference quintile (N = 23 710)
| Waist circumference quintile | |||||
|---|---|---|---|---|---|
| Men; cutpoints at 88.0 cm, 95.9 cm, 102.7 cm and 111.8 cm | |||||
| Women; cutpoints at 79.8 cm, 88.0 cm, 96.4 cm and 107.1 cm | |||||
| Variable | 1 | 2 (reference) | 3 | 4 | 5 |
| Sample, n | 4162 | 4534 | 4880 | 5117 | 5017 |
| Age, years | 38.6 (0.3)**** | 44.5 (0.3) | 48.4 (0.3)**** | 50.8 (0.3)**** | 50.4 (0.3)**** |
| Race, % | |||||
| White | 69.7 (1.3) | 71.7 (1.3) | 72.3 (1.5) | 75.0 (1.6)*** | 75.1 (1.4)*** |
| Black | 10.9 (0.7)*** | 8.2 (0.6) | 8.9 (0.7) | 9.3 (0.7)** | 12.2 (0.9)**** |
| Hispanic | 11.9 (0.9)* | 14.1 (1.0) | 14.3 (1.2) | 12.9 (1.3)**** | 9.5 (1.0)**** |
| Other | 7.5 (0.6)**** | 6.0 (0.6) | 4.5 (0.5) | 2.8 (0.3)**** | 3.3 (0.4)*** |
| Systolic BP, mmHg | 115.5 (0.4)**** | 119.2 (0.3) | 122.9 (0.4)**** | 125.3 (0.3)**** | 126.3 (0.4)**** |
| Diastolic BP, mmHg | 68.7 (0.3)**** | 70.4 (0.2) | 71.9 (0.2)**** | 72.5 (0.3)**** | 73.2 (0.3)**** |
| Pulse pressure, mmHg | 46.8 (0.3)**** | 48.8 (0.3) | 51.1 (0.4)**** | 52.8 (0.3)**** | 53.2 (0.3)**** |
| eGFR, mL/min/1.73 m2 a | 101.0 (0.5)**** | 95.5 (0.4) | 92.0 (0.5)**** | 90.3 (0.5)**** | 90.8 (0.4)**** |
| eGFR <60 mL/min/1.73 m2, % | 2.4 (0.2)**** | 4.5 (0.4) | 7.2 (0.4)**** | 8.0 (0.4)**** | 8.4 (0.4)**** |
| ACR ≥30 mg/g, % | 6.8 (0.5)*** | 5.8 (0.4) | 7.9 (0.5) | 9.6 (0.5)*** | 13.1 (6.2)**** |
| ACR, mg/ga | 6.9 (6.8, 7.2)** | 6.6 (6.4, 6.7) | 7.3 (7.1, 7.5)**** | 7.8 (7.6, 8.0)**** | 9.3 (9.0, 9.6)**** |
| FEalb, ×10−7 a | 13.3 (12.9, 13.7) | 12.9 (12.6, 13.3) | 14.8 (14.3, 15.2)**** | 16.0 (15.5, 16.5)**** | 19.6 (18.9, 20.3)**** |
| Diabetes, % | 2.0 (0.3)**** | 3.4 (0.3) | 5.5 (0.4) | 8.8 (0.5)**** | 17.3 (0.6)**** |
| Smoker, % | 36.6 (1.2)**** | 29.3 (0.9) | 27.2 (0.9)* | 26.4 (0.9)**** | 25.4 (0.9)**** |
| CVD, % | 2.2 (0.2)**** | 4.0 (0.4) | 5.2 (0.4) | 8.2 (0.4)**** | 9.0 (0.5)**** |
| CRP, mg/dL | 0.20 (0.01)**** | 0.28 (0.01) | 0.38 (0.01)**** | 0.43 (0.01)**** | 0.69 (0.02)**** |
| Antihypertensive use, % | 6.9 (0.5)**** | 13.9 (0.6) | 21.5 (0.7)* | 31 (0.9)**** | 42.1 (0.9)**** |
Data presented as mean (SE) and % (SE) unless otherwise indicated. (Note different numbers in each category because quintiles defined incorporating sampling weight.) CVD, cardiovascular disease.
Geometric mean (95% confidence interval); positively skewed and log-transformed for linear regression.
P < 0.05, **P < 0.01, ***P < 0.005, ****P < 0.001, compared to quintile 2.
Associations between measures of obesity and renal albumin leak
In univariate analyses, FEalb, ACR and the prevalence of ACR ≥30 mg/g were lowest in quintile 2 of waist circumference (88.0–95.9 cm in men and 79.8–88.0 cm in women, Tables 1 and 2); this and ‘normal’ BMI (18.5 ≤ BMI < 25 kg/m2) served as reference categories. Compared with these reference groups, increasing waist circumference (>95.9 cm in men, >88 cm in women) and obese categories of BMI (≥30 kg/m2) were associated with a statistically significant, progressively greater log-transformed FEalb and ACR (Table 2 and Supplementary data, Table S2). When adjusted for relevant covariates only quintile 5 of waist circumference and the most severely obese BMI category (>40 kg/m2) remained positively associated with FEalb and ACR. The underweight BMI category and quintile 1 of waist circumference were both associated with greater FEalb and ACR in multivariate adjusted analyses. Quantifying albumin leak in terms of the odds ratios of moderately increased ACR (>30 mg/g) also gave covariate-adjusted associations that were evident for both extremes of body habitus (shown for waist circumference in Figure 1A).
Associations between measures of obesity and FEalb
| Associated fold-change (95% confidence interval) in FEalb | ||||
|---|---|---|---|---|
| Standard models | Multivariate interaction modelb | |||
| Waist circumference model | Univariate | Multivariatea | Single termf (main effects) | Interaction with BPg (increment per 10 mmHg)c |
| Systolic BP (10 mmHg)c | – | 1.09 (1.07, 1.12) P < 0.001 | 1.07 (1.04, 1.10) P < 0.001 | – |
| Waist quintiled | ||||
| Quintile 1 | 1.03 (0.99, 1.08) P = 0.18 | 1.13 (1.08, 1.18) P < 0.001 | 1.11 (1.06, 1.17) P < 0.001 | 1.01 (0.98, 1.04) P = 0.63 |
| Quintile 3 | 1.14 (1.09, 1.20) P < 0.001 | 1.03 (0.99, 1.07) P = 0.14 | 1.02 (0.97, 1.07) P = 0.48 | 1.01 (0.98, 1.04) P = 0.39 |
| Quintile 4 | 1.24 (1.18, 1.29) P < 0.001 | 1.02 (0.98, 1.06) P = 0.34 | 0.98 (0.92, 1.03) P = 0.38 | 1.03 (1.00, 1.07) P = 0.028 |
| Quintile 5 | 1.51 (1.44, 1.59) P < 0.001 | 1.13 (1.08, 1.18) P < 0.001 | 1.02 (0.96, 1.09) P = 0.50 | 1.07 (1.03, 1.10) P < 0.001 |
| BMI modele | ||||
| Systolic BP (10 mmHg)c | – | 1.09 (1.07, 1.12) P < 0.001 | 1.07 (1.04, 1.10) P < 0.001 | |
| BMI categories | ||||
| BMI <18.5 | 1.45 (1.29, 1.64) P < 0.001 | 1.54 (1.38, 1.73) P < 0.001 | 1.58 (1.38, 1.80) P < 0.001 | 0.97 (0.92, 1.03) P = 0.31 |
| 25 ≤ BMI < 30 | 1.00 (0.97, 1.04) P = 0.81 | 0.91 (0.88, 0.94) P < 0.001 | 0.89 (0.86, 0.93) P < 0.001 | 1.02 (0.99, 1.04) P = 0.19 |
| 30 ≤ BMI < 35 | 1.13 (1.08, 1.18) P < 0.001 | 0.95 (0.91, 0.99) P = 0.014 | 0.92 (0.87, 0.97) P = 0.004 | 1.03 (0.99, 1.06) P = 0.11 |
| 35 ≤ BMI < 40 | 1.28 (1.20, 1.37) P < 0.001 | 1.01 (0.95, 1.08) P = 0.71 | 0.90 (0.83, 0.98) P = 0.01 | 1.08 (1.03, 1.13) P = 0.001 |
| BMI ≥40 | 1.57 (1.42, 1.72) P < 0.001 | 1.15 (1.05, 1.26) P = 0.002 | 1.02 (0.91, 1.15) P = 0.72 | 1.08 (1.01, 1.15) P = 0.023 |
Adjusted for: systolic and diastolic BP (2-slope model), age, gender, race, diabetes, eGFR, history of cardiovascular disease, smoking, number of antihypertensives, use of ACEi, use of ARB, use of renin antagonists, interaction terms for systolic BP × eGFR category and systolic BP × diabetes status.
As for multivariate standard model, but with the addition of interaction terms for waist circumference × systolic BP or BMI × systolic BP.
At systolic BP > 110 mmHg.
Relative to quintile 2.
Relative to 18.5 ≤ BMI < 25 kg/m2.
The effect of an increment in systolic BP or the indicated obesity category per se.
The additional effect of a 10 mmHg increment in systolic BP within each obesity category.
![Odds ratios of moderately increased albuminuria by waist circumference quintile (A) in the whole cohort, and (B) within subpopulations with systolic BP ≥/<110 mmHg. Adjusted for age, gender, race, diabetes, history of cardiovascular disease, smoking, number of antihypertensives, use of ACEi, use of ARB, use of renin inhibitors, CRP, diastolic BP, sBP [(A) only], and interaction terms for sBP with eGFR and diabetes. ref, referent group; WC, waist circumference. Error bars represent 95% confidence intervals.](https://oup.silverchair-cdn.com/oup/backfile/Content_public/Journal/ndt/33/4/10.1093_ndt_gfx081/1/m_gfx081f1.jpeg?Expires=1750335848&Signature=Rb79DnZhxPju8dPt0FLapVyGKtj0Sq4KTDSDP~UDRBeWx7W5~BGPifgoqSy~jxllSEnhpEgHJUrtEfqYfa2W7ZiGCiKKzIMJOA1zKCWuU75UGSWz2erWvgn-MaOtA6hJ8xhvV~DOTIBgmFIbqrbRbf29qJYWMv0QsPigYyTo1onxDVdKMjWKWGgjvhkTmZooo7X6zKuFZFgduk~8Kq81r0sR7kHl0OJafZ66BpNhoZe2PNYWrCzgf0U1qXFHQcxYW2at2ERAIkJwL7gdiq3Lna51BJ2hqTIE7gEXvc2chsshLqTEirxU4S-z~RSHbAAlO4CxnltBDBo~-VjVKodgLQ__&Key-Pair-Id=APKAIE5G5CRDK6RD3PGA)
Odds ratios of moderately increased albuminuria by waist circumference quintile (A) in the whole cohort, and (B) within subpopulations with systolic BP ≥/<110 mmHg. Adjusted for age, gender, race, diabetes, history of cardiovascular disease, smoking, number of antihypertensives, use of ACEi, use of ARB, use of renin inhibitors, CRP, diastolic BP, sBP [(A) only], and interaction terms for sBP with eGFR and diabetes. ref, referent group; WC, waist circumference. Error bars represent 95% confidence intervals.
Interaction between sBP and obesity
We previously reported that FEalb and ACR increase exponentially with sBP from a threshold of 110 mmHg in this cohort [17]. Therefore, to determine whether sBP plays a role in the association between obesity and albumin leak, the above analyses were repeated stratified by sBP <110 mmHg (n = 5564) and ≥110 mmHg (n = 18 146). The association between obesity and urine albumin leak was confined to patients with sBP ≥110 mmHg (shown for ACR >30 mg/g in Figure 1B).
To test formally whether sBP has a different relationship with albuminuria in the presence of obesity, interaction terms for waist circumference quintile × sBP and BMI category × sBP were entered in the respective regression models for the whole cohort. When these terms were introduced, the association between obesity and albuminuria in isolation was neutralized, being absorbed by the varying effect of sBP across obesity groups (Table 2 and Supplementary data, Table S2 ). Significant interactions between obesity and sBP were evident for waist circumference quintiles 4/5 and at BMI ≥35 kg/m2. Thus, a given sBP increment was associated with a greater increase in renal albumin leak at this level of obesity than for quintile 2 and normal BMI respectively.
The interaction between obesity and sBP was independent of the previously reported interaction between diabetes and sBP. To exclude residual confounding from diabetes or antihypertensive use, the regression analyses were repeated with exclusion of diabetic participants or those taking antihypertensives; the findings were unchanged. Since undiagnosed diabetes might be another confounding factor, the analyses were repeated replacing quintile of glycated haemoglobin for diabetes status and with an interaction term for glycated haemoglobin quintile × sBP; this also did not change the findings. Progressively greater percentage increases in albuminuria per 10 mmHg increase in sBP with increasing obesity or diabetes are shown in Table 3 and Supplementary data, Figure S1.
Percentage increases in fractional excretion of albumin and ACR with each 10 mmHg increment in sBP at >110 mmHg, stratified by obesity group and diabetes status
| Waist circumference quintile | BMI (kg/m2) | ||||||||||
|---|---|---|---|---|---|---|---|---|---|---|---|
| With diabetes mellitus | |||||||||||
| FEalb, % | 8 | 7 | 8 | 10* | 14** | 4 | 7 | 9 | 10 | 16*** | 15**** |
| ACR, % | 8 | 8 | 9 | 11* | 15** | 5 | 8 | 10 | 11 | 17*** | 16**** |
| With diabetes mellitus***** | |||||||||||
| FEalb, % | 17 | 16 | 18 | 20* | 24** | 13 | 16 | 18 | 19 | 26*** | 25**** |
| ACR, % | 17 | 17 | 18 | 20* | 24** | 13 | 17 | 19 | 20 | 26*** | 26**** |
Results from regression models with interaction terms for sBP × obesity category and sBP × diabetes status. Also adjusted for: systolic and diastolic BP (2-slope model), age, gender, race, diabetes, eGFR, history of cardiovascular disease, smoking, number of antihypertensives, use of ACEi, use of ARB, use of renin antagonists and an interaction term for sBP × eGFR category.
P < 0.05 versus quintile 2, **P < 0.001 versus quintile 2, ***P < 0.005 versus 18.5 ≤ BMI < 25, ****P < 0.05 versus 18.5 ≤ BMI < 25, *****P < 0.05 versus respective non-diabetic categories.
In contrast to the interaction between sBP and obesity, there was no significant interaction with underweight (BMI <18.5 kg/m2 and waist circumference quintile 1). Including the interaction terms thus had little effect on the association of underweight with albuminuria.
Having demonstrated an interaction between obesity and sBP, we next assessed whether obesity lowers the threshold at which increasing sBP is associated with greater albumin excretion. To this end, covariate-adjusted albumin leak was examined across categories of sBP and obesity. For quintile 5 of waist circumference and BMI >35 kg/m2, a progressive increase in albumin leak accompanied increments in sBP from 110 mmHg. However, for the rest of the population albuminuria did not increase until sBP was >130 mmHg (shown for reference categories and severely obese populations in Figure 2A and B). Conclusions were similar when albuminuria was assessed as the odds ratio of ACR ≥30 mg/g (Supplementary data, Figure S2). In light of this difference in thresholds the piecewise regression models were refined, with inflection points at 110 mmHg for quintile 5 of waist circumference and BMI >35 kg/m2, but at 130 mmHg for less obese categories. This improved the performance (R2 and RMSE) of each model. The outputs of the final models are shown in Figure 2C and D. Besides the left shift of the sBP threshold associated with increasing albuminuria, model conclusions were as above; no association between obesity and albuminuria per se (the same Y-intercept for all obesity categories), but a steeper relationship between sBP and albuminuria in the presence of obesity. The overall increase in albuminuria associated with sBP over the 110–180 mmHg range was approximately double in the presence of obesity.
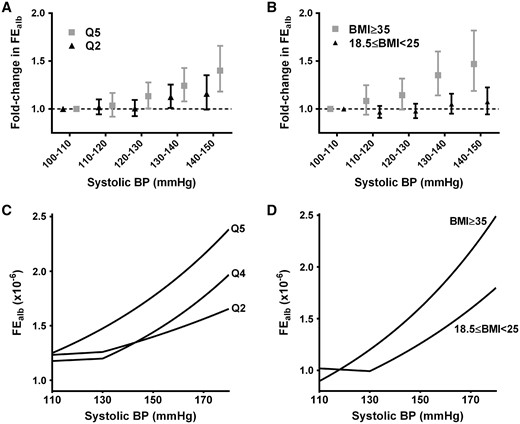
Effects of obesity on the threshold from which increasing systolic BP is accompanied by increasing albumin excretion. In the 5th quintile of waist circumference (A) or at a BMI ≥35 kg/m2 (B), FEalb increases with systolic BP >10 mmHg, whereas for less obese populations (shown for the respective reference categories) there is no increase until systolic BP is >130 mmHg. The 2-slope regression models for systolic BP were therefore refined, with inflection points at 110 mmHg for quintile 5 of waist circumference and BMI ≥35 kg/m2, but at 130 mmHg for all other categories. Outputs of the resulting regression models are shown (C and D), adjusted for age, gender, race, diabetes, diastolic BP, history of cardiovascular disease, smoking, number of antihypertensives, use of ACEi, use of ARB, use of renin inhibitors, CRP and interaction terms for sBP with eGFR and diabetes.
DISCUSSION
Obesity and hypertension are epidemics of the 21st century and contributors to the increasing global burden of CKD [27, 28]. We find that in severe obesity a given increment in sBP is associated with approximately double the increase in urinary albumin excretion observed in lean subjects. Obesity and hypertension thus may contribute synergistically to CKD. These findings are consistent with a previous small case–control study reporting a steeper relationship between sBP and urinary albumin excretion rate in overweight/obesity versus normal BMI [29]. We find a significant interaction is evident in the top 2 quintiles of waist circumference, i.e. affecting 40% of the US adult population.
While our observational data do not prove a causative relationship between the obesity–sBP interaction and urine albumin leak, they are in keeping with BP-sensitizing effects of obesity on the kidney. Postulated underlying mechanisms include impaired renal afferent arteriolar autoregulation [8], efferent arteriolar vasoconstriction [19], a greater glomerular capillary radius (translating hydrostatic pressure to higher wall stress) [8] and a reduced density of supporting podocytes [30]. An association between obesity and albuminuria has been reported previously [11–13] and a number of non-haemodynamic mechanisms of obesity-induced kidney injury have been proposed [19, 27]. However, adjusting for the sBP–obesity interaction in this NHANES analysis completely abolished the association between obesity per se and albuminuria. This observation suggests haemodynamic mechanisms are key to the obesity–albuminuria relationship. It is also consistent with animal data reporting that hypertension is needed for the nephrotoxic consequences of obesity [31].
Other recent publications have emphasized a requirement for metabolic comorbidities in mediating the obesity-associated risk of hypertension [32] and CKD. In the absence of metabolic comorbidities (elevated triglycerides, low high-density lipoprotein cholesterol, hypertension or impaired glucose tolerance), higher BMI was actually associated with a lower risk of end-stage renal disease (ESRD) [33] and no increase in the risk of incident CKD [34]. These findings support the concept of ‘metabolically healthy obesity’ and contrast with previous reports that obesity is a predictor of ESRD and CKD even in analyses adjusted for other metabolic factors [1, 2, 4]. Synergistic interactions between obesity and other risk factors, such as we describe for sBP, would explain this apparent discrepancy.
Given the increased risk of adverse renal outcomes associated with even small increments in albumin excretion rate [35], a causal role for the obesity–sBP interaction in increasing albuminuria could have important implications for CKD prevention/management. In this respect, our findings are consistent with observations from the Hunt 1 cohort, where there was a synergistic interaction between increasing BMI and BP in the prediction of ESRD and CKD-associated death [5]. Furthermore, prehypertension (BP 120–139/80–89) only predicted an increased risk of these outcomes in the presence of obesity, suggesting obesity had a BP-sensitizing effect [5].
Current guidelines do not advocate lower BP targets in obesity [10]. Post-hoc analyses of antihypertensive trials might shed light on whether obese participants gain particular nephroprotective benefit from antihypertensive therapy or a lower sBP target. Targeting glomerular capillary hydrostatic pressure through preferential use of renin-angiotensin system inhibitors in hypertensive obese patients also might be helpful. Indeed, a post-hoc analysis of the REIN study reported greater antiproteinuric effects and attenuation of CKD progression by ramipril in overweight and obese participants [36]. However, the optimal nephroprotective approach to BP management in obese patients would ideally be defined by prospective interventional studies conducted specifically in this population.
A j-shaped association between BMI and proteinuria has been reported previously [37, 38] and was also evident in this NHANES cohort. Whereas the association between obesity and albuminuria was abolished by adjustment for covariates and the sBP interaction, that between low BMI (or waist circumference) and albumin leak was not. The underlying explanation for this association is unclear. Unmeasured comorbidity and inflammation may be responsible, though CRP was in fact lowest in the underweight BMI category.
In conclusion, our demonstration of an interaction between obesity and sBP in their associations with albuminuria suggests the two pathologies may synergize to contribute to CKD. Advising obese hypertensive patients to engage with weight loss programmes is already recommended on the grounds that this can improve BP control and metabolic profile [10]. Our findings raise the possibilities that weight loss might also reduce vulnerability to hypertensive injury and that nephroprotective benefits of BP control may be greater in obesity.
SUPPLEMENTARY DATA
Supplementary data are available online at http://ndt.oxfordjournals.org.
ACKNOWLEDGEMENTS
The authors thank the NHANES participants, staff and investigators.
CONFLICT OF INTEREST STATEMENT
All authors have no conflicts of interest to declare. The results presented in this article have not been published previously in whole or part.
REFERENCES


Comments