


Abstract
Background. Chronic kidney disease (CKD) progression is currently assessed by a decline in estimated glomerular filtration rate (eGFR) and/or an increase in urinary albumin excretion (UAE). However, these markers are considered either to be late-stage markers or to have low sensitivity or specificity. In this study, we investigated the performance of the urinary proteome-based classifier CKD273, compared with UAE, in a number of different narrow ranges of CKD severity, with each range separated by an eGFR of 10 mL/min/1.73 m2.
Methods. A total of 2672 patients with different CKD stages were included in the study. Of these, 394 individuals displayed a decline in eGFR of >5 mL/min/1.73 m2/year (progressors) and the remaining individuals were considered non-progressors. For all samples, UAE values and CKD273 classification scores were obtained. To assess UAE values and CKD273 scores at different disease stages, the cohort was divided according to baseline eGFRs of ≥80, 70–79, 60–69, 50–59, 40–49, 30–39 and <29 mL/min/1.73 m2. In addition, areas under the curve for CKD273 and UAE were calculated.
Results. In early stage CKD, the urinary proteome-based classifier performed significantly better than UAE in detecting progressors. In contrast, UAE performed better in patients with late-stage CKD. No significant difference in performance was found between CKD273 and UAE in patients with moderately reduced renal function.
Conclusions. These results suggest that urinary peptides, as combined in the CKD273 classifier, allow the detection of progressive CKD at early stages, a point where therapeutic intervention is more likely to be effective. However, late-stage disease, where irreversible damage of the kidney is already present, is better detected by UAE.
INTRODUCTION
Chronic kidney disease (CKD), defined as reduced kidney function and/or evidence of kidney damage, is a major public health problem throughout the world. Early identification and management of CKD are more cost effective than the current approach and can reduce the risk of kidney failure progression and cardiovascular disease by up to 50% [1]. Therefore, timely (early) recognition of kidney damage and impaired kidney function, which is often asymptomatic, is a key goal in improving health outcomes of the global population. The diagnosis of CKD is currently obtained by the detection of a reduction in the estimated glomerular filtration rate (eGFR) and/or an increase in albuminuria as indicators of renal dysfunction [2]. However, the eGFR has limited value in predicting the risk of CKD progression, unless substantially reduced. Instead of (or together with) the eGFR, albuminuria is often used, even though, in a significant number of patients, renal disease progresses despite the absence of albuminuria [3]. Thus, the clinical necessity of an accurate test that complements current approaches in predicting CKD progression and that consequently facilitates clinical decision-making remains incompletely addressed [4].
The development of urinary biomarkers, in particular those provided by proteomic approaches, for predicting CKD progression has gained increasing interest [5]. To account for the substantial heterogeneity of CKD, the application of multiparametric classifiers has been advocated [6]. Recently, a capillary electrophoresis–mass spectrometry (CE-MS)-based urinary peptide classifier, the CKD273 classifier, was developed by comparing 230 patients suffering from CKD (resulting from various aetiologies) with 379 healthy individuals [7]. This comparison led to the identification of 273 urinary peptides that differed significantly between CKD patients and controls. Using a support vector machine (SVM) algorithm, these 273 peptides were integrated into a single classifier. To date, and to the best of our knowledge, this is the only proteomics-based classifier of which the diagnostic utility has been validated in multiple separate study populations, including case–control [7–10] and longitudinal [10–14] investigations. Therefore, upon applying the Oxford Evidence-Based Medicine (EBM) and Strength of Recommendation Taxonomy (SORT) guidelines, we obtained promising evidence that supports the CKD273 classifier's utility in predicting CKD progression [15]. However, the applicability of CKD273, compared with albuminuria, in each baseline eGFR stratum is as yet undetermined. Hence, in this study, we assessed the utility of CKD273 versus albuminuria in defining the prognosis of CKD at different initial eGFR values, in an attempt to obtain more refined guidance to allow timely preventive management of the progression of CKD. This information is of increased relevance in light of a recent study that demonstrated early renin-angiotensin system intervention is more beneficial in delaying end-stage renal disease (ESRD) than intervention at a later stage [16].
MATERIALS AND METHODS
Patient data
We extracted all CKD patient data from the Human Urinary Proteome database [17–19]. Data from CKD patients with a follow-up duration of <1 year were excluded. In total, the cohort consisted of 2672 patients from previous studies [9, 12–14, 20–25]. Stages of CKD were defined on the basis of the eGFR, using the Chronic Kidney Disease Epidemiology Collaboration (CKD-EPI) formula. Baseline data of the patients are summarized in Table 1. More than 75% of the patients suffered from diabetes mellitus (n = 2044), while other patients had hypertension (n = 280), membranous glomerulonephritis (n = 3), minimal change disease (n = 1), IgA nephropathy (n = 1) and unknown CKD (n = 30) or were healthy individuals (n = 313). The study was conducted to conform to regulations on the protection of individuals participating in medical research and in accordance with the principles of the Declaration of Helsinki. All data sets received were anonymized. The study was approved by the local ethics committee (no. 3116-2016).
Baseline characteristics
| Characteristic | |
| Number of subjects | 2672 |
| Women, n (%) | 1216 (45.5) |
| Diabetes mellitus, n (%) | 2039 (77.4)a |
| Mean ± SD of characteristic | |
| Age, years | 49.7 ± 15.7 |
| Systolic pressure, mmHg | 128.3 ± 15.4a |
| Diastolic pressure, mmHg | 76.6 ± 8.5a |
| Serum creatinine, μmol/L | 102.6 ± 40.2 |
| eGFR (CKD-EPI), mL/min/1.73 m² | 72.4 ± 21.0 |
| Urinary albumin excretion, mg/24 h | 195.2 ± 627.9 |
| CKD273 | −0.210 ± 0.533 |
| Follow-up time, years | 3.3 ± 1.1 |
aThese data were calculated based on 2642 patients.
CE-MS data and CKD273 classifier analysis
Sample collection and analysis of urine samples using CE-MS were as described in previous studies [12, 13, 21–24]. For normalization caused by analytical variances and differences in urine dilution, MS signal intensities were normalized relative to 29 internal standard peptides generally present in at least 90% of all urine samples, with small relative standard deviation (SD) [26]. For calibration, a linear regression was performed. The peak lists obtained characterized each peptide by its molecular mass (in daltons), normalized CE migration time (in minutes) and normalized signal intensity. The CKD273 classifier is an SVM classification model [27, 28] based on the amplitudes of 273 urinary peptides [7], which allows the calculation of a classification score for the presence and progression of CKD.
Statistical analysis
To estimate the slope of eGFR per year, the reported eGFRs (average of five measurements with a minimum of two) over 39.1 ± 13.4 months were used in a linear model of decay between baseline and follow-up eGFRs. Rapid progression was defined, as described in the Kidney Disease: Improving Global Outcomes (KDIGO) 2012 CKD guidelines, as a sustained decline in eGFR of at least 5 mL/min/1.73 m2/year [29]. Therefore, individuals with a decline of >5 mL/min/1.73 m2/year were defined as progressors, whereas the remaining individuals were non-progressors. To assess the utility of UAE (mg/24 h) and CKD273 at different disease stages, the cohort was stratified by baseline eGFRs (CKD-EPI formula) [30] of ≥80, 70–79, 60–69, 50–59, 40–49, 30–39 and <29 mL/min/1.73 m2. The areas under the curve (AUCs) of the previously defined CKD273 classifier and albuminuria were calculated using receiver operating characteristic (ROC) analysis with MedCalc software (version 12.1.0.0; MedCalc Software, Mariakerke, Belgium; http://www.medcalc.be). For the combination of UAE and CKD273 classifier, a logistic regression was performed. Furthermore, box–whisker plots were generated using the same software. For a better depiction of the plots, UAE as well as CKD273 classifier values were logarithmic transformed. Since CKD273 classifier values can be negative, all values were summed with 2 before logarithmic transformation. As peptide profiles across the samples were not normally distributed, we used the non-parametric Wilcoxon rank sum test to calculate the P-values of individual peptides between the two groups (progressors and non-progressors). The false discovery rate adjustments of Benjamini and Hochberg were employed to correct for multiple testing [31]. An adjusted P-value of 0.05 was selected as the significance level. The analysis was performed using proprietary software (R-based software, version 2.15.3). Using the non-parametric Wilcoxon rank sum test, peptides which were found to be most significantly different between progressors and non-progressors were identified in each eGFR stratum (≥80, 70–79, 60–69, 50–59, 40–49, 30–39, <29 mL/min/1.73 m2). The 10 most significant peptides from each comparison were used for further investigations.
RESULTS
We investigated CE-MS data from 2672 patients derived initially from nine different cohorts, with a mean baseline eGFR of 72.4 ± 21.0 mL/min/1.73 m2 (Table 1). The mean age was 49.7 ± 15.7 years, and the proportion of women was 45.5%. Among all individuals, 76.3% had diabetes. The mean UAE of patients in the cohort was 195.2 ± 627.9 mg/24 h at baseline and the mean CKD273 classification score was −0.210 ± 0.533. We obtained eGFR data from an average of five follow-up visits over a period of 3.3 ± 1.1 years. During the follow-up period, 394 patients displayed progressive CKD with a decline in eGFR of >5 mL/min/1.73 m2/year (Table 2).
Number of patients differentiated between progressors and non-progressors according to categories of the baseline eGFR
| eGFR | ≥80 | 70–79 | 60–69 | 50–59 | 40–49 | 30–39 | <29 |
|---|---|---|---|---|---|---|---|
| Progressor (n = 394) | 180 | 64 | 26 | 14 | 26 | 44 | 40 |
| Non-progressor (n = 2278) | 810 | 579 | 443 | 183 | 70 | 81 | 112 |
| eGFR | ≥80 | 70–79 | 60–69 | 50–59 | 40–49 | 30–39 | <29 |
|---|---|---|---|---|---|---|---|
| Progressor (n = 394) | 180 | 64 | 26 | 14 | 26 | 44 | 40 |
| Non-progressor (n = 2278) | 810 | 579 | 443 | 183 | 70 | 81 | 112 |
Progressor was defined as having a decline in eGFR of >5 mL/min/1.73 m2/year. eGFR, mL/min/1.73 m2.
Prognosis of CKD at different disease stages
The prognosis of CKD at different disease stages using the CKD273 classifier has already been investigated [13, 14]. However, a subdivision based on a large number of strata indicating the severity of CKD has not yet been performed, essentially because the number of samples in those previous studies was too limited due to specific inclusion criteria (e.g. eGFR >60, etc.). In the present study, we investigated in more detail the urinary proteome classifier CKD273 and albuminuria measured as UAE (mg/24 h) at different levels of kidney function. The National Kidney Foundation has defined in the KDIGO guidelines five CKD stages, to develop a broad overview of a ‘clinical action plan’ for the evaluation and management of each stage of CKD [32]. However, the application of these CKD stages to the present cohort resulted in a disproportionate distribution of patients (Supplementary data, Figure SA). Using the KDIGO staging, CKD stage 2 had by far the highest number of patients (59.6%), while CKD stage 5 included only two patients (0.1%). Therefore, and also to obtain a higher resolution, we stratified the 2672 patients in the cohort by using a more consistent method that included the following baseline eGFR strata: ≥80, 70–79, 60–69, 50–59, 40–49, 30–39 and ≤29 mL/min/1.73 m2. With this stratification method, the group with the highest number of patients (≥80 mL/min/1.73 m2) represented 37.1% of the total cohort, and the group with the lowest number of patients (40–49 mL/min/1.73 m2) represented 3.6% (Supplementary data, Figure SB). Although the proportion of patients per group was still not identical, subject distribution was significantly improved compared with using classical CKD stages. For comparison between the CKD273 classifier and UAE with ROC analysis, a progressor/case was defined as having a decline in eGFR of >5 mL/min/1.73 m2/year. The distribution of patients per eGFR stratum in the progressor group was equal to that in the overall population (progressors plus non-progressors) (Table 2). In the two groups with the highest eGFR (80 and 70–79 mL/min/1.73 m2), for the detection of progressors, the AUC of the CKD273 classifier was significantly higher (P < 0.05) than that of UAE (Figure 1). At more advanced stages of disease (eGFR 60–69 and 50–59 mL/min/1.73 m2), the AUC values of UAE and CKD273 were similar. In contrast, in the eGFR groups 40–49 and <29 mL/min/1.73 m2, the AUC values of UAE were significantly higher than those of the urinary proteome classifier, while in the eGFR group 30–39 mL/min/1.73 m2, there was no significant difference in the AUC values between UAE and CKD273 (P = 0.0979). The combination of UAE and CKD273 by the use of logistic regression showed no added value (data not shown). The variability of the UAE values (Figure 2A), irrespective of the patients being progressors or not and irrespective of the eGFR stratum, was higher than the CKD273 scores (Figure 2B and Table 3). In addition, there was an important sudden shift upwards in UAE values at moderately advanced disease stages, which was absent in CKD273 scores that only mildly or gradually increased with decreasing renal function. Overall, these observations suggest a greater stability of the CKD273 classifier in predicting renal function over the different CKD strata.
Mean (± SD) values for UAE and CKD273 classifier, divided into progressors and non-progressors in each eGFR stratum
| eGFR | ≥80 | 70–79 | 60–69 | 50–59 | 40–49 | 30–39 | <29 |
|---|---|---|---|---|---|---|---|
| Non-progressor | |||||||
| UAE | 11 ± 27 | 14 ± 35 | 19 ± 98 | 40 ± 183 | 322 ± 534 | 1090 ± 963 | 1319 ± 1033 |
| CKD273 | −0.456 ± 0.393 | −0.360 ± 0.405 | −0.275 ± 0.428 | −0.182 ± 0.458 | 0.157 ± 0.537 | 0.560 ± 0.405 | 0.708 ± 0.260 |
| Progressor | |||||||
| UAE | 26 ± 90 | 39 ± 99 | 75 ± 174 | 879 ± 1291 | 1306 ± 947 | 2120 ± 1581 | 2041 ± 1218 |
| CKD273 | −0.212 ± 0.449 | −0.046 ± 0.448 | 0.036 ± 0.599 | 0.291 ± 0.684 | 0.601 ± 0.368 | 0.690 ± 0.323 | 0.661 ± 0.292 |
Progressor was defined as having a decline in eGFR of >5 mL/min/1.73 m2/year. eGFR, mL/min/1.73 m2.

AUCs of the ROC analyses for albuminuria and CKD273 classifier in each eGFR stratum.
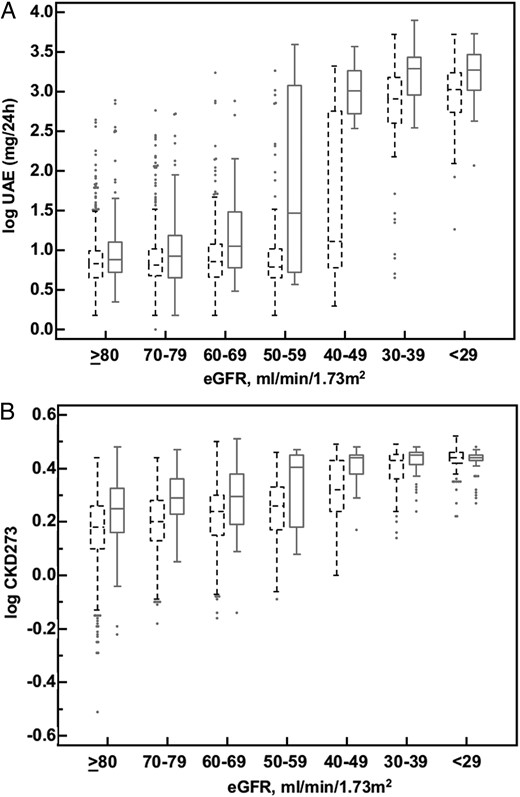
(A) Box–whisker plot of logarithmic UAE values of progressors (solid lines) and non-progressors (dashed lines) in each eGFR stratum. (B) Box–whisker plot of logarithmic CKD273 classifier values of progressors (solid lines) and non-progressors (dashed lines) in each eGFR stratum.
Distribution of urinary peptides at different disease stages
As discussed in detail in several studies [7, 13, 14, 33], one advantage of the CE-MS-based urinary proteome analysis is that thousands of peptides in the urine can be assessed to reflect the pathophysiology of a disease at different degrees of severity. To investigate if the abundance of single peptides does change based on CKD severity, we searched for peptides with a significant difference between progressors and non-progressors in the different eGFR groups. Using the non-parametric Wilcoxon test, we identified hundreds of peptides that are associated with the progression of CKD. To avoid introducing bias through a different number of indicative peptides in each group, we investigated the 10 most significant peptides in each eGFR group and allocated them to the corresponding parental protein if there were several structural variants of the same molecule. As depicted in Figure 3, in the urine of patients at mild disease stages (eGFR ≥80, 70–79 and 60–69 mL/min/1.73 m2), the differences between progressors and non-progressors were mostly confined to various collagen and uromodulin fragments. Collagen and uromodulin fragments were decreased in progressors compared with non-progressors (data not shown). In the urine of patients at moderately advanced disease stages (eGFR 60–69, 50–59 and 40–49 mL/min/1.73 m2), α1-antitrypsin (A1AT) and serum albumin fragments appeared (increased in progressors). Urinary peptides associated with late CKD stages (eGFR 30–39 and <29 mL/min/1.73 m2) showed a highly variable distribution. Interestingly, in the last eGFR stratum (<29 mL/min/1.73 m2), many peptides of blood-derived proteins, like vitamin D-binding protein, transthyretin, serum amyloid A-1 protein and A1AT, were found. In all eGFR groups, 28% of these significant peptides were also found in the CKD273 classifier [7]. The CKD273 classifier includes specific peptide fragments derived from 30 different proteins, 15 of which are among the 25 proteins that gave rise to peptides found to be associated with the progression of CKD in this study (Figure 3).

Number and protein origin of the most significant peptides in each eGFR stratum.
DISCUSSION
Several studies have demonstrated that the urinary proteome-based CKD273 classifier [7] allows the identification of patients with diabetes who are at risk of progression to diabetic nephropathy [10, 14]. In addition, a small-scale study also showed that a low CKD273 score is associated with a slow progression of CKD in a small cohort of patients with CKD resulting from different aetiologies [11]. Finally, in a large CKD cohort, the CKD273 classifier performed significantly better in detecting and predicting the progression of CKD compared with the current clinical standard of urinary albumin, and displayed improved sensitivity in identifying patients with rapidly progressing CKD [13]. However, the projection of its performance related to the baseline eGFR will provide further information for application of the classifier in the management of CKD. A recent study has shown that early renin-angiotensin system intervention in CKD (diabetic nephropathy) is more beneficial in delaying ESRD than intervention at later stages [16]. Hence, optimization of classifiers towards specific CKD stages is desirable. To steer such an approach, the best performing biomarkers per specific eGFR stratum should be identified.
In this study, we were able to show the advantages and limitations of the proteome-based classifier CKD273. While in early stages of disease the CKD273 classifier outperformed albuminuria in the detection of fast progressors (eGFR decline of >5 mL/min/1.73 m2/year), albuminuria performed better in CKD patients with late-stage disease. Interestingly, in the eGFR groups 70–79, 60–69, 50–59 and 40–49 mL/min/1.73 m2, the performance of the CKD273 classifier was relatively constant, while the performance of albuminuria increased in this eGFR baseline range, but starting from a very low value. In the most advanced eGFR groups (30–39 and <29 mL/min/1.73 m2), the AUC values of both CKD273 and albuminuria decreased. The reason why the performance of the proteome classifier was more constant might be attributed to the fact that it combined the measurement of 273 different peptides. Decreased performance of a group of peptides for a specific eGFR stratum can be compensated for by other peptides that perform better at this eGFR stratum. This is illustrated in Figure 3, where collagen fragments were prominent in early CKD, while more A1AT and serum albumin fragments (e.g. blood-derived) appeared once the eGFR fell below 70 mL/min/1.73 m2.
Based on this distribution of urinary peptides associated with progression at different baseline eGFR levels, the potential contribution of proteins to the pathophysiology of CKD progression can be proposed.
Early stage disease (eGFR 70 to ≥80 mL/min/1.73 m2)
Modification of various collagen fragments in early CKD stages suggests changes in extracellular matrix (ECM) turnover, which is a hallmark of renal disease [34, 35]. The ECM is a very dynamic, highly charged structure that acts both as a support structure for the cells and as an active component in cell signalling [36]. Proteases such as matrix metalloproteinases (MMPs) and their inhibitors are responsible for maintaining the equilibrium between the formation and degradation of ECM proteins [34]. During fibrosis, the formation of scar tissue in the interstitial space is the result of excessive accumulation of ECM components. Collagen types I and III are known to be deposited in early stages of renal fibrosis [37, 38]. Recently, Genovese et al. [34] predicted that the ECM, the principal underlying structure of fibrotic tissue, will be a source of biomarkers of renal fibrosis. Such biomarkers could identify the early modifications that lead to renal fibrosis and could allow early treatment, helping in the prevention of fibrosis. They illustrated the possible advantages of markers of ‘structural changes’ over markers of loss of kidney function (‘functional changes’). Therefore, the CKD273 classifier, which is mainly composed of a range of different collagen fragments (202 of the 273 peptides), by acting as a biomarker of ECM remodelling, may identify molecular processes occurring in the early phases of fibrogenesis, giving the opportunity for early intervention at stages in which the disease might still be reversible. Another protein found to be associated with early disease stages was uromodulin. Uromodulin expression is essentially restricted to the tubules. Excretion of uromodulin has been reported to be downregulated in diabetic nephropathy [39, 40], and reduced excretion of specific uromodulin fragments has also been observed in other forms of CKD [41]. With respect to the link between uromodulin and early stage kidney disease, Zimmerhackl et al. [42] proposed that renal uromodulin excretion indicates early medullary dysfunction in diabetes mellitus type 1. Furthermore, recent studies proposed a role of uromodulin in the development of ECM by early leakage from the tubular lumen to the tubular interstitium, inducing inflammation and subsequent fibrosis [43].
Moderately advanced disease (eGFR 40–69 mL/min/1.73 m2)
Examination of peptides associated with moderately advanced disease suggests that, in this phase, progression is related to inflammatory processes. Daemen et al. [44] investigated the contribution of acute phase proteins, like A1AT, to the protective effect of ischaemic preconditioning in the kidney. They proposed that the anti-apoptotic and anti-inflammatory effects of A1AT contribute to the delayed type of protection associated with ischaemic preconditioning and other insults. Furthermore, Zager et al. [45] showed that (i) acute kidney injury (AKI) rapidly upregulates the renal cortical/proximal tubule A1AT gene; (ii) A1AT can confer cytoprotection, potentially by blocking/reducing cytotoxic neutrophil elastase accumulation and (iii) marked increases in urinary A1AT excretion imply clinical relevance of the AKI–A1AT induction pathway. This effect was linked to an antiprotease/antineutrophil elastase effect of A1AT [45]. In our study, we could convey a parallel hypothesis that the presence of urinary A1AT fragments in the urine at moderately advanced disease stages could be considered as a factor mitigating inflammatory processes in the kidney that can induce progression of disease to more severe CKD stages.
Late-stage disease (eGFR <39 mL/min/1.73 m2)
In late stages of CKD, when the GFR is already low, glomerular damage results in loss of the filtration barrier and consequently the appearance of blood proteins such as serum albumin, vitamin D-binding protein, transthyretin, serum amyloid A-1 protein and A1AT in the urine. Therefore, as postulated by Genovese et al. [34], during this process, only ‘functional changes’ (see above) can be found. Albumin excretion displays very well the consequences of the molecular structural changes that lead to progression of CKD, and hence loss of glomerular function is a better marker at late stages of CKD than at early stages. However, at this late stage, damage to the glomeruli may be largely irreversible and therefore, at this stage of the disease, therapy is generally not curative.
In conclusion, this study on the urinary proteome of >2600 patients indicates a clear benefit of the urinary proteome classifier CKD273 at early stages of disease, when the first signs of the disease (structural changes) may still be reversible with the use of specific therapies. Albuminuria is a better marker for progression at late stages of CKD, when the glomeruli are already irreversibly damaged (functional changes); blood-derived proteins leak through the damaged glomerular basement membrane and are therefore found in the urine. Since this study was mostly based on patients suffering from diabetes (77%), the results apply, for the major part, to CKD in diabetic patients. Since diabetes is the most common recognized cause of CKD, the study indicates that screening in these patients using CKD273 is valuable. In this context, the CKD273 classifier is currently in use in a clinical trial, the PRIORITY study [46], to screen normoalbuminuric diabetic patients for the presence of diabetic kidney disease before the detection of albuminuria. The study also allowed assessment of its practical implementation: to date, >1500 patients have been evaluated using CKD273 in this study. The result is obtained typically within 3 days, hence within a similar time frame as for albuminuria. Because the CE-MS analysis is a high-end technology, in contrast to the microalbuminuria test, the cost is higher. However, health economic calculations indicate that CKD273 classifier analysis, when used for the detection of early stage CKD, demonstrated cost-effectiveness [5].
SUPPLEMENTARY DATA
Supplementary data are available online at http://ndt.oxfordjournals.org.
FUNDING
The research leading to these results has received funding from the European Union Seventh Framework Programme (FP7/2007–2013) under grant agreements 279277 (Proteomic prediction and Renin angiotensin aldosterone system Inhibition prevention Of early diabetic nephRopathy In type 2 diabetic patients with normoalbuminuria), 278249 (Markers for Sub-clinical Cardiovascular Risk Assessment), 305507 (Heart Omics in Ageing) and 608332 (Clinical and system – omics for the identification of the Molecular Determinants of established Chronic Kidney Disease).
CONFLICT OF INTEREST STATEMENT
H.M. is cofounder and a shareholder of Mosaiques Diagnostics. C.P., J.S. and P.Z. are employees of Mosaiques Diagnostics. J.P.S. was temporarily employed by Mosaiques Diagnostics during this study.
REFERENCES


Comments