


Abstract
The impact of donor age in paediatric kidney transplantation is unclear. We therefore examined the association of donor–recipient age combinations with graft survival in children.
Data for 4686 first kidney transplantations performed in 13 countries in 1990–2013 were extracted from the ESPN/ERA-EDTA Registry. The effect of donor and recipient age combinations on 5-year graft-failure risk, stratified by donor source, was estimated using Kaplan–Meier survival curves and Cox regression, while adjusting for sex, primary renal diseases with a high risk of recurrence, pre-emptive transplantation, year of transplantation and country.
The risk of graft failure in older living donors (50–75 years old) was similar to that of younger living donors {adjusted hazard ratio [aHR] 0.74 [95% confidence interval (CI) 0.38–1.47]}. Deceased donor (DD) age was non-linearly associated with graft survival, with the highest risk of graft failure found in the youngest donor age group [0–5 years; compared with donor ages 12–19 years; aHR 1.69 (95% CI 1.26–2.26)], especially among the youngest recipients (0–11 years). DD age had little effect on graft failure in recipients’ ages 12–19 years.
Our results suggest that donations from older living donors provide excellent graft outcomes in all paediatric recipients. For young recipients, the allocation of DDs over the age of 5 years should be prioritized.
INTRODUCTION
It has been well established that in children with end-stage renal disease, renal transplantation offers optimal patient survival probabilities, cognitive development, quality of life and growth [1–5]. Deceased donor (DD) kidney allocation policies aim to reduce waiting times and provide high-quality grafts to the best-matched recipients in order to improve post-transplant patient and graft survival. The donor–recipient matching process is often based on a composite points-based system involving factors such as waiting time, human leucocyte antigen and blood group matching, percentage of panel-reactive antibodies, distance between donor and recipient and medical urgency.
In the USA and most European countries, a DD recipient ‘young-for-young’ matching policy has been implemented, as this would reduce the number of size mismatches, the risk of hypo-perfusion and graft non-function [6–11]. In addition, grafts from paediatric donors show a superior long-term kidney function compared with grafts from adult donors, likely due to their ability to adapt to the growing child [12, 13]. Conversely, earlier reports have shown a higher risk of graft loss in recipients of (very) young donors due to surgical complications, high rates of graft thrombosis, early rejection and hyperfiltration injury [8, 9, 14–16].
It is known that living donation offers better long-term graft survival and improved growth compared with deceased donation [17–19]. In adult transplant recipients, it has been established that advanced living donor (LD) age is associated with poorer graft survival compared with younger LDs [20–22]. In paediatric LD transplantation, it remains unclear whether utilizing kidneys from elderly donors, such as from grandparents, may affect graft survival compared with kidneys from younger donors.
Although recipient and donor age are both known to affect graft survival, a potential interaction effect between recipient and donor age on graft survival has not previously been explored in depth and physicians may question whether to accept an organ from a grandparent or from a DD. Therefore the current study aims to optimize the utilization of donor grafts by examining how the relationship between donor age and recipient age affects 5-year graft survival in paediatric kidney transplant recipients.
MATERIALS AND METHODS
Data source and study population
This observational cohort study was performed using incident patient data from the European Society for Paediatric Nephrology/European Renal Association–European Dialysis and Transplantation Association (ESPN/ERA-EDTA) Registry database for 13 European countries where donor age has been reported [23]. Denmark, Finland, France, Greece, Norway, Portugal, Spain and the UK provided data from 1 January 1990 to 31 December 2013; Belgium from 2006; Belarus from 2010; Germany from 2012; and The Netherlands and Turkey from 2007. Data were extracted on patients’ date of birth, sex, primary renal disease (PRD), date of first transplantation and events such as graft failure, death, changes in renal replacement therapy (RRT) modality and transfer out of the registry, as well as on donor source and age.
Statistical analysis
The primary outcome studied was 5-year graft survival. The association between donor age and recipient age on graft failure risk, stratified by donor source, was estimated using Kaplan–Meier survival curves and Cox regression models. After examination of the splined effect of both donor and recipient age on graft failure, age categories were defined for DD age groups as 0–5, 6–11, 12–19, 20–49 and ≥50 years and for recipient age groups as 0–5, 6–11 and 12–19 years at transplantation. In addition, subgroup analyses were performed in children 0–3 years old at transplantation. Due to the small number of patients in this subgroup, we combined the previous donor age groups to 0–5, 6–19 and ≥20 years to increase the statistical power in the stratified analyses. All analyses were stratified by donor source and adjusted for recipient age at transplantation, donor age, sex, PRD with a high risk of recurrence (defined as focal segmental glomerulosclerosis, membranoproliferative glomerulonephritis, haemolytic uremic syndrome, oxalosis or systemic lupus erythematosus), pre-emptive transplantation, calendar year of transplantation and country. As DD age and recipient age displayed a non-linear relationship with graft loss, both were included in the Cox model using restricted cubic splines. Patients were censored when lost to follow-up, at the end of the study or after 5 years of follow-up, whichever came first. In countries providing data over the full study period (Denmark, Finland, France, Norway, Spain and the UK, representing 90.2% of available data), we compared whether graft survival had improved between the periods 1990–2000 and 2000–13. We also studied death-censored graft survival in a sensitivity analysis. Results were similar and therefore not described. Analyses were performed using SAS 9.4 (SAS Institute, Cary, NC, USA) and R version 3.3.1 (R Project for Statistical Computing, Vienna, Austria).
RESULTS
Recipient and donor characteristics
A total of 4686 patients received their first kidney transplantation between 1990 and 2013 across 13 European countries. The majority of grafts were obtained from DD [n = 3517 (75.1%)]. Patient characteristics stratified by donor source are presented in Table 1. In countries providing data over the full study period [n = 4229 (90.2%)], the proportion of LD transplants increased from 19.7% in 1990–2000 to 25.4% in 2000–13 (P < 0.0001). Among LDs, 78.6% were between 30 and 50 years of age, reflecting that the majority of living donations likely come from parents. Among DDs, 61.4% received a young-for-young (both recipient and donor <19 years of age) donor, which varied by country (Appendix 1 in Supplementary data). The percentage of deceased adult donations (>20 years of age) was 44.5% in adolescent recipients (12–19 years old), whereas this was 29.4% in recipients <12 years of age.
Patient characteristics stratified by donor source
| DD | LD | P-value | |
|---|---|---|---|
| (n = 3517) | (n = 1168) | ||
| Age at RRT (years), median (IQR) | 10.6 (5.2–14.2) | 11.5 (5.6–15.2) | 0.0001 |
| Age at first treatment (years), median (IQR) | 11.7 (6.6–15.2) | 11.9 (6.3–15.7) | 0.36 |
| Donor age (years), median (p5, p25, p75, p95) | 16 (3, 10, 28, 49) | 41 (28, 36, 46, 55) | <0.0001 |
| Gender (male), n (%) | 2095 (59.6) | 700 (59.9) | 0.86 |
| High risk of recurrent PRD, n (%) | 585 (16.6) | 122 (10.4) | <0.0001 |
| Pre-emptive treatment, n (%) | 746 (21.2) | 504 (43.1) | <0.0001 |
IQR, interquartile range; p5, 5th percentile; p25, 25th percentile; p75, 75th percentile; p95, 95th percentile.
Graft survival
A total of 537 graft failures occurred during 16 221 patient follow-up years, corresponding with a 5-year graft failure rate of 33.1 per 1000 patient-years. The overall 5- and 10-year graft survival rates were 86.3% [95% confidence interval (CI) 85.2–87.4] and 73.2% (95% CI 71.1–75.2), respectively. In DD recipients, the 5- and 10-year graft survival rates were 85.1% (95% CI 83.7–86.3) and 72.0% (95% CI 69.7–74.3), respectively, compared with 90.1% (95% CI 87.8–92.0) and 76.9% (95% CI 72.1–81.0) in LD recipients (log-rank P < 0.0001). DD recipients had a higher risk of graft failure compared with LD recipients [hazard ratio (HR) 1.68 (95% CI 1.24–2.12)]. In countries providing data over the full study period [n = 4229 (90.2%)], graft failure risk did not change significantly over time for DD recipients [1990–2000 versus 2000–13; HR 1.03 (95% CI 0.84–1.26)], whereas in LD recipients graft survival improved over time [1990–2000 versus 2000–13; HR 1.60 (95% CI 1.02–2.52), Appendix 2 in Supplementary data]. This improvement was stronger after adjustment for country differences and changes over time in the rate of pre-emptive transplantation [HR 1.77 (95% CI 1.10–2.83)]. Early graft failure, defined as graft failure within 3 months post-transplant, accounted for more than half [n = 287 (53.4%)] of the graft failures.
The association between recipient age and graft survival
Graft survival varied by recipient age. In recipients 0–5 years of age, the 5- and 10-year graft survival rates were 84.2% (95% CI 81.5–86.6) and 75.2% (95% CI 71.7–78.4). Similarly, in the subgroup of patients transplanted at 0–3 years of age, the 5- and 10-year graft survival rates were 83.8% (95% CI 80.0–87.0) and 76.7% (95% CI 71.9–80.8). In recipient ages 6–11 years, the 5- and 10-year graft survival rates were 89.9% (95% CI 87.9–91.5) and 76.7% (95% CI 73.4–79.6), and in recipients ages 12–19 years, the 5-year graft survival was 84.6% (95% CI 82.8–86.3). In the latter group there were insufficient patients with complete follow-up to accurately assess 10-year graft survival, as adolescents are often lost to follow-up when transferred to adult care. During 5 years of follow-up, recipient age was non-linearly associated with graft loss (Figure 1; P < 0.0001) but did not differ by transplant source (P-value for interaction term = 0.80) or study period (P-value for interaction term = 0.94; Appendix 3 in Supplementary data). Compared with the recipient age group 6–11 years, graft failure risk was higher in patients transplanted at 0–5 years of age [adjusted HR (aHR) 1.60 (95% CI 1.24–2.07)], in patients transplanted at <3 years of age [aHR 1.63 (95% CI 1.26–2.12)] and during adolescence [aHR 1.54 (95% CI 1.24–1.93)]. Similar results were obtained for 10 years of follow-up [0–5 years versus 6–11 years aHR 1.23 (95% CI 1.00–1.51); <3 years versus 6–11 years aHR 1.24 (95% CI 1.00–1.52)].
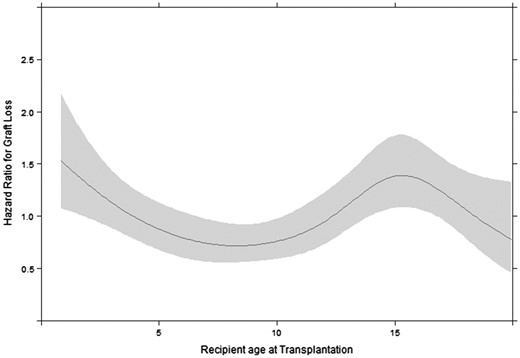
Effect of recipient age at transplantation on the hazard of graft loss with 95% confidence bands, adjusted for donor age, PRD with a high risk of disease recurrence, sex, pre-emptive transplantation, calendar year of transplantation and transplant source.
Notably, the percentage of early graft failure (within the first 3 months post-transplantation) was higher in recipients <5 years of age (63.4% of all the grafts lost during the first 5 years) compared with recipients ages 6–11 years (42.0%) and 12–19 years (40.1%). In recipients 0–3 years of age, the percentage of early graft failure was 71.4% of all the grafts lost during the first 5 years, possibly reflecting the surgical difficulties of transplantation in the youngest patients. In patients with a functioning graft at 3 months post-transplant, compared with the recipient age group 6–11 years, graft failure risk was similar in patients transplanted at 0–5 years of age [aHR 1.01 (95% CI 0.69–1.48)] and in patients transplanted at 0–3 years of age [aHR 0.84 (95% CI 0.64–1.10)] but higher during adolescence [aHR 1.71 (95% CI 1.28–2.29)].
The association between donor age and graft survival
The age of an LD was not associated with graft survival [aHR 1.00 per additional year (95% CI 0.97–1.03); Figure 2A], even when comparing older LDs (n = 180, 50–75 years old) with younger LDs (n = 989, 18–50 years old) [aHR 0.74 (95% CI 0.38–1.47)]. DD age was non-linearly associated with graft survival (Figure 2B; P < 0.0001). The adjusted risk of graft failure was highest in recipients of the youngest donor grafts, decreasing exponentially until the donor age of ∼12 years, after which the risk of graft failure gradually rose with increasing donor age. Compared with donor ages 12–19 years, the youngest DD age group (0–5 years) showed the highest risk of graft failure [aHR 1.69 (95% CI 1.26–2.27)]. This effect remained after excluding donors <2 years of age [aHR 1.50 (95% CI 1.09–2.06)] and did not differ by study period (P-value for interaction term = 0.53). HRs for DD age groups 6–11 years [aHR 1.20 (95% CI 0.90–1.60)], 20–49 years [aHR 1.13 (95% CI 0.87–1.46)] and ≥50 years [aHR 1.44 (95% CI 0.87–2.37)] were not statistically significantly different compared with the donor age group 12–19 years.
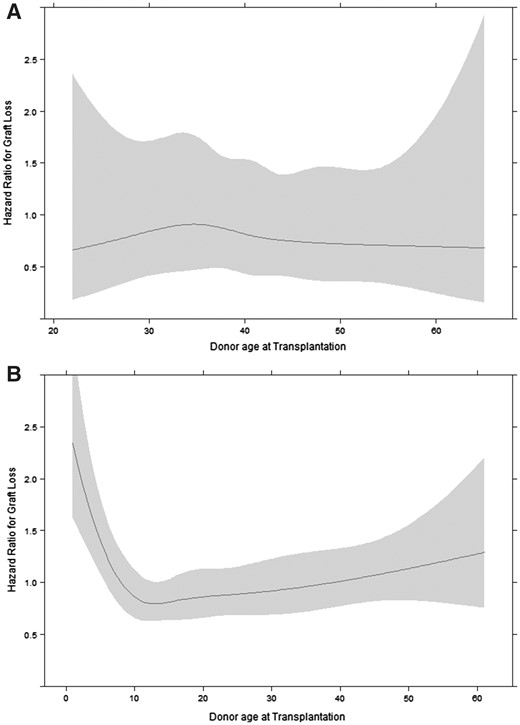
Effect of (A) living and (B) deceased donor age on the hazard of graft loss with 95% confidence bands, adjusted for recipient age at transplantation, PRD with a high risk of disease recurrence, sex, calendar year of transplantation and pre-emptive transplantation.
Graft survival in donor–recipient age combinations
In all recipient age groups, living donation provided the lowest adjusted risk of graft failure. To answer the question of which DD age provides the best graft survival in the absence of a suitable LD, we focused on the comparison of donor and recipient age combinations. HRs and Kaplan–Meier curves are presented in Table 2 and Figure 3 and the non-linear effect of DD age on graft failure is presented by recipient age group in Appendix 4 in the Supplementary data. In the youngest recipients (ages 0–5 years), the risk of graft failure was highest in DDs 0–5 years of age [compared with DDs 12–19 years; aHR 2.01 (95% CI 1.11–3.67)]. A subgroup analysis in recipient ages 0–3 years provided similar results (Table 2, Appendix 5 in Supplementary data). In transplant recipients ages 6–11 years, compared with the DD age group 12–19 years, graft failure risk was also higher in those receiving a graft from a 0- to 5-year-old DD [aHR 2.38 (95% CI 1.31–4.32)], whereas other donor age groups showed similar graft failure risks. In adolescent recipients ages 12–19 years, graft survival was similar across all DD age groups, suggesting that adolescence itself is a more influential determinant of graft failure.
Five-year graft survival and hazard ratios for graft failure risk by donor–recipient age groups
| Recipient age (years) | Donor age (years) | Source | n | 5-year graft survival, % (95% CI) | Hazard ratio, % (95% CI) | |
|---|---|---|---|---|---|---|
| Crude | Adjusted | |||||
| 0–3 | 0–5 | DD | 87 | 70.4 (59.3–78.9) | 2.35 (1.30–4.23) | 1.86 (1.01–3.41) |
| 0–3 | 6–19 | DD | 81 | 86.4 (79.8–91.0) | Reference | Reference |
| 0–3 | 20+ | DD | 152 | 82.3 (72.0–89.1) | 1.33 (0.67–2.64) | 1.68 (0.78–3.59) |
| 0–3 | All | LD | 130 | 91.3 (84.9–95.1) | 0.66 (0.32–1.37) | 0.67 (0.26–1.73) |
| 0–5 | 0–5 | DD | 152 | 74.9 (68.2–82.3) | 2.49 (1.42–4.37) | 2.01 (1.11–3.67) |
| 0–5 | 6–11 | DD | 161 | 80.9 (74.8–87.5) | 1.75 (0.97–3.15) | 1.51 (0.82–2.76) |
| 0–5 | 12–19 | DD | 166 | 88.7 (83.9–93.8) | Reference | Reference |
| 0–5 | 20–49 | DD | 148 | 83.1 (77.1–89.5) | 1.56 (0.84–2.87) | 1.47 (0.77–2.80) |
| 0–5 | 50+ | DD | 15 | 87.1 (71.9–100) | 1.24 (0.29–5.32) | 1.26 (0.27–5.83) |
| 0–5 | All | LD | 242 | 90.0 (86.1–94.2) | 0.88 (0.47–1.65) | 0.77 (0.38–1.56) |
| 6–11 | 0–5 | DD | 145 | 80.8 (74.5–87.6) | 2.91 (1.63–5.2) | 2.38 (1.31–4.32) |
| 6–11 | 6–11 | DD | 201 | 89.2 (84.8–93.8) | 1.47 (0.79–2.73) | 1.22 (0.64–2.32) |
| 6–11 | 12–19 | DD | 294 | 92.2 (89.0–95.6) | Reference | Reference |
| 6–11 | 20–49 | DD | 273 | 90.3 (86.8–94.2) | 1.36 (0.75–2.46) | 1.19 (0.64–2.21) |
| 6–11 | 50+ | DD | 37 | 81.7 (69.3–96.4) | 2.65 (1.06–6.59) | 1.63 (0.60–4.42) |
| 6–11 | All | LD | 282 | 93.9 (90.8–97.1) | 0.76 (0.38–1.50) | 0.69 (0.31–1.51) |
| 12–19 | 0–5 | DD | 132 | 83.0 (76.5–90.0) | 1.26 (0.78–2.03) | 1.21 (0.74–1.96) |
| 12–19 | 6–11 | DD | 257 | 82.9 (77.9–88.1) | 1.13 (0.77–1.65) | 1.06 (0.71–1.57) |
| 12–19 | 12–19 | DD | 653 | 83.8 (80.4–87.3) | Reference | Reference |
| 12–19 | 20–49 | DD | 797 | 84.6 (81.4–87.9) | 0.98 (0.72–1.32) | 0.99 (0.72–1.35) |
| 12–19 | 50+ | DD | 86 | 76.6 (65.3–89.7) | 1.41 (0.80–2.48) | 1.36 (0.74–2.49) |
| 12–19 | All | LD | 645 | 87.5 (84.0–91.1) | 0.68 (0.48–0.96) | 0.70 (0.47–1.05) |
Hazard ratios were adjusted for PRD with a high risk of disease recurrence, sex, country and pre-emptive transplantation.

Kaplan–Meier survival curves for 5-year graft survival, stratified by DD age groups, recipient age groups and donor source.
DISCUSSION
We show that recipient- and donor-age combinations affect 5-year graft survival in the largest cohort of European paediatric renal transplant recipients studied to date. First, we demonstrate a non-linear effect of recipient age on graft survival, finding a higher rate of graft failure in the youngest and adolescent recipients. Second, we describe a non-linear effect of DD age on graft survival, with the highest rates of graft failure occurring in recipients of the youngest donor grafts. Importantly, LD age did not affect the risk of graft failure, independent of recipient age. Lastly, we establish a high risk of graft failure in younger, pre-adolescent recipients receiving grafts from DDs <5 years of age, whereas in adolescent recipients, DD age seemed less important than adolescence itself.
Graft failure was highest in the youngest and adolescent transplant recipients. In adolescents, the poor graft survival has been attributed to poor compliance with immunosuppression regimens [24–26]. Recipients <5 years of age show a higher risk of graft failure, especially during the first 3 months post-transplantation, most likely reflecting the surgical difficulties of transplantation in the youngest patients [27, 28]. However, after having successfully bridged this initial high-risk period, long-term graft survival was equal compared with patients 6–11 years of age and superior compared with adolescents. Similar results have been demonstrated in the UK and Ireland [29] and by the 2014 North American Pediatric Renal Trials and Collaborative Studies (NAPRTCS) report, which shows the poorest graft survival in DD recipients <2 years of age, especially during the initial post-transplant period [18]. However, improvement may be possible, as in the Nordic countries within Scandiatransplant, as graft survival rates have improved greatly over the past decades, especially among recipients <2 years of age receiving a DD transplant. Between the periods 1982–96 and 1997–2012, the number of transplantations doubled in this group, and the 1- and 3-year graft survival rates improved from 70% to 94.6% and from 60% to 94.6%, respectively, which is now superior to the graft survival in older recipient age groups. The authors attributed this improvement to better surgical techniques and changes in anticoagulation and immunosuppression protocols [30].
DD age is of major importance for graft survival. Similar to our findings, early reports from the USA described a U-shaped association between DD age and graft failure, with higher rates of graft failure occurring in the youngest and oldest donor kidneys, and an ‘optimal’ donor age determined at 20–25 years of age [8, 9, 27, 31, 32]. However, the range of ‘optimal’ DD age has widened over the years. Between 1998 and 2007, the Collaborative Transplant Study found poor outcomes in donors >49 years of age and in those <11 years of age, but similar 10-year survival rates for DDs 11–49 years of age [33]. More recently, the NAPRTCS 2014 annual transplant report cited poor graft survival in recipients of donors <2 years and >50 years of age, but comparable graft survival rates within this age range [18]. In contrast to the NAPRTCS, we found no significant higher risk of graft loss in DDs >50 years of age, although we did find a small upwards trend in increasing risk with older age. However, the number of older donors in our study may be too small to obtain statistical significance.
We demonstrated high rates of graft loss in recipients of kidney grafts from DDs 0–5 years of age, especially in pre-adolescent recipients. This effect was retained after excluding the high-risk donors <2 years of age. In line with our findings, a recent study from the USA demonstrated that paediatric recipients from small (10–20 kg) paediatric donors were at a significantly increased risk for graft loss compared with recipients from adult donors, recommending a cautionary use of these donors as a source to expand the donor pool in children [35]. The poor outcomes found in the youngest donor kidneys has previously been attributed to surgical complications, high rates of graft thrombosis, early rejection and hyperfiltration injury due to size mismatching [8, 9, 14, 15]. Consequently, there has been a reluctance to procure the youngest DD kidneys for transplantation, with a considerable decline in the proportion of donors 0–5 years of age, decreasing from 16.4% during 1988–97 to 7.5% during 1998–2007 in the USA [33]. Nonetheless, multiple studies have shown that even the youngest donors provide acceptable graft outcomes in both adults and children when transplanted en bloc [35–39]. Since December 2004 in the Eurotransplant region, en bloc procurement is compulsory in donors <2 years of age and recommended in donors between 2 and 5 years of age [40]. In other European countries, the en bloc transplantation policy differs, but remained the same during the study period (Appendix 6 in Supplementary data). As en bloc transplantation constitutes a small percentage of all paediatric transplantations, any potential residual confounding in our results will be marginal.
We found a significantly better graft survival among recipients of LD compared with DD kidneys and an improvement in graft survival in LD recipients over time. Similar to the NAPRTCS and Australia and New Zealand Dialysis and Transplant Registry reports, we demonstrated an increase in the use of LDs between the periods 1990–2000 and 2000–13 [41, 42]. In contrast to the adult transplant population where older LDs showed poorer graft survival rates [20–22], we found no association between LD age and graft loss, even in donors 50–75 years of age, although the number of older LDs in our study may be too small and the 5-year follow-up too short to find an effect. Indeed, Tasaki et al. [43] found a worse long-term graft survival in young recipients receiving grafts from LDs >50 years of age compared with LDs <50 years of age, but only 9 years after transplantation. In line with our results, a United States Renal Data System study found no effect of LD age on graft survival in patients <21 years of age [44], and two single-centre studies found no difference in graft survival between paediatric recipients receiving a LD transplant from a grandparent or a parent [45, 46]. Furthermore, Dale-Shall et al. [32] demonstrated in the USA that paediatric recipients of LDs up to the age of 54 years provide higher long-term graft survival rates compared with all DD age groups. Graft survival was only reduced in recipients of LDs >55 years old after 5 years of follow-up but was still similar to that of the ideal 18- to 34-year-old DD [32]. Altogether, these data suggest that older LDs provide excellent graft outcomes in paediatric recipients, independent of recipient age, and should be preferred, given adequate matching, over kidneys from DDs.
Some limitations of our study need to be acknowledged, including missing data on the cause of graft failure, which could further help differentiate early from long-term graft failure, and the issue of unmeasured donor and recipient variables, such as the percentage of panel reactive antibodies, the number of human leucocyte antigen mismatches, the cold ischaemia time, immunosuppression regimens, ethnicity and whether or not the kidneys were transplanted en bloc, which may have led to residual confounding. Furthermore, although we also present 10-year graft survival, the primary outcome used in the current study was graft survival at 5 years. This is a relatively limited amount of time to assess graft failure in children and therefore the results should be interpreted accordingly. Additionally, as France, the UK and Spain compose almost 80% of the total study population and only 13 countries were included in this analysis, our results are hardly generalizable to the rest of Europe. An additional limitation may be the lack of centre-specific data. Although patient and donor factors likely explain most of the variation in graft survival between centres, centre volume and surgeon experience are likely to affect graft survival rates, especially in the smallest children. In other medical fields it seems that centralized, high-volume centres are able to provide better patient outcomes compared with low-volume centres [47–50], although this remains unproven in our subspecialty [51].
Although many countries have implemented a ‘young-for-young’ donation policy, where ‘younger’ DDs are allocated preferentially to children, allocation schemes vary widely in their definition of ‘young’. For example, Eurotransplant preferentially allocates donors <16 years of age to recipients <16 years of age, whereas in the UK, recipients <18 years of age are preferentially allocated well-matched donors <50 years of age, and in Serbia, recipients <21 years of age have regional priority for donors <30 years of age [11]. As both recipient and DD age show a non-linear effect on graft failure risk, a differential graft failure risk exists dependent on recipient and DD age combinations. We therefore recommend fine-tuning the young-for-young allocation schemes by increasing the granularity of the definitions of ‘young’. Specifically, we recommend prioritizing the allocation of DDs >5 years of age (with no specific upper age limit) to pre-adolescent recipients and a cautionary use of the ‘youngest-for-youngest’ allocation. In adolescents, we found poor graft survival rates for DD transplantation across the entire DD age range, precluding any specific donor age recommendations for allocation policy.
SUPPLEMENTARY DATA
Supplementary data are available online at http://ndt.oxfordjournals.org.
AUTHORS’ CONTRIBUTIONS
N.C.C., K.J.J., K.J.v.S, F.S., J.W.G., J.H. and M.B. conceived and designed the study. N.C.C. analysed the data. N.C.C., A.G., H.d.J, S.S.S., B.T., J.H., J.H., F.S. and J.W.G. acquired the data. All authors interpreted the data and contributed to the manuscript. N.C.C., M.B., K.J.J. and K.J.v.S. had full access to the data.
ACKNOWLEDGEMENTS
We would like to thank the patients, their parents and the staff of all the dialysis and transplant units who contributed data via their national registries and contact persons. We also would like to thank E. Levtchenko, D. Haffner, Z. Massy, A. Bjerre and C. Stefanidis for being members of the ESPN/ERA-EDTA Registry Committee and D. Shtiza, R. Kramar, R. Oberbauer, S. Baiko, A. Sukalo, K. van Hoeck, F. Collart, J.M. des Grottes, D. Pokrajac, D. Roussinov, D. Batinić, M. Lemac, J. Slavicek, T. Seeman, K. Vondrak, U. Toots, P. Finne, C. Grönhagen-Riska, C. Couchoud, M. Lasalle, E. Sahpazova, N. Abazi, N. Ristoka Bojkovska, K. Rascher, E. Nüsken, L. Weber, G. von Gersdorff, K. Krupka, B. Höcker, L. Pape, N. Afentakis, A. Kapogiannis, N. Printza, G. Reusz, C.S. Berecki, A. Szabó, T. Szabó, Z.S. Györke, E. Kis, R. Palsson, V. Edvardsson, R. Chimenz, C. Corrado, B. Minale, F. Paglialonga, R. Roperto, G. Leozappa, E. Verrina, A. Jankauskiene, B. Pundziene, V. Said-Conti, S. Gatcan, O. Berbeca, N. Zaikova, S. Pavićević, T. Leivestad, A. Zurowska, I. Zagozdzon, C. Mota, M. Almeida, C. Afonso, G. Mircescu, L. Garneata, E.A. Molchanova, N.A. Tomilina, B.T. Bikbov, M. Kostic, A. Peco-Antic, B. Spasojevic-Dimitrijeva, G. Milosevski-Lomic, D. Paripovic, S. Puric, D. Kruscic, L. Podracka, G. Kolvek, J. Buturovic-Ponikvar, G. Novljan, N. Battelino, A. Alonso Melgar, the Spanish Pediatric Registry, S. Schön, K.G. Prütz, L. Backmän, M. Stendahl, M. Evans, B. Rippe, C.E. Kuenhi, E. Maurer, G.F. Laube, S. Tschumi, P. Parvex, A. Hoitsma, A. Hemke and all centres participating in the RichQ study, R. Topaloglu, A. Duzova, D. Ivanov, R. Pruthi, F. Braddon, S. Mannings, A. Cassula and M.D. Sinha for contributing data to the ESPN/ERA-EDTA Registry.
This article was written by the authors on behalf of the ESPN/ERA-EDTA Registry and the ERA-EDTA Registry, which is an official body of the ERA-EDTA.
FUNDING
This work was supported by funding from the ERA-EDTA and ESPN.
CONFLICT OF INTEREST STATEMENT
None declared.
REFERENCES
ESPN/ERA-EDTA. http://www.espn-reg.org/.


Comments