


Abstract
A convenient method to estimate the creatinine generation rate and measures of creatinine clearance in hemodialysis patients using formal kinetic modeling and standard pre- and postdialysis blood samples has not been described.
We used data from 366 dialysis sessions characterized during follow-up month 4 of the HEMO study, during which cross-dialyzer clearances for both urea and creatinine were available. Blood samples taken at 1 h into dialysis and 30 min and 60 min after dialysis were used to determine how well a two-pool kinetic model could predict creatinine concentrations and other kinetic parameters, including the creatinine generation rate. An extrarenal creatinine clearance of 0.038 l/kg/24 h was included in the model.
Diffusive cross-dialyzer clearances of urea [230 (SD 37 mL/min] correlated well (R2 = 0.78) with creatinine clearances [164 (SD 30) mL/min]. When the effective diffusion volume flow rate was set at 0.791 times the blood flow rate for the cross-dialyzer clearance measurements at 1 h into dialysis, the mean calculated volume of creatinine distribution averaged 29.6 (SD 7.2) L], compared with 31.6 (SD 7.0) L for urea (P < 0.01). The modeled creatinine generation rate [1183 (SD 463) mg/day] averaged 100.1 % (SD 29; median 99.3) of that predicted in nondialysis patients by an anthropometric equation. A simplified method for modeling the creatinine generation rate using the urea distribution volume and urea dialyzer clearance without use of the postdialysis serum creatinine measurement gave results for creatinine generation rate [1187 (SD 475) mg/day; that closely matched the value calculated using the formally modeled value, R2 = 0.971].
Our analysis confirms previous findings of similar distribution volumes for creatinine and urea. After taking extra-renal clearance into consideration, the creatinine generation rate in dialysis patients is similar to that in nondialysis patients. A simplified method based on urea clearance and urea distribution volume not requiring a postdialysis serum creatinine measurement can be used to yield creatinine generation rates that closely match those determined from standard modeling.
INTRODUCTION
Although modeling of hemodialysis adequacy has focused on urea, other solutes behave differently. Creatinine is representative of solutes that diffuse easily across dialysis membranes but not as easily across cell membranes, and its removal may be more representative of small molecular weight uremic toxins than urea. The fractional clearance of creatinine (Kt/V) can be monitored just like Kt/Vurea, and standard Kt/V for creatinine can also be calculated in the usual fashion like that for urea. Similar to the urea nitrogen generation rate, which in stable patients is a surrogate for dietary protein intake, the creatinine generation rate, which is a surrogate for muscle mass and is also a positive indicator of survival, can be calculated using a creatinine kinetic model [1–8]. While predialysis serum creatinine values correlate roughly with the creatinine generation rate, serum creatinine is also governed by dialysis treatment intensity and by residual native kidney function. Creatinine has been shown to have a greater degree of compartment disequilibrium during dialysis than does urea [2], and its removal from the blood flowing through the dialyzer follows slightly different rules than urea, as creatinine appears to be removed only from plasma water [8–10]. In addition, although the extrarenal clearance of creatinine, previously estimated at 0.38 L/kg/24 h [1, 4, 11, 12], is insignificant in normal individuals, it becomes a significant route of creatinine elimination when creatinine concentrations are high.
We developed an open source two-pool model for hemodialysis urea kinetics (Solute Solver) in 2009 [13] to facilitate and refine the monitoring of hemodialysis adequacy in patients undergoing a variety of treatment schedules. In this analysis, we modified Solute Solver to model creatinine kinetics. The availability of data from the HEMO study facilitated this. In the HEMO study, additional blood samples obtained during each dialysis session at month 4 of follow-up were used to test and validate the creatinine kinetic model assumptions. We also tested a simplified method for measuring the creatinine generation rate without the need for a postdialysis serum creatinine measurement.
MATERIALS AND METHODS
We used a subset of the data obtained during the HEMO study follow-up month 4, focusing on sessions that included blood sampling for creatinine. In addition to predialysis and postdialysis urea and creatinine values, the following additional samples were available: a full-flow dialyzer inlet and outlet blood sample at 1 h, a slow-flow 1-h inlet sample, a 30-min postdialysis sample and, in ∼17% of patients, a delayed 60-min postdialysis sample.
Data from 1561 patients with a studied dialysis session during follow-up month 4 were available, but of these, only 471 had creatinine values (the decision to add creatinine analysis was made only after the HEMO study was well under way). Of these, 442 patients had complete sets of creatinine and urea values at all time points of interest. Exclusion of outliers was as follows: 1 patient with 13% weight change, 7 patients with a ratio of 1 h to predialysis blood urea nitrogen (BUN) < 0.20 and >30% difference between 1 h full flow and slow flow BUN samples, 3 patients with a ratio of 1 h to predialysis BUN > 0.85, 19 patients with a reported blood draw time for 1 h sample <50 min or >70 min, 12 patients with a 30-min post-BUN < post-BUN, 2 patients with a 30-min post-BUN > 1.6 × post-BUN, 4 patients with a 30-min post-creatinine (Cr) < post-Cr, 1 patient with a 30-min post-Cr > 2.0 × post-Cr, 20 patients with a dialyzer urea nitrogen extraction ratio <20% (urea nitrogen extraction ratio range of the remaining sessions was 40–97%) and 4 patients with a dialyzer creatinine extraction ratio <0. The 366 cases remaining were judged suitable for urea and creatinine kinetic analysis, 202 randomized to the conventional-dose arm of the HEMO study and 164 to the high-dose arm. Data from the two groups were combined. Native kidney (residual) creatinine clearance was not measured in the HEMO study; residual urea clearance was available and was nonzero in 140/366 cases, the mean value being 0.73 (SD 0.41) mL/min. We estimated residual creatinine clearance in these patients to be 2.2 × urea clearance; 2.2 was the mean ratio of creatinine to urea clearance in the Frequent Hemodialysis Network Daily Trial where both clearances were measured [14].
Urea and creatinine cross-dialyzer clearances at 1 h were computed as the extraction ratio multiplied by the volume of flow through the dialyzer that is available for diffusion (the effective diffusion volume flow rate). In the case of urea, this was assumed to be 89.4% of the blood flow rate (corrected for prepump pressure effects by a previously described correction algorithm) [15]. In the case of creatinine, the effective diffusion-volume flow rate through the dialyzer was taken to be 1.27 × the plasma water flow rate, as suggested by Gotch et al. [8], or 0.791 × the blood flow rate. Because individual hematocrit values on the day of the modeling session were not available, the hematocrit was assumed to be 33%. Although it is accepted that creatinine is removed only from plasma during passage through the dialyzer, equilibration of creatinine between red blood cells and plasma prior to sample processing requires a higher effective (diffusion-available) flow rate through the dialyzer to account for the artificially reduced cross-dialyzer extraction ratio due leakage of creatinine from red blood cells [8,12,13]. According to the HEMO study manual of operations, centers were instructed to leave the samples to clot for ‘at least 30 minutes (but no longer than 1-1/2 hours)’ (Manual of Operations, October 1997, section 10.4, p. 308) [16]. Thus we assumed that substantial equilibration between red blood cells and serum creatinine had occurred prior to and during blood sample centrifugation.
A modified version of Solute Solver, a previously described two-pool software program for urea kinetic modeling [13], was used to determine the creatinine distribution volume, fractional creatinine clearance (spKt/V and eKt/V) and creatinine generation rate. Briefly, the program applies a numerical solution to determine solute concentrations in both a proximal (e.g. ‘extracellular’) and a distal (e.g. ‘intracellular’) compartment under conditions of volume removal only from the proximal compartment. The ratio of the proximal to distal compartment volumes at the end of dialysis was assumed to be 1:2 (1/3–2/3). Because solute diffuses from the distal to the proximal compartment during dialysis, dialyzer and residual native kidney functions effectively remove solute from both compartments. The rate of diffusion between the two compartments was expressed as a clearance (Kc) that was set as a multiple of the end-dialysis distribution volume to account for patient size. Based on the previous analyses of urea kinetics, Kc for urea (in mL/min) was set at 16× the postdialysis urea distribution volume (in L). For creatinine, Kc was adjusted by iteration until the population averages for modeled serum concentrations at 1 h into dialysis and at 30 min and 60 min postdialysis matched the laboratory values as closely as possible. The model was used to compute, among other values, the (two-pool) creatinine generation rate as follows: an initial estimate was assumed and then a weekly solute concentration profile was generated. The modeled predialysis serum creatinine value on the measurement day of the week was then compared with the measured value, and if too low or too high, the generation rate was adjusted accordingly. This process was continued until the modeled and measured predialysis values coincided.
The modeled creatinine generation rate was compared in each patient to a predicted creatinine excretion rate from an anthropometric equation developed by Ix et al. [17] in nondialysis patients. The modeled creatinine generation rate (in mg/kg/day) was also compared with the creatinine index suggested by Canaud et al. [18]. We also tested a simplified model to predict the creatinine generation rate. In this mode, predetermined values for urea clearance × time (Kd-urea × Td), V-urea and predialysis serum creatinine were used to model creatinine kinetics. An assumption was made that the distribution volume for creatinine was 0.95× the urea volume and that the in vivo dialyzer K0A for creatinine was 0.67× the in vivo dialyzer K0A for urea. The 0.67 ratio for the K0A values was determined from simultaneous measurements of cross-dialyzer creatinine and urea clearances at 1 h using the Michaels equation [13]. The simplified model computed the weekly creatinine concentration profile using these values, calculating a postdialysis serum creatinine value for each treatment. The creatinine generation rate was obtained by iteration to match the predicted predialysis serum creatinine value with the laboratory value as in the standard approach. The creatinine generation rate calculated using this simplified approach was then compared with the standard approach in which the cross-dialyzer measured clearance of creatinine and the predialysis and postdialysis measured serum creatinine values were included in the model. In all computations involving the Michaels equation and estimations of diffusive versus total dialyzer clearance, 0.623 was used as the diffusible volume flow fraction for creatinine and 0.894 was used for urea.
RESULTS
Patients randomized to the standard- and high-dose arms were combined in this analysis, but stratified by sex (Table 1). The magnitude of residual kidney function in these patients was minimal, as per trial design. The mean cross-dialyzer clearance (including ultrafiltration) for urea was 230 (SD 37) mL/min, while it was considerably lower for creatinine [164 (SD 30) mL/min]. The two dialyzer clearances were highly correlated (Figure 1); the usually obtained kinetic modeling values for urea and creatinine are given in Table 2. The modeled distribution volume for creatinine was similar to that for urea (Figure 2), the mean value being ∼5% smaller (4% lower in women and 6% lower in men, as shown in Table 2). When estimating the intercompartment clearance by comparing modeled versus actual values of creatinine at 1 h and then at 30 min and 60 min postdialysis, a constant volume multiplier to calculate Kc did not quite fit the mean measured value of serum creatinine at all three time points. When Kc was set to 8.0 mL/min/L of postdialysis creatinine distribution volume, the fit for mean values of creatinine was optimal for all three time points (mean values of modeled 1 h and postdialysis serum creatinine values are shown in Figures 3 and 4, and SDs and percent errors are shown in Tables 2 and 3).
Demographic and dialysis treatment-related variables
| Women | Men | All | P-value women versus men | |
|---|---|---|---|---|
| Cases, n | 228 | 138 | 366 | |
| Postdialysis weight (kg) | 68.2 (16) | 73.1 (14) | 70.0 (16) | <0.001 |
| V-Watson (L) | 31.8 (4.4) | 39.8 (5.0) | 34.8 (6.0) | <0.001 |
| Age (years) | 59.7 (13) | 57.2 (15) | 58.8 (14) | NS |
| Extraction ratio urea (%) | 0.790 (0.084) | 0.753 (0.081) | 0.776 (0.085) | <0.001 |
| Extraction ratio creatinine (%) | 0.631 (0.083) | 0.604 (0.083) | 0.621 (0.084) | 0.003 |
| Kd-urea (mL/min) | 224 (37) | 240 (34) | 230 (37) | <0.001 |
| Kd-creat (mL/min) | 160 (31) | 171 (29) | 164 (30) | <0.001 |
| Kd-creat/Kd-urea | 0.711 (0.064) | 0.713 (0.060) | 0.712 (0.063) | NS |
| Qb (mL/min) | 318 (66) | 353 (55) | 331 (64) | <0.001 |
| Qd (mL/min) | 674 (133) | 679 (133) | 676 (133) | NS |
| Td (min) | 199 (26) | 218 (28) | 206 (28) | <0.001 |
| pre-SUN (mg/dL) | 58.6 (18) | 60.8 (20) | 59.4 (19) | <0.001 |
| pre-SCr (mg/dL) | 9.25 (2.6) | 11.1 (3.2) | 9.94 (3.0) | <0.001 |
V, volume; Kd, dialyzer clearance (cross-dialyzer); Qb, blood flow rate; Qd, dialysate flow rate; Td, dialysis session length; SUN, serum urea nitrogen, SCr, serum creatinine. Values are presented as mean (SD).
Kinetic modeling values for urea and creatinine
| Women | Men | All | P-value women versus men | |
|---|---|---|---|---|
| Cases, n | 228 | 138 | 366 | |
| URR (%) | 71.3 (6.3) | 70.5 (6.6) | 71.0 (6.4) | 0.013 |
| CRR (%) | 62.6 (6.6) | 62.1 (6.0) | 62.4 (6.4) | NS |
| eKt/V-urea | 1.34 (0.25) | 1.32 (0.26) | 1.33 (0.26) | NS |
| eKt/V-creat | 0.944 (0.179) | 0.950 (0.166) | 0.946 (0.174) | NS |
| V-Watson (L) | 31.8 (4.4) | 39.9 (5.0) | 34.8 (6.0) | NS |
| Modeled V-urea (L) | 29.0 (6.0) | 34.7 (7.1) | 31.1 (7.0) | <0.001 |
| V-urea/V-Watson | 0.913 (0.159) | 0.87 (0.14) | 0.897 (0.155) | 0.018 |
| Modeled V-creat (L) | 28.5 (6.6) | 33.7 (7.16) | 30.5 (7.27) | <0.001 |
| V-creat/V-Watson | 0.874 (0.180) | 0.819 (0.151) | 0.854 (0.172) | 0.0036 |
| V-creat/V-urea | 0.959 (0.129) | 0.942 (0.102) | 0.953 (0.120) | 0.158 |
| Intercompartmental creatinine clearance (KcCr, mL/min) | 222 (52) | 261 (56) | 236 (57) | <0.001 |
| Modeleda G-urea nitrogen (mg/min) | 4.51 (1.74) | 5.41 (2.15) | 4.85 (1.95) | <0.001 |
| Modeleda G-creat (mg/min) | 0.721 (0.250) | 0.989 (0.359) | 0.821 (0.322) | <0.001 |
| Modeleda G-creat (mg/day) | 1039 (360) | 1424 (517) | 1183 (463) | <0.001 |
| Ix equation estimate G-creatb (mg/day) | 1006 (218) | 1456 (184) | 1174 (299) | <0.001 |
| Modeled G-creat (mg/kg/day) | 15.4 (4.49) | 19.7 (6.64) | 17.0 (5.78) | <0.001 |
| Canaud creatinine indexc (mg/kg/day) | 19.8 (2.42) | 22.6 (3.05) | 20.9 (2.99) | <0.001 |
| Canaud creatinine indexc (mg/day) | 1360 (385) | 1650 (388) | 1468 (410) | <0.001 |
URR, urea reduction ratio; CRR, creatinine reduction ratio, V, volume; G, generation rate. Values are presented as mean (SD).
Using cross-dialyzer measured creatinine clearance and predialysis and postdialysis serum creatinine as inputs.
Calculated using the ‘D’ equation described by Ix et al. [17].
Calculated according to Canaud et al. [18].
Modeled and laboratory values for 1-h intradialysis and 30-min postdialysis SCr values (mg/dL) and percent errors when Kc = 8.0 mL/min/L of creatinine distribution volume
| Women | Men | All | P-value women versus men | |
|---|---|---|---|---|
| Cases, n | 228 | 138 | 366 | |
| Predialysis SCr (lab) | 9.25 (2.59) | 11.1 (3.20) | 9.94 (2.97) | <0.001 |
| Postdialysis SCr (lab) | 3.47 (1.21) | 4.24 (1.44) | 3.76 (1.35) | <0.001 |
| 1-h intradialytic SCr (lab) | 5.74 (1.77) | 7.08 (2.26) | 6.24 (2.06) | <0.001 |
| 1-h intradialytic SCr (modeled) | 5.84 (1.75) | 7.32 (2.26) | 6.38 (2.08) | <0.001 |
| Error in 1-h value (%) | 2.52 (8.83) | 3.59 (7.78) | 1.92 (8.46) | 0.15 |
| 30-min postdialysis SCr (lab) | 4.23 (1.44) | 5.12 (1.77) | 4.56 (1.63) | <0.001 |
| 30-min postdialysis SCr (modeled) | 4.26 (1.40) | 5.10 (1.65) | 4.57 (1.54) | <0.001 |
| Error in 30-min post dialysis (%) | 1.25 (6.59) | 0.58 (6.67) | 1.00 (6.62) | 0.42 |
| 30-min percent rebound versus post dialysis (lab) | 22.3 (9.94) | 20.9 (8.62) | 21.8 (9.40) | 0.120 |
| 30-min percent rebound versus post dialysis (modeled) | 23.3 (6.38) | 21.2 (4.61) | 22.5 (5.85) | <0.001 |
| Error in 30-min percent rebound (%) | 7.32 (50.4) | 1.04 (32.8) | 4.98 (44.7) | 0.45 |
| Cases, n | 40 | 20 | 60 | |
| Predialysis SCr (lab) | 8.84 (2.35) | 11.98 (3.77) | 9.88 (3.23) | <0.01 |
| Postdialysis SCr (lab) | 3.35 (1.07) | 4.64 (1.74) | 3.78 (1.45) | <0.01 |
| 60-min postdialysis SCr (lab) | 4.30 (1.36) | 5.96 (2.10) | 4.86 (1.80) | <0.001 |
| 60-min postdialysis SCr (modeled) | 4.38 (1.33) | 5.94 (2.06) | 4.90 (1.76) | <0.001 |
| Error in 60-min post dialysis (%) | 2.07 (5.67) | 0.41 (5.03) | 1.52 (5.48) | 0.31 |
| 60-min percent rebound versus post dialysis (lab) | 29.4 (11.2) | 29.0 (9.91) | 29.3 (10.7) | 0.89 |
| 60-min percent rebound versus post dialysis(modeled) | 31.7 (7.23) | 29.2 (6.29) | 30.8 (6.97) | 0.22 |
| Error in 60-min percent rebound (%) | 7.88 (20.6) | 1.61 (23.5) | 5.80 (21.6) | 0.32 |
Values presented as mean (SD). SCr, serum creatinine.
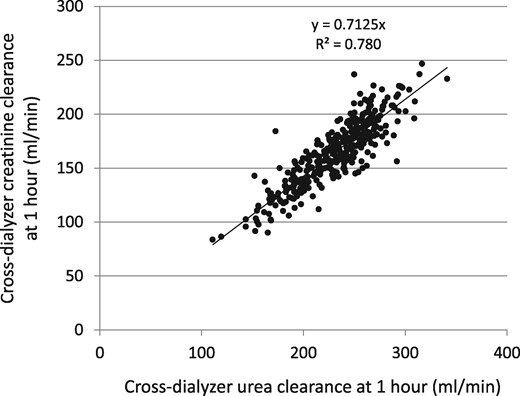
Cross-dialyzer clearances for urea computed using an effective flow rate (see text) of 0.894 × Qb plotted against the cross-dialyzer creatinine clearance using an effective flow rate of 0.791 × Qb. Extraction ratios were obtained 50–70 min into dialysis; n = 366.
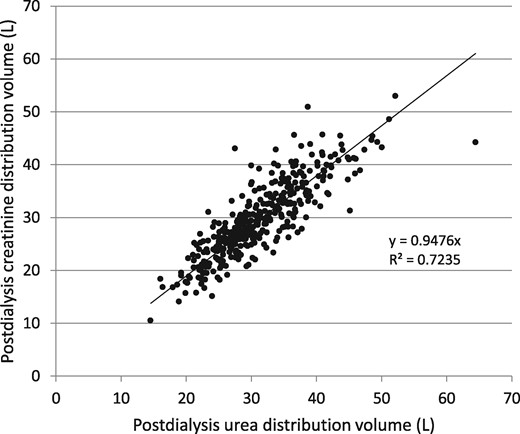
Comparison of modeled postdialysis urea and creatinine distribution volumes in the 366 patients.
![Average modeled versus laboratory serum creatinine values at 1 h and 30 min postdialysis in the entire cohort. Predialysis and postdialysis values are laboratory-measured values in both plots. The dialysis time endpoint is shown as 210 min for all cases for simplification; dialysis times differed among patients [mean 206 (SD 28) min, range 150–284 min]. Only the mean values are shown and the points are connected using a smoothed line plot for illustrative purposes. The standard deviations of the 1-h and rebound values are shown in Table 2.](https://oup.silverchair-cdn.com/oup/backfile/Content_public/Journal/ndt/32/11/10.1093_ndt_gfx038/4/m_gfx038f3.jpeg?Expires=1750503920&Signature=4P~Uv~t6gXJ2j~yNvudNMq-JM88ZfrMPjzQ6we4YLlyABU30Tbev6AgD-5GhvQyuKmAWfQuNN4W0DqFdNlt1AkQn5iPFtv8LDU0TS1Zk7-FxbL0SWxydTe~BUXwqv2ro9KhdbCX2mKd8pUrOxcXP0l64Dj71j5~g3iH8wymITFZvJmD4HZMsrsjjsQ8APVSVM3zcrJqozivMXFSoMZgl3L07zmpWb2Vgz6nLgU9r96g6rGyn6nPjdU1p7A1Jj01h6yRbbh3K5xHO2gb~4bISE3F5fcwtgQ-Vdme0wWWkgyH-Rgf7uvYcAXZQC4nb6tITEsQ8IsGcTrD4M-FMnQR1rw__&Key-Pair-Id=APKAIE5G5CRDK6RD3PGA)
Average modeled versus laboratory serum creatinine values at 1 h and 30 min postdialysis in the entire cohort. Predialysis and postdialysis values are laboratory-measured values in both plots. The dialysis time endpoint is shown as 210 min for all cases for simplification; dialysis times differed among patients [mean 206 (SD 28) min, range 150–284 min]. Only the mean values are shown and the points are connected using a smoothed line plot for illustrative purposes. The standard deviations of the 1-h and rebound values are shown in Table 2.
![Average modeled versus laboratory serum creatinine values at 1 h, 30 min postdialysis and 60 min postdialysis in 60 patients who remained for an extended 60-min sample. Predialysis and postdialysis values are laboratory-measured values in both plots. The dialysis time endpoint is shown as 210 min for all cases for simplification; dialysis times differed among patients [mean 205 (SD 27) min, range 150–270 min]. Only the mean values are shown and the points are connected using a smoothed line plot for illustrative purposes. The standard deviations of the 1-h and rebound values are shown in Table 2.](https://oup.silverchair-cdn.com/oup/backfile/Content_public/Journal/ndt/32/11/10.1093_ndt_gfx038/4/m_gfx038f4.jpeg?Expires=1750503920&Signature=urD~2VAuhh3giQJe7BVTy~miU3c6RZ2OtVgbAOLG21BtiiVsV9kWy2r4OK48LxrGCuySc5S0CMtlFeSX-LnHKFSYcgTHhrbL2YQJ9aRU0VxInMug3fq5L1kUZJMvMiUEAmd8HcL5JS0yK0-nHMaHxvYumAli3xdtQWAeg2NOUeNGzJhsGH5r5BCcIooAmnNCN9zu9-tvG-MO2l3OIX-WlYUcIpBpBUZIIZv8Bi8n0AOhZtzGwm9DzjWSYLReDPXoAVui7qDUg-nRB3JxVXH-vdqkNvrHcjTxkRlgNUPEiepGFlnRASP~X1kpccMBbd2o2jml2gOeovjdZtKfRkAmZQ__&Key-Pair-Id=APKAIE5G5CRDK6RD3PGA)
Average modeled versus laboratory serum creatinine values at 1 h, 30 min postdialysis and 60 min postdialysis in 60 patients who remained for an extended 60-min sample. Predialysis and postdialysis values are laboratory-measured values in both plots. The dialysis time endpoint is shown as 210 min for all cases for simplification; dialysis times differed among patients [mean 205 (SD 27) min, range 150–270 min]. Only the mean values are shown and the points are connected using a smoothed line plot for illustrative purposes. The standard deviations of the 1-h and rebound values are shown in Table 2.
![Modeled two-pool creatinine generation rate compared with an anthropometric estimate according to the equation of Ix et al. [17].](https://oup.silverchair-cdn.com/oup/backfile/Content_public/Journal/ndt/32/11/10.1093_ndt_gfx038/4/m_gfx038f5.jpeg?Expires=1750503920&Signature=e1JdfCh3MzcPxbEB~0-7L9-gOljb0Ya4FP2IHmEumy8xOqF1Vljes78W7NNyyfeejaI-Pxa02FUrmsU9caoqqMNWqK8pwmMGwiURYWeKXVTCE~xWDhPJCe56xcsQ3GHJHjFC6du4izHUDpnfA3exP-L9lPLKb8VQL15n5USvbX~jeegfd8HPmBeF7DYsLkrOzeLUopnh28iH6OzpR3K1ASNIeTqLSwQKrNfR73w2T-hFeQHTifVt8wlKlYIvNDvorLIH7MvEOOPL~huWzY0yYCk31XijGUhDWMgLPsglN~k7bDZcYYhrhg6sUizjENclseEaShGB0NHMc05zEmuwkA__&Key-Pair-Id=APKAIE5G5CRDK6RD3PGA)
Modeled two-pool creatinine generation rate compared with an anthropometric estimate according to the equation of Ix et al. [17].
The two-pool creatinine generation rate averaged 0.821 (SD 0.322) mg/min, or 1183 (SD 463) mg/day. As expected, the modeled creatinine generation rate correlated with the predialysis serum creatinine value, but with considerable scatter (data not shown). When the equation reported by Ix et al. [17] was used to compute an estimated 24-h creatinine excretion rate in these same patients, the mean value was quite similar, 1174 (SD 299) mg/day, R2 = 0.41, Figure 5. Both the anthropometric (Ix et al.) estimate of creatinine generation as well as the modeled value were higher in men than in women (anthropometric, +451 mg/day; modeled, +380 mg/day). The creatinine index, as estimated by Canaud et al. [18] from patient demographics and urea single-pool Kt/V, and which is expressed as mg/kg/day of creatinine generation, was substantially higher (by ∼24%) than the value computed from two-pool modeling (P < 0.001), although the two measures of creatinine generation were modestly correlated (R2 = 0.44; Table 2).
We also compared the generation rate of creatinine (G-creat) computed from the simplified method that does not require a postdialysis serum creatinine measurement, as described above, with the conventional approach using the directly measured cross-dialyzer creatinine clearances and predialysis and postdialysis serum creatinine values. This comparison is shown in Figure 6; the percent error plotted against the modeled G-creat value is shown in Figure 7. The mean value for G-creat by the simplified approach was 1187 (SD 475) mg/day, mean percent error was 0.374 (SD 6.57) and median percent error −0.103. The simplified G-creat value was not significantly different from the modeled G-creat obtained using the classical approach [1183 (SD 463)].
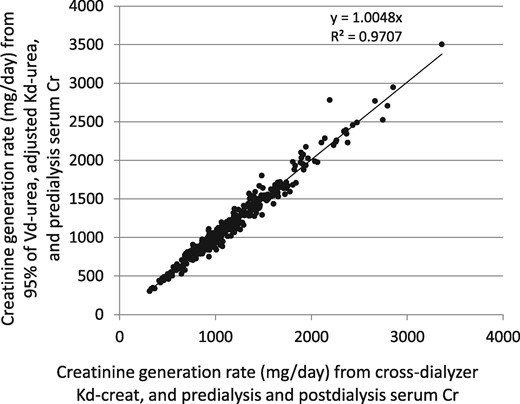
Creatinine generation rate by two different modeling methods. On the horizontal axis is the value from input of cross-dialyzer measured creatinine clearance and both predialysis and postdialysis serum creatinine values. On the vertical axis is the so-called simplified method, where the creatinine generation rate is calculated using 95% of the modeled postdialysis urea distribution volume, the adjusted, measured cross-dialyzer urea clearance and only the predialysis serum creatinine as inputs.
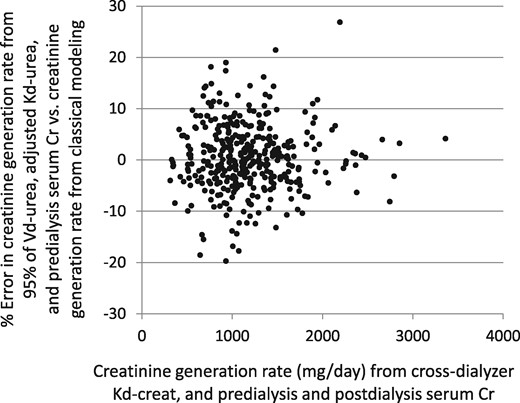
Analysis of percent error in the creatinine generation rate. The test method and standard method are as described in the legend to Figure 6. The mean percent error was 0.037 (SD 6.57).
We compared patients in the conventional-dose arm (n = 202) with those in the high-dose arm (n = 164) of the HEMO study to assess the degree of separation of eKt/V and standard Kt/V. For urea, the values for eKt/V were 1.16 ± 0.14 and 1.55 ± 0.20, respectively, a 34% mean difference in dose. For creatinine, the respective values for eKt/V-creatinine were 0.82 (SD 0.10) and 1.07 (SD 0.14), a 29% separation. Values for total standard Kt/V-urea as well as standard Kt/V-creatinine were less well separated between conventional and high dose groups, 2.35 (SD 0.24) versus 2.74 (SD 0.2) for urea and 2.05 (SD 0.40) versus 2.39 (SD 0.44) for creatinine, a separation of 17% for each solute.
DISCUSSION
Our results indicate that creatinine kinetic parameters can be accurately determined using a two-pool hemodialysis model similar to the urea kinetic model. Only two changes were required: (i) when computing cross-dialyzer clearance, the effective diffusion volume flow rate through the dialyzer had to be reduced from 0.894 × blood flow rate for urea to 0.791 × blood flow rate for creatinine, and (ii) the body size adjustment for intercompartment creatinine clearance had to be reduced from 16 to 8.0 × the postdialysis solute distribution volume (when Kc is measured in mL/min and the distribution volume is measured in liters). The resulting value for Kc predicted both the 1-h intradialysis level of serum creatinine as well as the 30-min and 60-min postdialysis samples reasonably well. In addition, we added an extrarenal (gut) clearance of creatinine, which amounted to ∼1.85 mL/min for a 70-kg person as suggested by Mitch et al. [11, 12]. This raised the creatinine generation rate by ∼15%, to levels that were similar to those found in nondialysis patients as predicted using an equation developed by Ix et al. [17]. Our creatinine generation rate was ∼20% lower than that computed using the estimating equation suggested by Canaud et al. [18]. We believe that the most likely explanation for this is a combination of the use of single-pool instead of two-pool modeling by Canaud et al. and a possible overestimation of dialyzer creatinine clearance. In an earlier publication, Canaud et al. found that their method of blood side modeling overestimated the amount of creatinine recovered using partial dialysate collection by 20% [1], similar to the degree of overestimation of the creatinine generation rate by their estimating equation compared with our modeled value.
One limitation of our study was that all modeling for creatinine was done via blood samples only; dialysate creatinine was not collected. The creatinine concentration in blood samples during dialysis is known to be affected by delayed equilibration between red cells and plasma after blood drawing, which is temperature dependent. This is known to affect both the dialyzer inlet and outlet blood samples [8–10]. In an attempt to circumvent this limitation when calculating cross-dialyzer clearances for creatinine, we used a value for effective diffusion volume flow rate through the dialyzer (Qecr) that was 1.27 × the plasma flow rate (or 0.791 × blood flow rate in the present analysis in which we estimated the intradialysis hematocrit at 33%), as recommended by Gotch et al. [8]. When Qecr was set at this value for the cross-dialyzer clearance measurements, the resulting average calculated volume of distribution for creatinine was similar to that for urea (∼5% less) and the postdialysis volumes of distribution for urea and creatinine averaged 85% and 90% of the Watson anthropometric estimate of total body water [19].
Descombes et al. [9] found that serum inlet samples obtained after dialysis was well under way and that were completely equilibrated had a creatinine concentration higher by 3.8% on average compared with unequilibrated serum samples. Thus it is possible that the postdialysis as well as the 1-h intradialysis serum creatinine measurements in our patients were overestimated by a similar amount. An overestimation of this magnitude (4%) in the postdialysis serum creatinine value would slightly reduce eKt/V-creatinine (by ∼4%), would also cause an overestimation of the creatinine distribution volume by a similar amount and would overestimate the creatinine generation rate by ∼2%. It is also possible that we overestimated the urea distribution volume slightly. We used 0.894 as the effective flow fraction for urea. This is based on the assumption of some urea binding to hemoglobin and an erythrocyte urea distribution volume of 0.80. The true erythrocyte water fraction is only 0.72, and erythrocyte binding to urea has been disputed [7]. For a hematocrit of 33%, the overall effective diffusion volume flow rate for urea without urea binding to hemoglobin would be 0.86 × Qb and not 0.894 × Qb. Use of the lower effective diffusion volume flow rate would reduce the urea distribution volume by 0.86/0.894 = 0.96, or ∼4%.
When the modeled generation rates in the HEMO study patients are compared with the values derived from an estimating equation in normal individuals proposed by Ix et al. [17], it appears that dialysis patients have a similar creatinine generation rate to that in nondialysis subjects, although the slight overestimation of creatinine generation rate due to red blood cell release of creatinine to the postdialysis sample must be kept in mind. Our results confirm the previous findings that extrarenal elimination of creatinine needs to be taken into account [1, 4, 11, 12]. If this is omitted from the kinetic model, the mean creatinine generation rate in the HEMO study patients would be reduced to 85% of the value predicted by the Ix et al. equation.
One problem with monitoring the creatinine generation rate in dialysis clinics that perform urea kinetic modeling is that the postdialysis serum creatinine often is not routinely measured on the modeling day, although predialysis serum creatinine usually is measured monthly. For this reason, we devised a method to simplify measurement of the patient’s creatinine generation, a method that is similar to the urea version of Solute Solver that was designed to accommodate online conductivity clearance and volume as inputs. In the simplified creatinine method, the user enters a value for ‘KT’ as Kd-urea × Td, and also the value for the modeled urea distribution volume. The program then internally computes an in vivo dialyzer K0A for urea, from which an in vivo dialyzer K0A for creatinine is calculated, and the latter is then used to estimate dialyzer creatinine clearance at the input values of blood, dialysate and ultrafiltrate flow rates. The creatinine distribution volume is estimated from the urea distribution volume and the program determines the postdialysis serum creatinine for each dialysis day of the week. The creatinine generation rate is estimated in the usual fashion, adjusting an initial estimate upwards or downwards until the modeled and measured predialysis serum creatinine values on the sampling day of the week coincide. When this was done, the modeled value for the creatinine generation rate calculated according to the simplified model closely matched values based on measured cross-dialyzer creatinine clearances and both pre- and postdialysis serum creatinine measurements. The success of this strategy suggests that the patient’s creatinine generation rate can be monitored as part of regular urea modeling, with the need for only a predialysis serum creatinine value on the modeling day.
Our study has a number of limitations. We relied on a standard proximal–distal compartment model with volume ratios fixed at 1:2. This volume ratio was not optimized on a per patient basis. We also assumed that the intercompartmental creatinine clearance Kc was a multiple of the modeled postdialysis creatinine distribution volume (similar to the calculation of the Kc for urea in the HEMO study). The Kc coefficient was derived by fitting the population means for the 1-h measured intradialysis and the 30-min and 60-min measured postdialysis serum creatinine values to the modeled values. The adjustment was individualized per patient, but only to the extent that each patient’s modeled creatinine distribution volume varied. It is possible that individual patients may substantially deviate from these assumptions, but in the absence of repeated measures, the extent of such deviation was not determinable. Finally, the value for extrarenal creatinine clearance, 0.038 L/kg/day, used in the model was not measured but was based on the average values measured by Mitch and Walser [11, 12]; these investigators found that extrarenal creatinine clearance varied substantially among patients, but there was no way to determine this value individually for each patient based on the blood samples available during the modeling session.
When using the described modeling tools, the postdialysis serum creatinine blood sample should be left to ‘sit’ for at least 30 min and preferably for ∼1 h before centrifugation, to allow for equilibration of creatinine between red blood cells and plasma. Because of this equilibration issue, the computed creatinine distribution volume may be slightly (∼4%) overestimated, which will also lead to a slight overestimation of the creatinine generation rate. For consistency, this 30–60 min delay prior to centrifugation of postdialysis blood should be maintained for all samples.
In summary, our results provide a method for modeling creatinine kinetics that should be relatively easy to do in clinical practice when urea modeling is part of the monitoring program. We believe that the main potential benefit gained from examining creatinine kinetics is measurement and monitoring of the creatinine generation rate [1, 3, 6, 18]. Such measurements might give additional insights into the patient’s nutritional status and/or lean body mass. Accelerated decreases in creatinine generation may serve as a warning sign of ill health and impending poor outcome [18]. The clinical utility of monitoring the creatinine generation rate as a surrogate of lean body mass and predictor of outcomes is a subject for further research; the methods described in the present report should facilitate endeavors in this regard.
SUPPLEMENTARY DATA
Supplementary data are available online at http://ndt.oxfordjournals.org.
ACKNOWLEDGEMENTS
We thank the HEMO study investigators and the National Institute of Diabetes and Digestive and Kidney Diseases (NIDDK) data repository for the data used in this study. The HEMO study was performed by the HEMO study investigators and supported by the NIDDK. This article was not prepared in collaboration with the investigators of the HEMO study and does not necessarily reflect the opinions or views of the HEMO study or the NIDDK. The creatinine module of Creatinine Solver used for this analysis (version 1.18) has been uploaded to the Supplemental Materials section for this article. It is best to check periodically for the latest update of the program at http://www.ureakinetics.org.
CONFLICT OF INTEREST STATEMENT
None declared.
REFERENCES


Comments