


Abstract
Racial differences in overall mortality rates have been found in children on renal replacement therapy (RRT). We used data from the European Society for Paediatric Nephrology/European Renal Association – European Dialysis and Transplant Association Registry to study racial variation in the prevalence of cardiovascular disease (CVD) risk factors among European children on RRT.
We included patients aged <20 years between 2006–13 who (i) initiated dialysis treatment or (ii) had a renal transplant vintage of ≥1 year. Racial groups were defined as white, black, Asian and other. The CVD risk factors assessed included uncontrolled hypertension, obesity, hyperphosphataemia and anaemia. Differences between racial groups in CVD risk factors were examined using generalized estimating equation (GEE) models while adjusting for potential confounders.
In this study, 1161 patients on dialysis and 1663 patients with a transplant were included. The majority of patients in both groups were white (73.8% and 79.9%, respectively). The crude prevalence of the CVD risk factors was similar across racial groups. However, after adjustment for potential confounders, Asian background was associated with higher risk of uncontrolled hypertension both in the dialysis group [odds ratio (OR): 1.27; 95% confidence interval (CI): 1.01–1.64] and the transplant group (OR: 1.37; 95% CI: 1.11–1.68) compared with white patients. Patients of Asian and other racial background with a renal transplant had a higher risk of anaemia compared with white patients (OR: 1.50; 95% CI: 1.15–1.96 and OR: 1.45; 95% CI: 1.01–2.07, respectively). Finally, the mean number of CVD risk factors among dialysis patients was higher in Asian patients (1.83, 95% CI: 1.64–2.04) compared with white patients (1.52, 95% CI: 1.40–1.65).
We found a higher prevalence of modifiable CVD risk factors in Asian children on RRT. Early identification and management of these risk factors could potentially improve long-term outcomes.
INTRODUCTION
Cardiovascular disease (CVD) is the leading cause of death in adult patients with end-stage renal disease (ESRD), accounting for 39% of deaths in patients initiating dialysis in Europe [1] and 40–50% of deaths among ESRD patients in the USA [2, 3]. Although it is not completely clear whether cardiovascular causes of death in children are the same as those in adult patients, data are even more alarming for young ESRD patients, in whom CVD-specific mortality is extremely high compared with healthy children of the same age [4, 5]. It is likely that the coexistence of highly prevalent traditional Framingham risk factors (e.g. hypertension, dyslipidaemia, insulin resistance and obesity) [6–9] and uraemia-related CVD risk factors (e.g. hyperphosphataemia, anaemia and C-reactive protein) contribute to this population’s unique susceptibility to CVD [10, 11].
Ethnic background may be related to mechanisms underlying the development of CVD risk factors. Studies conducted in the USA among healthy children found that African American and Mexican American children had a higher body mass index (BMI), blood pressure (BP) and levels of lipoproteins, insulin and glucose than white children [12–16]. However, as these outcomes may be determined by both local cultural and intrinsic ethnic factors, racial disparities may vary from region to region and American data may, therefore, not be representative for the European community.
In a previous study, in a large European cohort of children with ESRD, we found a higher mortality risk in Asian, but not in black, children as compared with their white counterparts [17]. Since CVD-related mortality is the leading cause of death in this population, we hypothesized that differences in the prevalence of CVD risk factors might help to explain this finding. The identification of specific groups at risk could lead to early implementation of risk factor reduction strategies and may provide an opportunity to prevent CVD. In the current study, we therefore aim to investigate racial variation in the prevalence of CVD risk factors, including hypertension, obesity, anaemia and hyperphosphataemia, in both children on dialysis and with a functioning kidney transplant for at least 1 year.
MATERIALS AND METHODS
Patients
This study used data from the European Society for Paediatric Nephrology/European Renal Association – European Dialysis and Transplant Association (ESPN/ERA-EDTA) Registry. This Registry collects data on children requiring renal replacement therapy (RRT) via national renal registries in Europe. Patients are followed from the start of RRT until transfer to an adult nephrologist, recovery of renal function, loss to follow-up or death, whichever occurs first. Data are collected on an annual basis and include date of birth, sex, primary renal disease, treatment modality at start of RRT and subsequent treatment modality changes. In addition, anthropometric and clinical parameters are collected for a subset of patients. For the present analyses, two groups of patients who started RRT between 2006 and 2013 at an age <20 years were defined: (i) patients initiating dialysis and (ii) patients with a transplant vintage ≥1 year (to avoid the effects of previous dialysis treatment and disturbed metabolism early after transplantation). This means that patients can be present in both groups.
In total, 22 of the 36 countries participating in the ESPN/ERA-EDTA Registry provide data on racial background. The analysis was restricted to medium- and high-income countries to reduce confounding by economic factors in the association between race and outcomes. We included those countries with gross domestic product per capita based on purchasing power parity (PPP) higher than the median value for all 22 countries providing data on racial background (i.e. 17 140 US dollars). Data on PPP were derived from the World Bank Database [18]. Furthermore, we excluded countries with no racial variation in their patient population, i.e. with only white patients (N = 3). As a result, data from the following countries and periods were included in the analyses: Belgium (2006–11), Czech Republic (2007–13), Greece (2006–13), the Netherlands (2006–13), Portugal (2007–13), Slovakia (2007–13), Switzerland (2010–13) and the UK (2006–13).
Definitions
Racial background was categorized as white, black, Asian and other. The group ‘Asian’ consisted of the subcategories South-East Asian and North-East Asian, while the group ‘other’ included the subcategories Arabic-Middle East, North African and mixed. Information on race was reported to the national registries by the renal units. Primary renal diseases were grouped according to the ERA-EDTA Registry coding system adapted for children [19].
All variables were measured according to local practice. To make meaningful comparisons across the paediatric age range, we calculated standard deviation scores (SDS) for each subject, while adjusting for age (phosphorus, haemoglobin, BP), sex (haemoglobin, BP) and height (BP). BMI was calculated as weight/height2 and expressed according to the chronological age for 0–1 year old children and according to height–age (the age of a child with a given height growing at the 50th height percentile) for 2- to 15-year-old children [20]. Secondly, we defined cut-off values for each individual risk factor according to international guidelines [21–26] (summarized in Box 1). Due to the voluntary nature of the Registry, part of the data were missing, varying from 2.3% of the BMI values among transplant patients to 43.5% of phosphate levels among patients on dialysis. Missing values were imputed using multiple imputations. Following the STROBE guidelines, 10 imputed datasets were created to take into account the uncertainty in the measurements [27, 28].
Statistical analyses
To explore differences in demographic and clinical characteristics between racial groups, we used chi-square tests for categorical variables and one-way analysis of variance (ANOVA) for continuous variables.
The prevalence of CVD risk factors was calculated for the four racial groups separately. To address the fact that a patient might have levels outside the target range on some measurements but not on others, each measurement was weighted based on the total number of measurements per patient.
Generalized estimating equation (GEE) models [29] were used to calculate unadjusted and adjusted odds ratios (ORs) for the associations between race and the likelihood of having CVD risk factors. We adjusted for potential confounders that fulfilled the criteria for confounding [30]. Variables included in the multivariable models were: age, sex, time on RRT, country and mode of dialysis treatment (in the dialysis group) or pre-emptive transplantation (in the transplanted group). Because pre-emptive transplantation could influence the number of CVD factors, we repeated the analyses for all CVD risk factors excluding pre-emptively transplanted patients as sensitivity analysis. Finally, a GEE model using a Poisson distribution was applied to calculate the adjusted mean number of risk factors in each racial group.
P-values <0.05 were considered statistically significant. Statistical analyses were performed using SPSS software version 22.0 (SPSS, Chicago, IL, USA) and SAS 9.3 (SAS Institute, Cary, NC, USA).
RESULTS
Patient characteristics
Characteristics of the included patients initiating dialysis (N = 1161) and those with a functioning transplant (N = 1163) are summarized in Tables 1 and 2, respectively. The majority of patients in both groups were white (73.8% and 79.9%). The distribution of country of residence was significantly different across racial groups in both treatment groups (P < 0.001), especially among Asian patients, of whom 98.4% in the dialysis group and 100% in the transplanted group were from the UK. White patients and patients from other racial backgrounds in both treatment groups were more likely to have congenital anomalies of the kidney and urinary tract compared with black patients, who were more likely to have glomerulonephritis as primary renal disease (P < 0.001).
Characteristics of patients initiating dialysis between 2006 and 2013
| All N = 1161, N (%) | White N = 857 (73.8%), N (%) | Black N = 67 (5.8%), N (%) | Asian N = 129 (11.1%), N (%) | Other N = 108 (9.3%), N (%) | |
|---|---|---|---|---|---|
| Age at start of RRT | |||||
| 0–2 years | 312 (26.9) | 239 (27.9) | 10 (14.9) | 32 (24.8) | 31 (28.7) |
| 3–5 years | 112 (9.6) | 82 (9.6) | 6 (9.0) | 12 (9.3) | 12 (11.1) |
| 6–11 years | 349 (30.1) | 246 (28.7) | 28 (41.8) | 38 (29.5) | 37 (34.3) |
| 12–18 years | 388 (33.4) | 290 (33.8) | 23 (34.3) | 47 (36.4) | 28 (25.9) |
| Male gender (%) | 669 (57.6) | 497 (58.0) | 37 (55.2) | 68 (52.7) | 67 (62.0) |
| Country** | |||||
| Belgium | 82 (7.1) | 56 (6.5) | 0 (0) | 0 (0) | 26 (24.1) |
| Czech Republic | 56 (4.8) | 55 (6.4) | 0 (0) | 1 (0.8) | 0 (0) |
| Greece | 56 (4.8) | 47 (5.5) | 0 (0) | 1 (0.8) | 8 (7.4) |
| Netherlands | 118 (10.2) | 91 (10.6) | 13 (19.4) | 0 (0) | 14 (13.0) |
| Portugal | 116 (10.0) | 95 (11.1) | 20 (29.9) | 0 (0) | 1 (0.9) |
| Slovakia | 37 (3.2) | 28 (3.3) | 0 (0) | 0 (0) | 9 (8.3) |
| Switzerland | 17 (1.5) | 14 (1.6) | 2 (3.0) | 0 (0) | 1 (0.9) |
| UK | 679 (58.5) | 471 (55.0) | 32 (47.8) | 127 (98.4) | 49 (45.4) |
| Primary renal disease** | |||||
| CAKUT | 424 (36.5) | 324 (37.8) | 19 (28.4) | 43 (33.3) | 38 (35.2) |
| Glomerulonephritis | 171 (14.7) | 122 (14.2) | 20 (29.9) | 12 (9.3) | 17 (15.7) |
| Cystic kidneys | 104 (9.0) | 81 (9.5) | 3 (4.5) | 12 (9.3) | 8 (7.4) |
| Hereditary nephropathy | 100 (8.6) | 75 (8.8) | 2 (3.0) | 14 (10.9) | 9 (8.3) |
| Ischaemic renal failure | 28 (2.4) | 18 (2.1) | 3 (4.5) | 1 (0.8) | 6 (5.6) |
| HUS | 44 (3.8) | 38 (4.4) | 2 (3.0) | 1 (0.8) | 3 (2.8) |
| Metabolic disorders | 26 (2.2) | 18 (2.1) | 1 (1.5) | 7 (5.4) | 0 (0) |
| Vasculitis | 20 (1.7) | 17 (2.0) | 2 (3.0) | 1 (0.8) | 0 (0) |
| Miscellaneous | 86 (7.4) | 69 (8.1) | 7 (10.4) | 3 (2.3) | 7 (6.5) |
| Unknown/missing | 158 (13.6) | 95 (11.1) | 8 (11.9) | 35 (27.1) | 20 (18.5) |
| Treatment modality at start of RRT | |||||
| HD | 451 (38.8) | 314 (36.6) | 35 (52.2) | 54 (41.9) | 48 (44.4) |
| PD | 704 (60.7) | 537 (62.7) | 32 (47.8) | 75 (58.1) | 60 (55.6) |
| Unknown/missing | 6 (0.5) | 6 (0.7) | 0 (0) | 0 (0) | 0 (0) |
| Time on RRT at time measurements | |||||
| 0–0.99 years | 910 (78.4) | 681 (79.5) | 48 (72.2) | 94 (73.1) | 87 (80.2) |
| 1–2.99 years | 205 (17.6) | 143 (16.6) | 16 (24.0) | 30 (23.3) | 16 (14.8) |
| ≥3 years | 46 (4.0) | 34 (3.9) | 3 (3.8) | 5 (3.6) | 5 (5.0) |
| Mean Hb (g/dL) (SD) | 11.12 (2.0) | 11.15 (2.0) | 11.21 (1.8) | 10.96 (1.8) | 11.04 (2.3) |
| Mean Hb SDS (SD) | −2.15 (2.4) | −2.15 (2.4) | −2.21 (2.0) | −2.35 (2.1) | −2.29 (2.6) |
| Mean phosphorus (mg/dL) (SD) | 5.16 (1.6) | 5.16 (1.6) | 4.77 (1.6) | 5.16 (1.7) | 5.09 (1.6) |
| Mean phosphorus SDS (SD) | +1.08 (3.4) | +1.07 (3.3) | +1.26 (3.5) | +1.21 (3.4) | +0.94 (3.5) |
| Mean systolic BP SDS (SD) | +1.12 (1.5) | +1.07 (1.5) | +1.40 (1.4) | +1.22 (1.5) | +0.99 (1.4) |
| Mean diastolic BP SDS (SD) | +1.06 (1.2) | +1.06 (1.2) | +1.06 (1.1) | +1.16 (1.2) | +1.02 (1.2) |
| Mean BMI (SD) | 17.96 (2.13) | 18.01 (2.16) | 17.75 (1.65) | 18.08 (2.42) | 17.59 (1.84) |
**P < 0.01.
HD, haemodialysis; PD, peritoneal dialysis; CAKUT, congenital anomalies of the kidney and the urinary tract; HUS, haemolytic-uremic syndrome; Hb, haemoglobin.
Patient characteristics patients with a functioning (≥1 year) renal transplant between 2006 and 2013
| All N = 1663, N (%) | White N = 1328 (79.9%), N (%) | Black N = 52 (3.2%), N (%) | Asian N = 176 (10.6%), N (%) | Other N = 107 (6.4%), N (%) | |
|---|---|---|---|---|---|
| Age at start of RRT | |||||
| 0–1 years | 419 (25.2) | 333 (25.1) | 11 (21.2) | 50 (28.4) | 25 (23.4) |
| 2–5 years | 259 (15.6) | 197 (14.8) | 13 (25.0) | 30 (17.0) | 19 (17.8) |
| 6–11 years | 560 (33.7) | 443 (33.4) | 17 (32.7) | 57 (32.4) | 43 (40.2) |
| 12–19 years | 417 (25.1) | 346 (26.1) | 11 (21.2) | 39 (22.2) | 20 (18.7) |
| Unknown/missing | 8 (0.5) | 8 (0.6) | 0 (0) | 0 (0) | 0 (0) |
| Male gender (%) | 1003 (60.3) | 803 (60.5) | 31 (59.6) | 100 (56.8) | 69 (64.5) |
| Country** | |||||
| Belgium | 80 (4.8) | 54 (4.1) | 0 (0) | 0 (0) | 26 (24.3) |
| Czech Republic | 18 (1.1) | 18 (1.4) | 0 (0) | 0 (0) | 0 (0) |
| Greece | 40 (2.4) | 33 (2.5) | 0 (0) | 0 (0) | 7 (6.5) |
| Netherlands | 122 (7.3) | 98 (7.4) | 12 (23.1) | 0 (0) | 12 (11.2) |
| Portugal | 91(5.5) | 79 (5.9) | 9 (17.3) | 0 (0) | 3 (2.8) |
| Slovakia | 12 (0.7) | 9 (0.7) | 0 (0) | 0 (0) | 3 (2.8) |
| Switzerland | 12 (0.7) | 12 (0.9) | 0 (0) | 0 (0) | 0 (0) |
| UK | 1288 (77.5) | 1025 (77.2) | 31 (59.6) | 176 (100) | 56 (52.3) |
| Primary renal disease** | |||||
| CAKUT | 822 (49.4) | 670 (50.5) | 23 (44.2) | 75 (42.6) | 54 (50.5) |
| Glomerulonephritis | 179 (10.8) | 140 (10.5) | 11 (21.2) | 20 (11.4) | 8 (7.5) |
| Cystic kidneys | 164 (9.9) | 132 (9.9) | 3 (5.8) | 18 (10.2) | 11 (10.3) |
| Hereditary nephropathy | 133 (8.0) | 99 (7.5) | 1 (1.9) | 26 (14.8) | 7 (6.5) |
| Ischaemic renal failure | 35 (2.1) | 30 (2.3) | 0 (0) | 2 (1.1) | 3 (2.8) |
| HUS | 63 (3.8) | 55 (4.1) | 2 (3.8) | 3 (1.7) | 3 (2.8) |
| Metabolic disorders | 63 (3.8) | 51 (3.8) | 0 (0) | 9 (5.1) | 3 (2.8) |
| Vasculitis | 16 (1.0) | 14 (1.1) | 0 (0) | 1 (0.6) | 1 (0.9) |
| Miscellaneous | 101 (6.1) | 80 (6.0) | 7 (13.5) | 7 (4.0) | 7 (6.5) |
| Unknown/missing | 87 (5.2) | 57 (4.3) | 5 (9.6) | 15 (8.5) | 10 (9.3) |
| Treatment modality at start of RRT** | |||||
| HD | 346 (20.8) | 251 (18.9) | 19 (36.5) | 42 (23.9) | 34 (31.8) |
| PD | 800 (48.1) | 635 (47.8) | 25 (48.1) | 93 (52.8) | 47 (43.9) |
| Pre-emptive transplant | 507 (30.5) | 434 (32.7) | 8 (15.4) | 40 (22.7) | 26 (24.3) |
| Unknown/missing | 8 (0.6) | 8 (0.6) | 0 (0) | 0 (0) | 0 (0) |
| Time with functioning | |||||
| transplant | |||||
| 1–2 years | 781 (47.0) | 611 (46.0) | 35 (67.6) | 85 (48.3) | 50 (46.3) |
| 3–4 years | 342 (20.6) | 276 (20.8) | 11 (21.0) | 34 (19.1) | 22 (20.4) |
| 5–6 years | 206 (12.4) | 165 (12.4) | 3 (6.3) | 23 (13.1) | 14 (13.5) |
| ≥7 years | 334 (20.1) | 276 (20.8) | 3 (5.0) | 34 (19.5) | 21 (19.8) |
| Mean Hb (g/dL) (SD)* | 12.46 (2.4) | 12.52 (2.5) | 11.91 (1.7) | 12.01 (1.7) | 12.59 (2.4) |
| Mean Hb SDS (SD) | −1.32 (2.5) | −1.27 (2.6) | −1.79 (1.8) | −1.70 (1.7) | −1.20 (2.6) |
| Mean phosphorus (mg/dL) (SD) | 3.95 (0.9) | 3.94 (0.9) | 4.03 (0.9) | 3.90 (0.9) | 4.1 (0.9) |
| Mean phosphorus SDS (SD) | −0.43 (1.9) | −0.43 (1.9) | −0.45 (1.7) | −0.55 (1.7) | −0.26 (1.9) |
| Mean systolic BP SDS (SD) | +0.57(1.2) | +0.55 (1.2) | +0.64 (1.2) | +0.76 (1.2) | +0.53 (1.1) |
| Mean diastolic BP SDS (SD) | +0.41(0.9) | +0.38 (0.9) | +0.44 (0.9) | +0.58 (0.9) | +0.44 (0.9) |
| Mean BMI (SD) | 21.46 (2.65) | 21.58 (2.66) | 19.89 (2.13) | 21.75 (2.67) | 20.24 (2.50) |
*P < 0.05, **P < 0.01.
HD, hemodialysis; PD, peritoneal dialysis; CAKUT, congenital anomalies of the kidney and the urinary tract; HUS, haemolytic-uraemic syndrome; Hb, haemoglobin.
Mean number of CVD risk factors (95% CI)a
| White patients | Black patients | Asian patients | Other patients | |
|---|---|---|---|---|
| Dialysis | 1.52 (1.40–1.65) | 1.62 (1.40–1.89) | 1.83 (1.64–2.04)* | 1.33 (1.20–1.48) |
| Transplantation | 1.18 (1.09–1.27) | 1.11 (0.96–1.28) | 1.28 (1.13–1.40) | 1.13 (0.94–1.36) |
| White patients | Black patients | Asian patients | Other patients | |
|---|---|---|---|---|
| Dialysis | 1.52 (1.40–1.65) | 1.62 (1.40–1.89) | 1.83 (1.64–2.04)* | 1.33 (1.20–1.48) |
| Transplantation | 1.18 (1.09–1.27) | 1.11 (0.96–1.28) | 1.28 (1.13–1.40) | 1.13 (0.94–1.36) |
*P = 0.05 versus white patients on dialysis.
Adjusted for age at time of measurement (category), sex, mode of RRT, time spent on RRT, country.
Definitions of CVD risk factors in children with ESRD
| Definition | Guideline | |
|---|---|---|
| Anaemia | Hb level below the 5th percentile for age and sex | NKF/KDOQI [21] |
| Hyperphosphataemia | Phosphate level (mg/dL) | European guidelines on prevention and treatment of renal osteodystrophy in children with chronic renal failure [26] |
| 0–2 years >7.4 | ||
| 3–5 years >6.5 | ||
| 6–12 years >5.8 | ||
| 13–19 years >4.5 | ||
| Obesity | BMI class based on age, sex and height adjusted criteria | World Health Organization (0–1 year) [22], International obesity task force (≥2 year) [25] |
| Uncontrolled hypertension | SBP or DBP > P90 (=1.29 SD)a | KDIGO 2012 [24], K/DOQI 2004 [23] |
Hb, haemoglobin; SBP, systolic BP; DBP, diastolic BP; ERBP, European Renal Best Practice position statement guideline 2009; KDIGO, Kidney Disease: Improving Global Outcomes (from: Clinical Practice Guideline for the Management of Blood Pressure in Chronic Kidney Disease 2012); K/DOQI, Kidney Disease Outcomes Quality Initiative; P90, 90th percentile.
The ERBP, ESPN, K/DOQI 2004 and KDIGO 2012 do not have guidelines for BP control in paediatric kidney transplant recipients.
| Definition | Guideline | |
|---|---|---|
| Anaemia | Hb level below the 5th percentile for age and sex | NKF/KDOQI [21] |
| Hyperphosphataemia | Phosphate level (mg/dL) | European guidelines on prevention and treatment of renal osteodystrophy in children with chronic renal failure [26] |
| 0–2 years >7.4 | ||
| 3–5 years >6.5 | ||
| 6–12 years >5.8 | ||
| 13–19 years >4.5 | ||
| Obesity | BMI class based on age, sex and height adjusted criteria | World Health Organization (0–1 year) [22], International obesity task force (≥2 year) [25] |
| Uncontrolled hypertension | SBP or DBP > P90 (=1.29 SD)a | KDIGO 2012 [24], K/DOQI 2004 [23] |
Hb, haemoglobin; SBP, systolic BP; DBP, diastolic BP; ERBP, European Renal Best Practice position statement guideline 2009; KDIGO, Kidney Disease: Improving Global Outcomes (from: Clinical Practice Guideline for the Management of Blood Pressure in Chronic Kidney Disease 2012); K/DOQI, Kidney Disease Outcomes Quality Initiative; P90, 90th percentile.
The ERBP, ESPN, K/DOQI 2004 and KDIGO 2012 do not have guidelines for BP control in paediatric kidney transplant recipients.
Among patients on dialysis, there were no differences across the racial groups in dialysis modality at start of RRT and at time of investigation, nor in mean SDS scores for haemoglobin, phosphorus and BP (Table 1). The majority of the patients (ranging from 72.2% of black patients to 80.1% of other patients) received dialysis treatment for <1 year.
Among patients with a functioning transplant, we found that white patients were more likely to have received a pre-emptive transplant (32.7%) compared with all the other racial groups (black patients 15.4%, Asian 22.7% and other 24.3%, P = 0.002). Time with functioning transplant did not differ significantly across the racial groups, nor did mean SDS for haemoglobin, phosphorus and BP (Table 2).
Prevalence of CVD risk factors
Figure 1 shows the crude prevalence of the four CVD risk factors by racial background. For none of the CVD risk factors did we observe statistically significant differences across racial groups.
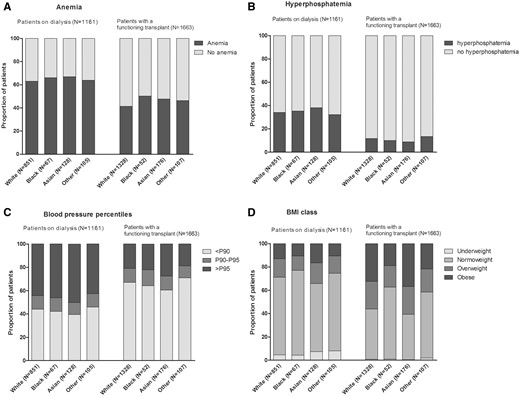
Prevalence of CVD risk factors in the different racial groups. P90/95, 90th/95th percentile.
Association between racial background and CVD risk factors
The results of the GEE analyses are shown in Figure 2 and in Supplementary data, Tables S1 and S2. After adjustment for potential confounders, we found that in the transplant group Asian patients and patients from other racial groups were more likely to develop anaemia compared with white patients [OR 1.50; 95% confidence interval (CI): 1.15–1.96 and OR: 1.45; 95% CI: 1.01–2.07, respectively] (Figure 2A). No significant differences in the risk for hyperphosphataemia were found across the racial groups (Figure 2B).
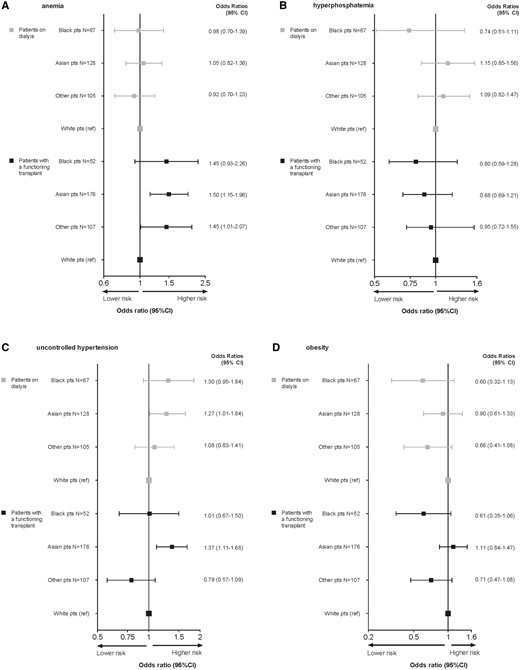
Adjusted* odds ratios (95% CI) for the likelihood of having cardiovascular risk factors in the different racial groups. *Adjusted for age at time of measurement (category), sex, dialysis modality (patients on dialysis), pre-emptive transplantation (patients with renal transplant), time spent on RRT, country.
Asian background was associated with a significantly higher likelihood of uncontrolled hypertension in both the dialysis group (OR: 1.27; 95% CI: 1.01–1.64) and the transplanted group (OR: 1.37; 95% CI: 1.11–1.68) compared with white patients (Figure 2C). Among transplanted patients, a lower risk of being obese was found in black (OR: 0.54; 95% CI: 0.31–0.94) and ‘other’ (OR: 0.60; 95% CI: 0.40–0.90) patients as compared with white patients. As the distribution of racial groups is different across countries, we additionally adjusted the analysis for country and this difference was no longer statistically significant (Supplementary data, Table S2). The sensitivity analyses excluding those patients who were transplanted pre-emptively yielded very similar results when compared with the analyses for the total group of patients.
Number of risk factors
Figure 3 shows the distribution of the number of CVD risk factors across racial groups. Most patients on dialysis had two or more CVD risk factors during the study period, varying from 52.5% of patients from other racial groups to 62.1% of Asian patients. Among transplanted patients, a smaller proportion had multiple CVD risk factors than among dialysis patients. Finally, we compared the mean number of CVD risk factors between the racial groups (Table 3). After adjustment for potential confounders, we found a higher number of CVD risk factors among Asian patients on dialysis with a mean of 1.83 (95% CI: 1.64–2.04) compared with white patients (mean number 1.52, 95% CI: 1.40–1.65).
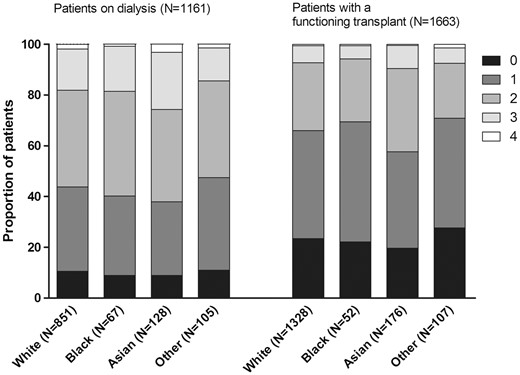
Distribution of number of cardiovascular risk factors across the racial groups.
DISCUSSION
In this European study among children with ESRD, we demonstrated important differences in the prevalence of CVD risk factors across racial groups. Especially, Asian patients seem to be at high risk of modifiable CVD risk factors like uncontrolled hypertension and anaemia, which is in line with the increased overall mortality that we previously found in this group of patients.
The higher prevalence of CVD risk factors in Asian patients is in line with previously reported trends towards more health problems in both adult and paediatric patients from Asian ancestry compared with their white counterparts within the UK. For example, studies have shown overall more coronary heart disease, higher HbA1c levels in children with diabetes and higher admission rates to paediatric intensive care units [31–33]. Remarkably, and in contrast to data from the USA [34, 35], we did not find a higher prevalence of CVD risk factors in black patients within our cohort of European children with ESRD. The explanations for the observed differences between findings from the USA and Europe are unclear. However, it is plausible that these differences may be primarily caused by variations in national contextual factors, such as access to preventive services, and by differences in cultural and lifestyle factors rather than biological factors. Likewise, medication non-adherence might explain the disparities in outcomes, as this is closely associated with low educational attainment, health illiteracy and inadequate patient–physician communication [36, 37].
Moreover, also biological or genetic factors might attribute to the difference in prevalence of CVD risk factors. For instance, racial disparities in haemoglobin levels in children with ESRD have been well established. In particular, African American race has been identified as a significant risk factor for anaemia in children and teenagers on dialysis in the USA [38]. Additionally, a recent study conducted among 565 US children with chronic kidney disease (CKD) found that fewer African American children achieved haemoglobin levels greater than the 5th percentile for age and sex, as recommended by the guidelines for anaemia in CKD [39]. In contrast, in our European cohort, we found that Asian patients and patients from other racial backgrounds, but not black patients, had a higher risk of anaemia compared with their white counterparts. The higher risk of Asian patients might be explained by the relatively high prevalence of haemoglobinopathies such as thalassaemia among adults with an Asian descent [40]. Some studies suggest that ESRD-related factors promoting anaemia such as erythropoietin deficiency, inflammation and hyperparathyroidism could partially explain the racial differences in anaemia prevalence. Studies among US adults suggested that African Americans on haemodialysis, therefore, require higher erythropoietin doses than whites even in the absence of inherited erythrocyte abnormalities [41, 42]. Possibly, this is also true for Asian children and children from other racial backgrounds with a renal transplant.
Asian patients on dialysis and also those with a renal transplant were more likely to have uncontrolled hypertension, i.e. systolic- or diastolic BP equal or higher to the 90th percentile independent of medication use. The overall high prevalence of hypertension among children with ESRD is well known, especially among those treated with dialysis [43]. However, only few studies evaluated the association between racial background and hypertension in this population. Data from the Chronic Kidney Disease in Children Study among 432 US children with CKD [8] revealed that compared with non-black children, black children were 63% and 79% more likely to have elevated systolic and diastolic BP, respectively. In contrast to these findings, we did not find an association between black race and risk of uncontrolled hypertension. Better understanding of the specific pathophysiology of hypertension and the phenomenon of salt sensitivity in black patients might have helped to improve treatment strategies like the choice of anti-hypertensive agents in this patient group in whom diuretics and calcium channel blockers are more effective than anti-hypertensives targeting the renin-angiotensin-aldosterone system [44]. Unfortunately, studies examining hypertension in Asian patients are scarce. Most studies evaluating classical CVD risk factors in adult Asian patients in the USA and abroad found associations similar to those in whites [45]. However, international data show that there is heterogeneity across Asian subgroups with regard to response to therapeutic drugs [46–48]. More research on the biological mechanisms of hypertension in paediatric ESRD patients is therefore required.
In contrast to our findings, a number of reports from the USA have shown that race is correlated with rates of childhood obesity in the general population [49]. In 2009–10, 23.7% of African Americans adolescents (aged 12–19 years) were obese, compared with only 16.1% of whites in the same age group [50]. African American and Hispanic children also have been shown to have higher rates of obesity-related risk factors, such as dyslipidaemia and higher fasting glucose [49]. In our ESRD cohort, however, black patients and patients from other racial backgrounds with a transplant were less likely to be obese compared with white children. After adjusting for country this difference lost statistical significance. To assess potential racial differences within one country, we performed sensitivity analysis for each country separately. This analysis yielded very similar results, indicating that the differences in obesity risk are mainly explained by country factors. This is in line with previous findings from the ESPN/ERA-EDTA Registry [7] and data from the general population [51], which also showed significant variation in the prevalence of overweight and obesity across countries. Potential differences in nutritional and growth management and sociocultural factors between countries might contribute to this variation [52]. Furthermore, even though the BMI classifications for obesity is intended for international use, studies conducted among adults found that the associations between BMI, percentage of body fat and body fat distribution differ across racial groups [53]. In particular, in some adult Asian populations a specific BMI reflects a higher percentage of body fat than in white populations and the relative risk of having at least one CVD risk factor among Asians adults is higher at a lower BMI [54]. However, for the paediatric population such information is unavailable and more research on race-specific BMI cut-off points for overweight and obesity is therefore needed.
Likewise, we found a higher mean number of risk factors in Asian patients on dialysis. In the Bogalusa Heart Study [55] conducted among children and young people from the USA, an increased number of CVD risk factors was associated with the extent of fatty streaks in the aorta and coronary arteries. The results of the current study suggest that Asian children with ESRD are at higher risk for development of early atherosclerosis and premature CVD. This may explain the higher mortality risk found in our previous study among Asian children on RRT [17].
A major strength of our study is the inclusion of four different racial groups, whereas most other studies only distinguished between white and black patients. Furthermore, we included a relatively large number of patients, both on dialysis and with a functioning transplant, with repeatedly measured parameters and from several European countries. However, some limitations of our work need to be acknowledged. First, the numbers of patients from minority groups in our study were relatively small and unequally distributed across countries, especially for Asian patients, of whom 98.4% in the dialysis group and 100% in the transplanted groups came from the UK. We attempted to adjust for these inequalities by correcting for country of residence in multivariable analyses. Secondly, although the Registry includes a comprehensive set of clinical parameters, important information like data on socioeconomic status, lifestyle factors (e.g. nutrition and exercise) and family history were unavailable. Information on lipids was incomplete and data on early cardiovascular abnormalities such as left ventricular dysfunction and increased intima-medial thickness of the carotids were unavailable. Also, data on medication use (e.g. anti-hypertensive medication, EPO or phosphate-binding medication) was limited. We were therefore not able to adjust for medication prescription. In view of the high cardiovascular mortality and prognostic significance of these factors, data collection should be encouraged to further investigate the identified disparities.
In conclusion, we found a relatively high prevalence of modifiable CVD risk factors in Asian children with ESRD, which may partially explain the higher mortality risk previously identified in this population. The disparity most likely reflects a combination of genetic and socioeconomic factors. Early identification and tailored management of these risk factors could potentially improve patient survival. In contrast to studies from the USA, we did not find higher prevalence of CVD risk factors in black patients, suggesting that findings in different racial groups in the USA cannot be extrapolated to Europe, emphasizing the importance of data collection on ethnicity in Europe.
SUPPLEMENTARY DATA
Supplementary data are available online at http://ndt.oxfordjournals.org.
ACKNOWLEDGEMENTS
This article was written by L.A.T. et al. on behalf of the ESPN/ERA-EDTA Registry and the ERA-EDTA Registry, which is an official body of the ERA-EDTA (European Renal Association – European Dialysis and Transplant Association). We would like to thank the patients, their parents and the staff of all the dialysis and transplant units who have contributed data via their national registries and contact persons. We also would like to thank E. Levtchenko, D. Haffner, A. Bjerre and Z. Massy for being members of the ESPN/ERA-EDTA Registry Committee, D. Shtiza, R. Kramar, R. Oberbauer, S. Baiko, A. Sukalo, K. van Hoeck, F. Collart, J.M. des Grottes, D. Pokrajac, D. Roussinov, D. Batinić, M. Lemac, J. Slavicek, K. Vondrak, J.G. Heaf, U. Toots, P. Finne, C. Grönhagen-Riska, C. Couchoud, M. Lasalle, E. Sahpazova, N. Abazi, N. Ristoka Bojkovska, G. von Gersdorff, C. Scholz, B. Tönshoff, K. Krupka, B. Höcker, L. Pape, N. Afentakis, A. Kapogiannis, N. Printza, G. Reusz, Cs Berecki, A. Szabó, T. Szabó, Zs Györke, E. Kis, R. Palsson, V. Edvardsson, B. Gianoglio, S. Maringhini, C. Pecoraro, S. Picca, S. Testa, E. Vidal, E. Verrina, A. Jankauskiene, B. Pundziene, V. Said-Conti, S. Gatcan, O. Berbeca, N. Zaikova, S. Pavićević, T. Leivestad, A. Zurowska, I. Zagozdzon, C. Mota, M. Almeida, C. Afonso, G. Mircescu, L. Garneata, E.A. Molchanova, N.A. Tomilina, B.T. Bikbov, M. Kostic, A. Peco-Antic, B. Spasojevic-Dimitrijeva, G. Milosevski-Lomic, D. Paripovic, S. Puric, D. Kruscic, L. Podracka, G. Kolvek, J. Buturovic-Ponikvar, G. Novljan, N. Battelino, A. Alonso Melgar and the Spanish Pediatric Registry, S. Schön, K.G. Prütz, L. Backmän, M. Stendahl, M. Evans, B. Rippe, C.E. Kuenhi, E. Maurer, G.F. Laube, S. Tschumi, P. Parvex, A. Hoitsma, A. Hemke, all centres participating in the RichQ study, and R. Topaloglu, A. Duzova, D. Ivanov, R. Pruthi, F. Braddon, S. Mannings, A. Cassula, and M.D. Sinha for contributing data to the ESPN/ERA-EDTA Registry.
CONFLICT OF INTEREST STATEMENT
The results presented in this article have not been published previously in whole or part, except in abstract format.
REFERENCES
The National Kidney Foundation Kidney Disease Outcomes Quality Inititative (NKF KDOQI). Clinical Practice Guidelines on Hypertension and Antihypertensive Agents in Chronic Kidney Disease


Comments