


Abstract
In the field of chronic kidney disease, global clinical practice guidelines have been developed and implemented with a view to improving patient care and outcomes. The attainment of international and European guideline targets for haemodialysis patients in European countries has not been audited recently. Hence, we sought to establish whether the attainment of the targets set out in guidelines and inappropriate care are similar across European countries and whether inter-country differences are related to disparities in national healthcare expenditures (as a percentage of gross domestic product) and/or the nephrologist workforce per capita.
EURODOPPS is the European part of an international, prospective study of a cohort of adult, in-centre, haemodialysed patients. For the current project, 6317 patients from seven European countries were included between 2009 and 2011. Data on laboratory test results and medication prescriptions were extracted from patient records, in order to determine the overall percentage of patients treated according to the international guidelines on anaemia, dyslipidaemia, metabolic acidosis and mineral bone disease. Data related to macroeconomic indices were collected from World Health Organization database and World Bank stats.
Attainment of the targets set in international guidelines was far from complete; only 34.1% of patients attained their target blood pressure and 31.2% attained their target haemoglobin level. Overall, only 5% of the patients attained all of the studied guideline targets. We observed marked inter-country differences in levels of guideline uptake/application and the use of pharmacological agents. The levels of national healthcare expenditures and nephrologist workforce were not correlated with the percentage of patients on-target for ≥50% of the studied variables or with inappropriate care (except for anaemia).
Our analysis of EURODOPPS data highlighted a low overall level of guideline target attainment in Europe and substantial differences between European countries. These inter-country differences did not appear to be linked to macroeconomic determinants.
INTRODUCTION
Non-communicable diseases [including chronic kidney disease (CKD)] have surpassed communicable diseases as the most common causes of morbidity and premature mortality worldwide [1]. The prevalence of renal replacement therapy (RRT) for end-stage renal disease (ESRD) has been increasing in all countries with reported registry data. ESRD is associated with high costs and poor patient outcomes, including higher morbidity and mortality rates, and impaired quality of life relative to the general population [2]. In recent years, a number of guidelines have been published to encourage nephrologists to develop an integrated approach to the diagnosis and management of disorders related to CKD with a view to improving patient care and outcomes. The National Kidney Foundation manages the Kidney Disease: Improving Global Outcomes (KDIGO) initiative, which is aimed at improving the care and outcomes of kidney disease patients worldwide through the development and implementation of global clinical practice guidelines [3, 4]. In parallel, the European Renal Association and the European Dialysis and Transplant Association have initiated the European Renal Best Practice (ERBP) initiative [5].
Tentori et al.’s study of US patients on chronic haemodialysis (HD) demonstrated that lower mortality was significantly associated with higher adherence to the clinical targets specified by the Kidney Disease Outcomes Quality Initiative (KDOQI) guidelines [6]. Furthermore, the dialysis unit practice score, developed as part of the international Dialysis Outcomes and Practice Patterns Study (DOPPS), was strongly linked to outcomes [7]. However, it remains to be established whether the uptake and attainment of the targets set out in guidelines differ from one European country to another, and whether greater healthcare expenditure within each country results in better adherence to guidelines.
Furthermore, audits based on the attainment of guideline targets could notably provide a country-level indicator of the quality of renal care. DOPPS has already adopted a guideline-based audit for monitoring overall and country-level changes over time in renal care. The DOPPS Practice Monitor (DPM), launched in 2010, now provides annual reports on trends in clinical dialysis practice in the USA, Germany and Canada. However, the attainment of international and European guideline targets for HD patients across numerous European countries has not been audited recently. Hence, we sought to (i) describe the attainment of guideline targets and inappropriate care in a number of European countries and (ii) to relate any disparities in attainment and inappropriate care to country-level differences in healthcare expenditures [as a percentage of gross domestic product (GDP)] and the nephrologist workforce per capita.
To achieve this objective, we analysed DOPPS data from seven European countries from 2009 to 2011, in comparing attainment of targets recommended in KDIGO and ERBP guidelines in place during the study’s follow-up period. We focused on targets that can be modulated by pharmacological agents: hypertension, anaemia, dyslipidaemia, metabolic acidosis, and mineral and bone disorders (MBDs).
MATERIALS AND METHODS
Data collection
The DOPPS is an international, prospective study of a cohort of adult (aged 18 years and above) in-centre HD patients. Details of the study design have been reported elsewhere [8]. The present study included EURODOPPS participants from seven European countries (Belgium, France, Germany, Italy, Spain, Sweden and the UK) from DOPPS phase 4 (2009–11). The study was approved by a central independent ethics committee and by local independent ethics committees.
Data on demographics and comorbidities were recorded at study entry. Data on laboratory test values, medications, dialysis and clinical outcomes were extracted from patient records. Laboratory test values were determined according to local practice. Data on blood pressure, haemoglobin (Hb), serum phosphate and calcium levels, serum parathyroid hormone (PTH), bicarbonate and low-density lipoprotein cholesterol (LDL-C) concentrations were recorded as measured as frequently as once per month, whereas data on and serum 25-hydroxyvitamin D levels were recorded once every 4 months (although more frequent measurements were available). Data were reported regarding whether a patient was prescribed at the end of each study month particular CKD-related medications [e.g. erythropoiesis stimulating agents (ESAs), phosphate binders and vitamin D]. The known absence of ESA use was also specifically recorded. Information on the use of other medications (such as sodium bicarbonate and antihypertensive medications) was collected every 4 months. If no information on use of the latter medications was mentioned, it was assumed that patients were not receiving them.
For each investigated factor, we selected the target ranges from the international guidelines (KDOQI or KDIGO) and (if available) European guidelines (ERBP) at the time of the study (2009–11):
A blood pressure value (mean of three measurements) <140/90 mmHg (pre-HD) and <130/80 mmHg (post-HD) [9].
An Hb level between 11 and 12 g/dL when receiving ESA therapy [12].
A serum bicarbonate concentration >22 mmol/L [13].
A serum LDL-C level <2.6 mmol/L (<100 mg/dL) [14].
‘Inappropriate care’ was defined as the absence of drug prescription in an over- or under-target patient, or a patient being over-target but still receiving medication (see Table 1 for detailed definitions).
Definition of clinical targets, clinical biochemical targets and ‘inappropriate care’
| Targets | Definition of ‘inappropriate care’ | |
|---|---|---|
| CKD-MBDs [10, 11] | 25-hydroxyvitamin D level >30 ng/mL | A mean serum 25-hydroxyvitamin D <30 ng/mL (75 mmol/L) and the absence of treatment with ergocalciferol or cholecalciferol |
| A serum phosphate level between 3.5 and 5.5 mg/dL | ||
| An intact PTH level between 150 and 600 pg/mL | A mean serum phosphate level >1.76 mmol/L (5.5 mg/dL) and the absence of treatment with phosphate binders | |
| A serum calcium level between 8.4 and 10.2 mg/dL | ||
| Acidosis [13] | A serum bicarbonate concentration >22 mmol/L | A mean serum bicarbonate level <22 mmol/L and the absence of oral bicarbonate supplementation |
| Hypertension [9] | A mean of three blood pressure measurements <140/90 mmHg (pre-HD) and <130/80 mmHg (post-HD) | Mean pre-HD blood pressure >140/90 mmHg or mean post-HD blood pressure >130/80 mmHg, and the absence of antihypertensive medication prescription |
| Anaemia [12] | A serum Hb level between 11 and 12 g/dL when receiving ESA therapy | A mean Hb concentration <9 g/dL and the absence of treatment with an ESA; Hb levels >13 g/dL and the use of treatment with an ESA |
| Dyslipidaemia [14] | An LDL-C level <2.6 mmol/L (<100 mg/dL) | A mean LDL-C level >100 mg/dL (>2.59 mmol/L) and the absence of LDL-lowering treatment |
GDP and the physician workforce
For each European country, we assembled data on GDP (in US dollars), GDP per capita, healthcare expenditure as a percentage of GDP, the number of physicians per capita and the number of nephrologists per capita. GDP estimates were based upon data published for the year 2010 by the International Monetary Fund and the World Bank [15]. By adjusting for purchasing product parity (PPP), GDP can be used as a guide to inter-country differences in living standards. Hence, GDP (PPP) per capita is often considered to be a key indicator of a country’s standard of living [15]. Healthcare expenditure as a percentage of GDP provides information on the level of resources channelled to health, relative to a country’s total wealth. Data were derived from World Health Organization (WHO) database at the study period [16].
The physician workforce reflects the number of medical doctors providing direct patient care, whether as primary care physicians or as specialists (such as paediatricians, obstetricians/gynaecologists, psychiatrists, surgeons and, of course, nephrologists). This indicator was expressed per 1000 inhabitants, data were derived from WHO database [16]. The nephrologist workforce was derived from the data published by Bello et al. [17].
Analyses
In EURODOPPS, the variable of interest (e.g. the Hb level) and the determinants (e.g. age) were measured once or several times in each individual. Observations for an individual and within a centre are correlated. We used multinomial generalized estimating equation models to estimate (i) the prevalence of patients below, within and above the target levels, and (ii) the prevalence of medication use. This enabled us to correct for within-patient variability and to weight the analyses by the number of measurements that a given patient had contributed to the study. Multivariable, linear mixed-model analyses were used to determine mean levels and adjust them for inter-country differences in confounding factors and medication use.
The analyses were adjusted for country; the UK was chosen (at random) as the reference country.
Analyses showing the mean values of the outcome measures by country were either unadjusted or adjusted for age, gender, ethnic origin (Caucasian, African, Asian, other), smoking (never, active, former for <1 year, former for >1 year, unknown status), diabetes and hypertension (where mentioned as comorbidities). We also adjusted for medication use, in order to check whether inter-country differences (or lack of differences) in analyte levels were mediated by differences in prescriptions. For hypertension, this meant adjusting for the number of antihypertensive medications and the different types of anti-hypertensive drugs. For phosphate, we corrected for the number of phosphate binders taken and whether or not the binders were based on calcium or not. For Hb levels, we adjusted for ESA and iron use. For bicarbonate levels, we adjusted for bicarbonate supplementation. For 25-hydroxyvitamin D and PTH, we adjusted for vitamin D and/or cinacalcet supplementation. Lastly, we adjusted the LDL-C data for statin use.
We present standardized betas (rather than regular betas) so as to facilitate inter-parameter comparisons.
The relationships between the percentage of patients on-target for 50% or more of the variables with GDP (PPP) per capita, healthcare expenditure (per capita and as a percentage of GDP) and medical workforce level were assessed by calculating Spearman’s rank correlation coefficient. Similarly, the relationship between the percentage of inappropriate care for each target and macroeconomic determinants were assessed by calculating Spearman’s rank correlation coefficient.
The threshold for statistical significance was set to P < 0.05. All statistical analyses were performed using SAS software (version 9.3).
RESULTS
A total of 6317 patients from seven European countries were included in the present study. The patients’ characteristics are summarized in Table 2. The great majority of the patients were of Caucasian origin (with a lowest value of 81.4% in the UK). About one-third of the patients were diabetic, with the highest frequencies in Belgium, Germany and Sweden (>41%) and the lowest frequency in Italy.
Baseline patient characteristics in each country
| All | Belgium | France | Germany | Italy | Spain | Sweden | UK | |
|---|---|---|---|---|---|---|---|---|
| Number of centres | 19 | 17 | 21 | 20 | 20 | 20 | 18 | |
| Number of patients | 6317 | 866 | 804 | 971 | 917 | 1073 | 880 | 806 |
| Age in years; median (interquartile range) | 68 (56–77) | 72 (61–79) | 67 (57–78) | 70 (58–77) | 71 (60–78) | 67 (53–76) | 66 (56–77) | 64 (51–74) |
| Time on dialysis, in years; median (interquartile range) | 1.5 (0.3–4.7) | 1.5 (0.4–3.9) | 1.8 (0.4–5.5) | 1.4 (0.3–4.6) | 1.9 (0.4–5.2) | 1.5 (0.4–4.9) | 1.2 (0.3–4.3) | 1.3 (0.3–4.6) |
| Male (%) | 60.8 | 57.7 | 60.7 | 61.5 | 60.4 | 61.8 | 65.2 | 57.9 |
| Caucasian (%) | 93.5 | 95.5 | 84.2 | 98.3 | 98.2 | 97.4 | 96.3 | 81.4 |
| Diabetes mellitus (%) | 36.5 | 41.5 | 36.7 | 42.2 | 29.4 | 33.3 | 41.4 | 30.9 |
| Smoking (active smokers + former smokers having stopped in the previous 12 months) (%) | 14.4 | 12.7 | 12.1 | 15.0 | 13.4 | 13.8 | 16.5 | 17.4 |
| Physician-diagnosed hypertensiona (%) | 85.3 | 83.0 | 90.4 | 95.2 | 78.7 | 89.1 | 87.2 | 71.3 |
As recorded in the patient’s medical records.
Blood pressure (Figure 1)
In this EURODOPPS phase, at least one blood pressure measurement was available for 96.7% of patients. The mean pre-HD systolic blood pressure was 138 mmHg, and the mean pre-HD diastolic blood pressure was 72 mmHg. Overall, 34.1% of the patients had within-target systolic blood pressure values (Figure 1A). The prescription of antihypertensive medications varied markedly from one country to another. On average, patients were taking 1.64 antihypertensive agents. Whereas, respectively, 40.5% and 49.8% of the patients in Sweden and Germany were taking three or more antihypertensive drugs; this proportion was only 15% in Spain (Figure 1B). There were also large differences in the types of medications prescribed; for example, Germany was the key prescriber of beta blockers, angiotensin-converting enzyme inhibitors and angiotensin receptor blockers. Adjustment for potential confounders or for medications modified some intercountry differences; these two different adjustments accentuated the blood pressure differences for Sweden and Germany (versus the UK) (Figure 1D and E). In terms of inappropriate care, 6.6% of the patients (range 0.83–12.1%) were over-target but were not receiving antihypertensive medications. Furthermore, resistant hypertension (defined as high blood pressure even when three or more antihypertensive agents were being taken) was a significant problem; overall, 12.5% of the patients taking three or more drugs were over-target (range 8.7% in Spain to 18.4% in Sweden) (Figure 1C).
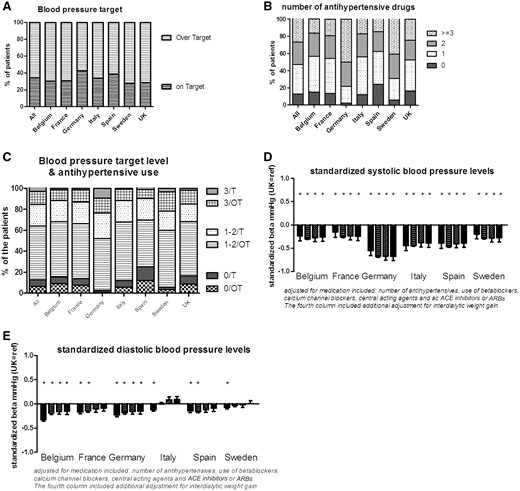
Blood pressure and the use of antihypertensive medications. (A) The percentage of patients on- or over-target; (B) the number of antihypertensive drugs taken; (C) the relationship between the target level and the use of antihypertensive medication (T: on-target for blood pressure; OT: over-target for blood pressure; 0: no antihypertensive medications; 1–2: one or two antihypertensive medications; 3: three antihypertensive medications); (D, E) the difference in mean systolic and diastolic blood pressures by country, relative to the UK: unadjusted (left-most bar for each country), adjusted for age, gender, race, diabetes, hypertension and smoking (second bar from the left), further adjusted for medication (second bar from the right) and further adjusted for interdialytic weight gain (right-most bar). ACE inhibitors: angiotensin-converting enzyme inhibitors; ARBs: angiotensin receptor blockers.
Haemoglobin (Figure 2)
In this EURODOPPS phase, at least one Hb measurement was available for 99.9% of patients. 31.2% of the patients had within-target Hb levels. In the study population as a whole, the mean Hb level was 11.4 g/dL. Again, there were large inter-country differences with respect to being over- or under-target. In Spain, 42.7% of the patients were over-target and 24.8% were under-target. In Italy, these proportions were 30.9% and 32.7%, respectively (Figure 2A). These differences were also somewhat reflected by the prescription of ESAs: 89.1% of the patients in Spain (the second highest prescriber) received an ESA, whereas this was the case for only 84.5% in Italy (the lowest prescriber) (Figure 2B). The differences in Hb levels were only partly mediated by medication use, since Spain still had significantly higher Hb levels after adjustment for comorbidities, ESA use and iron supplementation (Figure 2C).
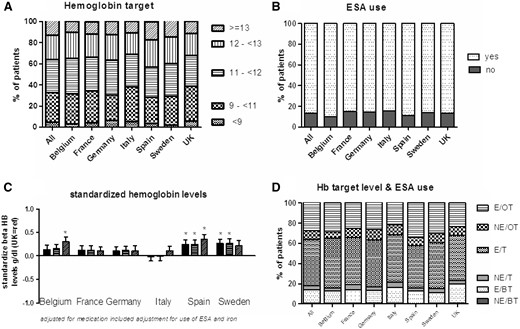
Hb levels and the use of ESAs. (A) The percentage of patients in each Hb range; (B) the percentage of patients on ESAs; (C) the difference in Hb level for each country, relative to the UK: unadjusted (left-hand bar for each country), adjusted for age, gender, race, diabetes, hypertension and smoking (middle bar), and further adjusted for ESA and iron use (right-hand bar); (D) the relationship between the Hb target level and the use of ESAs (E: ESA use; NE: no ESA use; OT: over-target for Hb levels; T: on-target for Hb levels; BT: below-target for Hb levels).
Only 0.71% of the patients (range 0.36% in Spain to 0.98% in the UK and France) were below-target (<9 g/dL) and not taking an ESA. Of the patients, 13.4% (range 10.1–18.5%) could be considered as ESA-resistant, since medication with ESAs had not enabled them to attain their Hb target. Of the patients, 27.4% were over-target for Hb (>12 g/dL), and were taking an ESA. This percentage was still 8.9% (range 6.3% in Italy to 13.4% in Spain) among those with Hb levels over 13 g/dL (Figure 2D).
LDL-C (Figure 3)
LDL-C levels were available in 60.3% of the patients. The highest proportions of missing data were observed in the UK (78.2%), Sweden (47.3%) and Italy (33%). The mean LDL-C level was 81.3 mg/dL, and 73% of the population was below-target (<100 mg/dL) (Figure 3A). Patients in France had significantly lower LDL-C levels than patients in the UK, and this difference persisted after adjustment for confounding factors and statin use (Figure 3C). Around 50% of the study population was being treated with statins. The lowest rate of statin agent use was observed in Italy (<30%) and the highest rate was observed in the UK (60%) (Figure 3B). Overall, 16.3% of the patients (range 8.8–24.7%) were over-target but were not taking statins, whereas 32.1% (range 26–44.8%) were not taking statins but were on-target (Figure 3D).
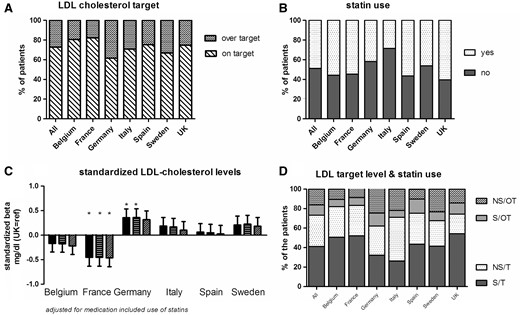
LDL-C levels and the use of statins. (A) The percentage of patients on- or over-target; (B) the percentage of patients on statins; (C) the difference in LDL-C level in each country, relative to the UK: unadjusted (left-hand bar for each country), adjusted for age, gender, race, diabetes, hypertension and smoking (middle bar), and further adjusted for statin use (right-hand bar); (D) the relationship between the LDL-C target and the use of statins (S: statin use; NS: no statin use; OT: over-target for LDL-C; T: on-target for LDL-C).
Bicarbonate (Figure 4)
Serum bicarbonate levels were available for 71.7% of the patients. The highest proportions of missing data were observed in Italy (62.5%), Germany (33%), Spain (33%) and Sweden (33%). The mean bicarbonate level was 23.3 mmol/L. Of the study population, 33% had a serum bicarbonate level <22 mmol/L (Figure 4A). It is noteworthy that the bicarbonate levels do not appear to be a parameter often evaluated in Italy, as revealed by a high proportion of missing data. The prescription of bicarbonate supplementation was limited for some countries and even as low as (1.7%) in France, and highest in Sweden with 23.5% (Figure 4B). In terms of inappropriate care, 30% of the study population had a serum bicarbonate level <22 mmol/L but were not receiving oral bicarbonate supplementation (Figure 4D).
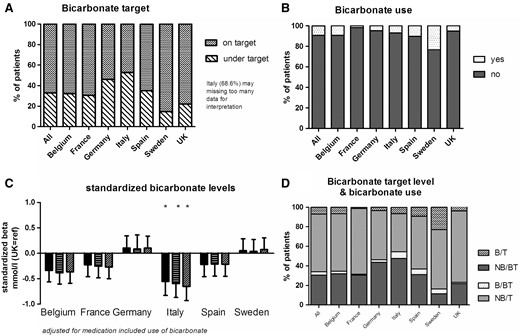
Bicarbonate levels and the use of bicarbonate supplementation. (A) The percentage of on- or under-target patients; (B) the percentage of patients with bicarbonate supplementation; (C) the difference in bicarbonate level in each country, relative to the UK: unadjusted (the left-hand bar for each country), adjusted for age, gender, race, diabetes, hypertension and smoking (middle bar), or further adjusted for bicarbonate supplementation (right-hand bar); (D) the relationship between the target bicarbonate level and the use of bicarbonate supplementation (B: bicarbonate supplementation; NB: no bicarbonate supplementation; T: on-target for bicarbonate levels; BT: below-target for bicarbonate levels).
CKD-MBDs
Phosphate (Figure 5)
At least one phosphate measurement was available for 98.7% of the patients. The mean phosphate level was 4.9 mg/dL, and 51.3% of the patients were on-target (country range 46–57.2%). Although patients in France were more likely to be below-target (25.4%) than those in other countries, many of the patients in Germany were above-target (45.3%) (Figure 5A). Treatment tended to be more aggressive in France: 24.3% of the French patients were on two or more phosphate binders, whereas this proportion was 17.9% in Germany and just 6.7% in the UK. All countries prescribed phosphate binders significantly more than the UK (Figure 5B). Moreover, there were differences in the type of phosphate binder prescribed; calcium-based phosphate binders were preferred to non-calcium-based binders in Belgium, Germany and the UK, whereas non-calcium-based binders were strongly preferred in Italy and Sweden (Figure 5C and D). However, adjustment of the phosphate levels for the type and number of binders did not dramatically change the differences in mean levels of phosphate, which were significantly higher in Germany than in the other countries (Figure 5E). When considering inappropriate care, about 10.5% (range 5.4–14.8%) of all patients were below-target for phosphate but were still taking phosphate binders. Furthermore, 3.6% (range 1.8–6.5%) of the patients were above target levels but were not receiving phosphate binders, whereas 28% were above target levels but were treated with phosphate binders (Figure 5F).
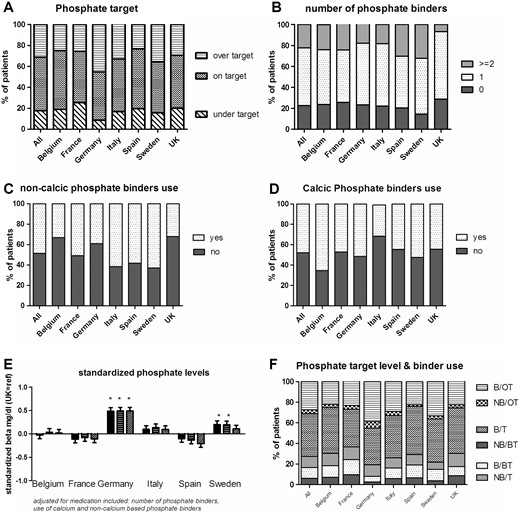
Phosphate levels and the use of phosphate binders. (A) The percentage of patients on- or over-target; (B) the number of phosphate binders; (C, D) the percentages of patients on non-calcium-based and calcium-based phosphate binders; (E) the difference in phosphate level in each country, relative to the UK, unadjusted (the left-hand bar for each country), adjusted for age, gender, race, diabetes, hypertension and smoking (middle bar), and further adjusted for phosphate binder use (right-hand bar); (F) the relationship between the target level and phosphate binder use (B: binder use; NB: no binder use; OT: over-target; T: on-target for phosphate levels; BT: below-target for phosphate levels).
PTH, 25-hydroxyvitamin D and calcium (Figure 6)
In this EURODOPPS phase, at least one calcium measurement was available for 91.5% of the patients and at least one PTH measurement was available in 96.9%. The median PTH level was 197.5 pg/mL and 56.2% of the study population had a serum PTH level between 150 and 600 pg/mL (Figure 6A). Of note, 29.1% of the on-target patients were not receiving any PTH-controlling medications. There was also a wide range in the proportion of patients receiving cinacalcet (range 9.2% in Belgium to 23.9% in Spain) (Figure 6G).
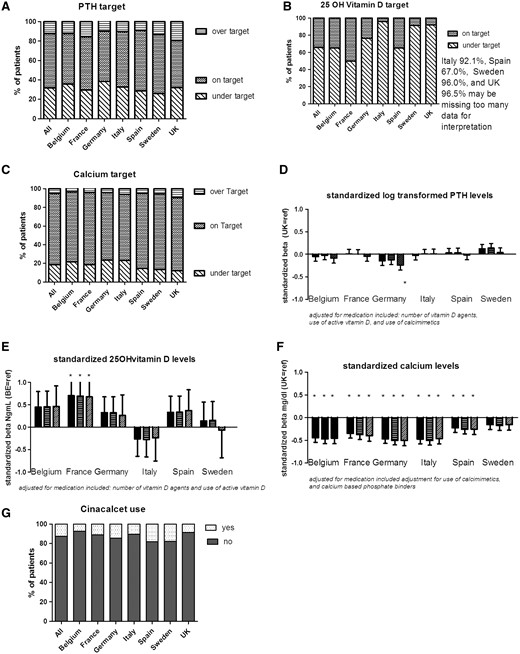
PTH, 25-hydroxyvitamin D and calcium levels, and vitamin D and cinacalcet supplementation. (A–C) The percentage of patients on- or over-target for PTH, 25-OH vitamin D and calcium, respectively; (D–F) the difference in log-transformed PTH, 25-hydroxy vitamin D and calcium levels in each country, relative to the UK: unadjusted (the left-hand bar for each country), adjusted for age, gender, race, diabetes, hypertension and smoking (middle bar), and further adjusted for vitamin D and cinacalcet, vitamin D only, cinacalcet and calcium-based phosphate binders, respectively (right-hand bar); (G) the percentages of patients on cinacalcet.
Serum 25-hydroxyvitamin D was recorded on a regular basis in Belgium and France only, and was not available for the majority of patients in Sweden (96.0%), the UK (96.5%) and Italy (91.6%). Proportions of missing data were also high in Spain (66.7%) and Germany (35.8%). In countries for which this information was available, most patients (65.7%) were below-target. However, this proportion varied markedly from one country to another (range 49.6% in France to over 90% in Sweden, the UK and Italy) (Figure 6B). Overall, 35% of the study population were not receiving vitamin D supplementation, 25.8% of the patients with a mean serum 25-hydroxyvitamin D below 30 ng/mL had not been prescribed vitamin D supplements, whereas 11% of on-target patients had vitamin D supplementation.
The mean calcium level was 8.97 mg/dL. Calcium levels were relatively high in the UK (above-target: 9.5%; on-target: 78.2%), and low in Italy and Germany (23.1% and 23.4%, respectively, being below-target) (Figure 6C). Adjustment for the use of calcimimetics or calcium-based phosphate binders did not affect the results (Figure 6F).
Overall attainment (Figure 7)
About 5% of the patients were on-target for all six variables (blood pressure, Hb, calcium, phosphate, PTH and bicarbonate), whereas 7% were off-target for all six. Some 57% of the patients were on-target for 50% or more of the guidelines. There were inter-country differences in the proportion of on-target patients. In Germany, 53% of the patients were on-target for 50% or more of the guidelines, while the proportion was 64% in Spain (Figure 7).
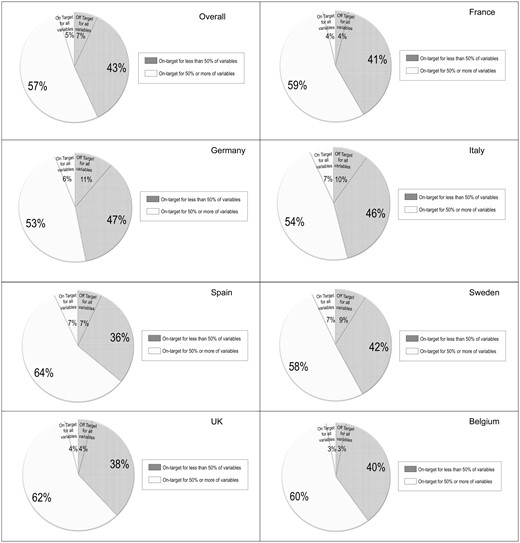
Percentage of patients attaining various guidelines (blood pressure and levels of Hb, phosphate, PTH, calcium and bicarbonate) by country. The white segment indicates the proportion of patients on-target for 50% or more of the variables (including the proportion of patients meeting all the treatment targets), whereas the grey/hatched segments indicates the proportion of patients on-target for less than 50% of the variables (including the proportion of patients not meeting any of the treatment targets.
There were no correlations between the percentage of patients on-target for 50% or more variables with GDP (PPP) per capita (US dollars) (P = 0.401), GDP spent on healthcare (US dollars) (P = 0.436), healthcare expenditure as a percentage of GDP (P = 0.673), the number of physicians per thousand population (P = 0.804) and the number of nephrologists per 1000 ESRD patients (P = 0.406) (Table 3).
The percentage of patients attaining various guideline targets, the percentage of patients with inappropriate care, the healthcare expenditure and physician workforces by country
| Belgium | France | Germany | Italy | Spain | Sweden | UK | |
|---|---|---|---|---|---|---|---|
| Patients on-target for 50% or more of variablesa (%) | 60 | 59 | 53 | 54 | 64 | 58 | 62 |
| Inappropriate care for hypertension (%) | 9.0 | 7.3 | 0.8 | 5.5 | 12 | 3.6 | 9.0 |
| Inappropriate care for anaemia (%) Hb <9 g/dL and the absence of treatment with an ESA | 0.7 | 1.0 | 0.4 | 0.6 | 0.5 | 0.8 | 1.0 |
| Inappropriate care for dyslipidaemia (%) | 10 | 8.8 | 24.7 | 22.4 | 9.5 | 22.3 | 16.1 |
| Inappropriate care for acidosis (%) | 31.0 | 30.2 | 41.9 | 45.2 | 30.0 | 10.5 | 20.2 |
| Inappropriate care for phosphate (%) | 3.3 | 6.5 | 1.8 | 3.0 | 3.3 | 2.3 | 5.8 |
| GDP (PPP) per capita (US dollars) [15] | 43 992 | 39 678 | 47 268 | 35 897 | 34 527 | 46 420 | 41 325 |
| GDP per capita spent on healthcare (US dollars) [16] | 5093 | 4864 | 5006 | 3155 | 2581 | 5680 | 3598 |
| Healthcare expenditure (percentage of GDP) [16] | 10.5 | 11.6 | 11.6 | 9.3 | 9.6 | 9.6 | 9.6 |
| Number of physicians (per 1000 population) [16] | 3.8 | 3.4 | 3.9 | 3.8 | 4.9 | 3.9 | 2.8 |
| Number of nephrologists (per 1000 ESRD patients) [17] | 23 | 20 | 28 | 94 | 49 | 23 | 10.3 |
Variables included blood pressure and levels of Hb, phosphate, PTH, calcium and bicarbonate.
Although Germany had the lowest percentage of patients on-target for 50% or more variables, it was one of the countries with the highest healthcare expenditure as a percentage of GDP (11.6%) and had a moderate nephrologist workforce (28 per 1000 ESRD patients). It was noteworthy that the UK [with the lowest nephrologist workforce (10.3 per 1000 ESRD patients) and one of the lowest healthcare expenditures as a percentage of GDP (9.6%)] had a high percentage (62%) of patients on-target for 50% or more of variables.
In the same line, there was no correlation between the majority of inappropriate care and the macroeconomic determinants except for inappropriate care for anaemia (Hb <9 g/dL and the absence of treatment with an ESA), which was negatively correlated with the number of physicians per 1000 general population (r = −0.771, P = 0.043) and nephrologist workforce level (r = −0.836, P = 0.019), corresponding to an augmentation of the percentage of inappropriate care for anaemia when physicians and nephrologists workforce decreased. However, the percentage of inappropriate care for anaemia is very low, not exceeding 1%.
DISCUSSION
In a large, representative population of EURODOPPS HD patients in seven European countries, we evaluated the attainment of the targets set in international guidelines on hypertension, anaemia, dyslipidaemia, metabolic acidosis and CKD-MBD published during DOPPS phase 4 (2009–11). This study is the first to have audited the attainment of these guideline targets in a number of European countries. Our results emphasize the importance of optimizing the care of HD patients in Europe, since target attainment was far from complete and varied markedly from one European country to another.
Indeed, the majority of renal care audits have been performed at the country level—as in periodic centre-level audits performed in the UK, for example. It is important to assess the attainment of guideline targets because European healthcare systems and healthcare expenditure (as a percentage of GDP) vary from country to country [17].
Overall attainment of targets recommended in guidelines
The first main finding of the present survey is that the attainment of targets recommended in important guidelines is far from complete in HD patients; only 5% (range 3–7%) were on-target for all six variables, and 7% (range 4–11%) were off-target for all variables. Each guideline will be associated with specific barriers to implementation, including lack of awareness, lack of agreement and the prevention of implementation by factors related to the patient, the guideline itself or the environment [18–21].
In the field of CKD, it is difficult to create guidelines based on strong scientific evidence. This might affect the extent to which clinicians agree with and adopt a given guideline [22]. In HD patients, there is a lack of high-quality, interventional clinical trials with hard endpoints (such as mortality or cardiovascular events). For example, many of the pharmacological interventions that can influence phosphate, calcium and PTH levels (such as oral treatment with phosphate binders, vitamin D or cinacalcet) are associated with a decrease in biological parameters related to bone and mineral metabolism. However, it is not known whether or how these modifications affect morbidity and mortality. Given the lack of trials in HD patients, the KDIGO and ERBP recommendations have been graded; accordingly, few recommendations are based on strong evidence and most are based on lower levels of evidence. Hence, if a physician believes that a guideline will not lead to an improved outcome, he/she will be less likely to adopt and implement it. Indeed, guidelines based on strong evidence are more likely to be put into practice [23]. This may imply that the persistently low number of randomized, controlled trials in the field of CKD [24] weakens uptake by clinicians and thus may explain our results.
Another explanation for the low percentage of on-target patients may be related to difficulties in getting a patient within the target range. The coexistence of several comorbidities complicates the treatment of HD patients. For example, CKD is often associated with resistant hypertension [25]. In the present study, 12.5% of the patients were taking three or more antihypertensive agents but still had hypertension. Likewise, resistance to the effect of ESAs is a common problem when seeking to manage anaemia in HD patients. A lack of responsiveness to ESAs has been linked to higher risks of cardiovascular events and mortality [26]. We found that more than 10% of the study population was being treated with ESAs but had persistently below-target Hb levels. Physicians may, therefore, believe that they are unable to attain the target set in the guidelines.
A further explanation relates to the large number of medications being taken by HD patients [27, 28]. In a recent review of medications in HD patients, St Peter stated that the average number of prescribed and over-the-counter medications being taken is 10–12, and the average number of pills per day is 19 [27]. An association between a high pill burden and low adherence has been suggested [28]. Drug-related adverse events and poor education about the benefits of treatment may also contribute to poor adherence. For example, phosphate binders (widely prescribed to hyperphosphataemic HD patients) add four to seven pills per day [29] and frequently induce gastrointestinal adverse events. In a recent DOPPS analysis of the association between the pill burden and non-adherence to phosphate binders, 45% patients reported skipping phosphate binders at least once in the previous month. Non-adherence to binder was associated with high serum phosphate levels (>5.5 mg/dL) and PTH levels (>600 pg/mL) [29]. Hence, poor adherence might explain why 28% of the patients prescribed phosphate binders still had high phosphate levels.
Differences between European countries
The study’s second key finding relates to the large disparities in attainment of targets between European countries. These disparities could only be partly explained by differences in confounding factors, medication use and treatment practices.
In each country, the degree of attainment varied with the guideline. One cannot presume that all guidelines will be implemented to a similar extent; even in the highest scoring countries (Spain, Sweden and Italy), only 7% of the study population attained all the targets. Furthermore, Germany was the country with the better overall blood pressure control but the highest LDL-C levels.
These disparities may be due in part to differences in the way renal services are provided, national healthcare and reimbursement systems. Indeed, we found a large difference in the evaluation of serum 25-hydroxyvitamin D levels; this variable was not evaluated in Italy, Spain, Sweden or UK—in contrast to France, Germany and Belgium. One can hypothesize that this is related to inter-country differences in reimbursement policies. Furthermore, drug availability and use varies from one European country to another; even when the European Medicines Agency has approved a pan-European marketing application, a national drug agency can still decide to not authorize local use (as is the case for paricalcitol in France, for example).
We failed to show a correlation between the nephrologist workforce and the percentage of patients on-target, whereas Caskey et al. did find a positive association between the number of whole-time equivalent (WTE) nephrologists and RRT incidence in regions/states in England and Germany, with German states having consistently a higher number of WTE nephrologists pmp as well as a higher RRT incidence than English regions [30]. This study was, however, only looking at two European countries. Bello et al. have recently enhanced disparity according nephrologist workforce among European countries [17]. Until our report, the link between targets attainment and nephrologist workforce had not been evaluated.
In addition, we did not find any correlation between macro-economic indicators and the percentage of patients on-target. In fact, the literature data have even suggested that higher spending on healthcare was not associated with either higher quality dialysis care or lower mortality on dialysis [31, 32]. Indeed, based on renal registries worldwide, Kramer et al. found surprisingly that higher GDP per capita and a higher expenditure were associated with higher 2-year mortality on dialysis [31]. Analysing geographical variation in Medicare in United States, Wennberg et al. [33] reported that compliance with evidence-based practice guidelines exceeds 80% of patients in only eight regions, and in 10 regions, compliance was less than 20%. Thus, it seems that higher spending does not result in more effective care. We have now extended this lack of association to the attainment of guideline targets and inappropriate care in the dialysis population.
Study strengths and limitations
The strength of the present study (and DOPPS itself) is that the attainment of several pharmacologically modulated targets was evaluated simultaneously. We showed for the first time how difficult it is for HD patients to simultaneously attain several targets set in the guidelines; adherence to one guideline does not imply adherence to other guidelines. Few studies have evaluated overall levels of care [6, 7], and most epidemiological studies have evaluated guideline implementation separately. For example, the recent findings from DPM focusing on CKD-MBD showed that PTH levels increased from 2010 to 2014. Likewise, medical directors at US DOPPS dialysis units reported targeting higher PTH levels from 2010 to 2014 following publication of the KDIGO CKD MBD guidelines [34], when very low and very high PTH levels were found to be associated with adverse outcomes [35]. Improving treatment for CKD-MBD is a key issue in HD patients; earlier studies have evaluated the attainment of CKD-MBD guidelines [36] and barriers to implementation [37]. Recently, a German group evaluated the attainment of KDIGO targets for lipid management in a large cohort of CKD patients. The main conclusion was that attainment of these targets requires a substantial increase in the number of patients on statins [38]. In terms of anaemia management, a study of Australian dialysis units showed considerable variability in the achievement of Hb and iron targets. The identified barriers to implementation were lack of knowledge, lack of awareness of the guideline, lack of trust in the guideline, inability to implement the guideline and inability to agree on a uniform unit protocol [39].
The present study has several limitations. First, we did not establish whether poor attainment of targets was associated with poor clinical outcomes, although such attainment is (in theory) one of the best ways to improve outcomes. Secondly, the European and international guidelines on the use of statins and calcimimetics have changed since the study period (2008–11). However, it made sense to study the guidelines in place at that time. With regard to guidelines on lipid levels, our results agree with a recent publication by Schneider et al. (in which only 50% of the population was being treated with a statin) [38]. Furthermore, we chose to study European and international guidelines (rather than sometimes conflicting national guidelines), which enabled us to compare countries. Thirdly, the majority of the guidelines studied here are based on clinical biochemical parameters for which lab methods may vary markedly from one country to another and from one laboratory to another (due to a lack of standardization). For example, a recent crossover study of a dietary intervention observed circadian patterns of serum phosphate changes in CKD patients; levels were consistently lowest in the morning and highest in the middle of the afternoon [40]. Another example is the inter-method variability and the lack of an international standard for PTH assays, for example [41]. Finally, ‘adherence’ to a guideline is difficult to evaluate. For example, a patient may choose not to comply with treatment even after the physician has informed him/her about the recommended target and the associated evidence, and has prescribed medication accordingly. In the present study, we were unable to take patient preferences and adherence into account.
In conclusion, the present study is the first to have provided an overall picture of target and drug prescription attainment in European HD patients based upon recent guidelines. We focused on serious complications related to CKD: hypertension, anaemia, dyslipidaemia, metabolic acidosis and MBDs. Our results highlight the difficulty in attaining targets set in guidelines, and we observed marked disparities between European countries in this respect. These inter-country differences did not seem to be linked to macroeconomic determinants.
ACKNOWLEDGEMENTS
This article was written by S.L., K.J.v.S., F.C., F.T., R.L.P., A.S., K.J.J. and Z.A.M. on behalf of EURODOPPS and the European Renal Association – European Dialysis and Transplant Association (ERA-EDTA) Registry, which is an official body of the ERA-EDTA. The EURODOPPS Initiative is supported by the ERA-EDTA and the DOPPS Programme. The DOPPS Programme is supported by Amgen, Kyowa Hakko Kirin, AbbVie Inc., Sanofi Renal, Baxter Healthcare and Vifor Fresenius Medical Care Renal Pharma, Ltd. Additional support for specific projects and countries is also provided by the ERA-EDTA, Keryx Biopharmaceuticals, Inc., Merck Sharp & Dohme Corp., Proteon Therapeutics, Relypsa and F. Hoffmann-LaRoche Ltd; in Canada by Amgen, BHC Medical, Janssen, Takeda, Kidney Foundation of Canada (for logistics support); in Germany by Hexal, DGfN, Shire, WiNe Institute; for PDOPPS in Japan by the Japanese Society for Peritoneal Dialysis (JSPD). All support is provided without restrictions on publications. Grants are made to Arbor Research Collaborative for Health and not to individual investigators. The clinical fellowships for S.L. are supported by ERA-EDTA. The authors alone are responsible for the reporting and interpretation of EURODOPPS data used in the publication and they do not necessarily represent the decisions or policies of the ERA-EDTA or the DOPPS Programme.
CONFLICT OF INTEREST STATEMENT
None declared.
REFERENCES
World Health Organization. Global Health Observatory Data Repository. Health Expenditure Ratios, by Country. http://apps.who.int/gho/data/view.main.HEALTHEXPRATIODEU (22 July 2016, date last accessed)
Author notes
These two authors contributed equally to this study.


Comments