


Background. Although the diabetic milieu per se, hemodynamic changes, oxidative stress and local growth factors such as angiotensin II (AII) are considered to be mediators in the pathogenesis of diabetic nephropathy, the underlying pathways mediating the changes in glomerular endothelial cells (GECs) are not well understood. Therefore, we investigated changes in the renin-angiotensin system (RAS) components in high glucose (HG)-stimulated GECs and the role of the local RAS in morphological and functional changes in GECs under diabetic conditions.
Methods. We stimulated GECs with 5.6 mM glucose or 30 mM glucose with or without an angiotensin II type I receptor blocker (ARB) in vitro and also performed experiments with Sprague-Dawley rats injected with diluent (n = 16) or streptozotocin [n = 16, diabetes (DM)]. Eight rats from each group were treated with ARB for 3 months in vivo. Real-time polymerase chain reaction, western blot analysis, enzyme-linked immunosorbent assay and immunofluorescent staining using cultured GECs were performed. The permeability of GECs to macromolecules was assessed by measuring the passage of fluorescein isothiocyanate-labeled bovine serum albumin. Morphological changes were also evaluated by scanning and transmission electron microscopy.
Results. There were significant increases in angiotensinogen expression in HG-stimulated GECs along with significant increases in AI and AII levels. Moreover, the expression of heparan sulfate glycosaminoglycans (HS-GAG) assessed by immunofluorescent staining was significantly lower and the permeability to albumin was significantly higher in GECs exposed to HG medium, and ARB treatment significantly abrogated these changes. Upon electron microscopy examination, the mean size of the GEC fenestrae was significantly greater in HG-stimulated GECs and DM rats, and these increases were significantly ameliorated by ARB.
Conclusions. The local RAS within GECs was activated under HG conditions, and this activation may be associated with both an alteration in GEC fenestration and a decrease in HS-GAG, resulting in the development of albuminuria in diabetic nephropathy.
INTRODUCTION
The glomerular filtration barrier consists of three layers: a fenestrated endothelial layer, a glomerular basement membrane (GBM) and podocyte foot processes connected by a slit diaphragm. Traditionally, the GBM and slit diaphragm are proposed to function as a coarse and fine filter, respectively, that contribute to ultimate size-selectivity, whereas the glomerular endothelium serves as a charge-selective barrier, altogether prohibiting permeability to large-sized and anionic-charged albumin [1].
Diabetic nephropathy, the leading cause of end-stage renal disease in many countries, is clinically characterized by proteinuria [2]. Because the underlying pathologic change responsible for proteinuria is the loss of size-selective and/or charge-selective properties of the glomerular filtration barrier, a large number of previous studies have elucidated the structural and functional changes in the glomerular filtration barrier, particularly in podocytes, in diabetic nephropathy [3–5]. In contrast to podocytes, glomerular endothelial cells (GECs) have not attracted much attention in terms of the pathophysiology of proteinuria in diabetic nephropathy. Recently, however, accumulating evidence has indicated that changes in GECs are also associated with the development of proteinuria in diabetic nephropathy [6–8]. GECs are covered by a 200–400-nm-thick protein-rich surface layer, the glycocalyx, and possess numerous circular transcellular fenestrations 60–100 nm in diameter in their normal state [9]. A decrease in the glycocalyx and changes in the size and number of fenestrations have been demonstrated in GECs under diabetic conditions [6–8]. Although the diabetic milieu per se, hemodynamic changes, oxidative stress and local growth factors such as angiotensin II (AII) are considered to be mediators in the pathogenesis of diabetic nephropathy [10–12], the underlying pathways mediating the changes in GECs have not been well understood until recently.
Previous clinical and experimental studies of diabetic nephropathy have shown that blockade of the renin-angiotensin system (RAS) by angiotensin-converting enzyme (ACE) inhibitors or AII receptor blockers reduces proteinuria that cannot be explained merely by their blood pressure-lowering effect [13, 14]. These findings suggest that RAS blockade may have direct effects on various renal cells. AII, the major effector molecule of the RAS, is a powerful direct vasoconstrictor that promotes vascular smooth muscle contraction and induces systemic hypertension [15]. Along with its hemodynamic effects, AII plays an important role in the pathogenesis of various renal diseases, including diabetic nephropathy [10–12]. The intrarenal RAS is activated despite low plasma renin activity in patients with diabetes [16]. In addition, previous studies have found that the local RAS is activated in proximal tubular cells [17], mesangial cells [18, 19], podocytes [20] and GECs [21] under diabetic conditions. To date, however, the role of activated RAS within GECs under diabetic conditions has not been fully explored.
In this study, we investigated changes in the RAS components, including angiotensinogen (AGT), renin, AI, ACE, AII, AII type 1 receptor (AT1R) and AT2R, in GECs exposed to high glucose medium. Morphological changes in GECs were also clarified under diabetic conditions both in vitro and in vivo. Furthermore, the effect of RAS blockade on diabetes-induced changes in GECs was elucidated in high glucose-stimulated GECs and diabetic glomeruli.
MATERIALS AND METHODS
Human GEC culture
Normal human GECs were purchased from Angio-Proteomie Inc. (Boston, MA, USA). The cells were cultured in ENDO-Growth medium (Angio-Proteomie Inc.) containing 5% fetal bovine serum (FBS), recombinant growth factors, 100 U/mL penicillin and 100 µg/mL streptomycin on culture dishes coated with the coating solution (Quick Coating Solution, Angio-Proteomie Inc.) at 37°C in humidified 5% CO2 in air. The medium was changed every 2 days. All experiments were performed using cells between the third and fifth passages.
For the experiments, subconfluent human GECs were incubated with medium containing 0.5% FBS for 24 h to arrest and synchronize cell growth. After this time period, the cells were treated with media containing 0.5% ENDO-Growth supplement (Angio-Proteomie Inc.) and 5.6 mM glucose [normal glucose (NG)], NG+24.4 mM mannitol (NG+M) or 30 mM glucose [high glucose (HG)] with or without 10−7 M L-158,809, an AT1R blocker (ARB).
At 24 h after the media change, the cells were harvested for either RNA or protein, and the conditioned culture media were collected for the measurement of AI and AII levels.
Animals
All animal studies were conducted using a protocol approved by the committee for the care and use of laboratory animals of Yonsei University College of Medicine. Thirty-two male Sprague-Dawley rats, weighing 250–280 g, were injected with either diluent [n = 16, control (C)] or 65 mg/kg streptozotocin (STZ) intraperitoneally [n = 16, diabetes (DM)]. Diabetes was confirmed by tail vein blood glucose levels >300 mg/dL on the third day post-injection. After diabetes was confirmed, eight rats from each group were treated daily with 1 mg/kg/day of L-158,809 by oral gavage (C+ARB and DM+ARB) for 3 months. The rats were given free access to water and standard laboratory chow during the 3-month study period. Body weights were checked monthly, and kidney weights were measured at the time of sacrifice. Serum glucose and 24-h urinary albumin were also measured at the time of sacrifice. Blood glucose was measured by a glucometer, and 24-h urinary albumin excretion was determined by enzyme-linked immunosorbent assay (ELISA) (Nephrat II, Exocell, Inc., Philadelphia, PA, USA).
Glomerular isolation
Glomeruli were isolated using sieves with pore sizes of 250 µm, 150 µm and 75 µm, and glomeruli on the 75 µm sieve were used for the experiments. The purity of the glomerular preparation was >98% as determined by light microscopy.
Total RNA extraction
Total RNA was extracted from cultured human GECs as previously described [22]. Briefly, after cell scraping with 800 µL of RNA STAT-60 reagent (Tel-Test, Inc., Friendswood, TX, USA), the mixture was vortexed and incubated for 5 min at room temperature, 160 µL of chloroform was added and the mixture was shaken vigorously for 30 s. After 3 min, the mixture was centrifuged at 12 000 g for 15 min at 4°C and the upper aqueous phase containing the extracted RNA was transferred to a new tube. The RNA was precipitated from the aqueous phase with 400 µL isopropanol and pelleted with centrifugation at 12 000 g for 30 min at 4°C. The RNA precipitate was washed with 70% ice-cold ethanol, dried using a Speed Vac, and dissolved in diethyl pyrocarbonate-treated distilled water. The RNA yield and quality were assessed based on spectrophotometric measurements at wavelengths of 260 and 280 nm.
Reverse transcription
First-strand complementary DNA (cDNA) was made using a Boehringer Mannheim cDNA synthesis kit (Boehringer Mannheim GmbH, Mannheim, Germany). Two micrograms of total RNA extracted from GECs was reverse transcribed using 10 µM random hexanucleotide primer, 1 mM deoxynucleoside triphosphate (dNTP), 8 mM MgCl2, 30 mM KCl, 50 mM Tris–HCl, pH 8.5, 0.2 mM dithiothreitol, 25 U RNAse inhibitor and 40 U avian myeloblastoma virus reverse transcriptase. The mixture was incubated at 30°C for 10 min and 42°C for 1 h, followed by inactivation of the enzyme at 99°C for 5 min.
Real-time polymerase chain reaction
The primers used for AGT, ACE, renin, ATIR, AT2R and 18s amplification were as follows: AGT, sense 5′-AGC TGG TGC TAG TCG CTG CA-3′, antisense 5′-AGG CCA GGG TGC CAA AGA CA-3′; ACE, sense 5′-ATG GAC CAG CTC TCC ACA GTG CA-3′, antisense 5′-ACG TCC CCA ATG GCC TCA TG-3′; renin, sense 5′-AAG CCT GAA GGA ACG AGG TG-3′, antisense 5′-TTC ATG GGT TGG CTC CAC TC-3′; AT1R, sense 5′ GGG CTG TCT ACA CAG CTA TGG AA-3′, antisense 5′-ATG ATG CAG GTG ACT TTG GCT A-3′; AT2R, sense 5′-TCT GGC AGA ACT TCA CGG AC-3′, antisense 5′-TTG GCG GTG GAG TAG ATC CT-3′; and 18s, sense 5′-ACC GCG GTT CTA TTT TGT T-3′, antisense 5′-CGG TCC AAG AAT TTC ACC TC-3′.
Using the ABI PRISM® 7700 Sequence Detection System (Applied Biosystems, Foster City, CA, USA), polymerase chain reaction (PCR) was performed with a total volume of 20 µL in each well, containing 10 µL of SYBR Green® PCR Master Mix (Applied Biosystems), 5 µL of cDNA, and 5 pM sense and antisense primers. Primer concentrations were determined by preliminary experiments that analyzed the optimal concentrations of each primer. Each sample was run in triplicate in separate tubes to permit quantification of the gene normalized to 18s rRNA. The PCR conditions were as follows: 35 cycles of denaturation at 94.5°C for 30 s, annealing at 60°C for 30 s, and extension at 72°C for 1 min. An initial heating at 95°C for 9 min and a final extension at 72°C for 7 min were performed for all PCRs.
After real-time PCR, the temperature was increased from 60 to 95°C at a rate of 2°C/min to construct a melting curve. A control without cDNA was run in parallel with each assay. The cDNA content of each specimen was determined using a comparative CT method with 2−ΔΔCT. The results are given as the relative expression of AGT, ACE, renin, AT1R and AT2R normalized to the 18s housekeeping gene and are expressed in arbitrary units.
Western blot analysis
GECs harvested from plates were lysed in sodium dodecyl sulfate (SDS) sample buffer [2% SDS, 10 mM Tris–HCl, pH 6.8, 10% (vol/vol) glycerol]. Aliquots of 50 µg protein were treated with Laemmli sample buffer, heated at 100°C for 5 min, and electrophoresed at 50 µg/lane in an 8–12% acrylamide denaturing SDS-polyacrylamide gel. Proteins were then transferred to a Hybond-ECL membrane using a Hoeffer semidry blotting apparatus (Hoeffer Instruments, San Francisco, CA, USA), and the membrane was then incubated in blocking buffer A [1× phosphate buffered saline (PBS), 0.1% Tween-20 and 8% nonfat milk] for 1 h at room temperature, followed by an overnight incubation at 4°C in a 1:1000 dilution of polyclonal antibodies to AGT (Abcam, Cambridge, MA, USA), ACE (Santa Cruz Biotechnology, Inc., Santa Cruz, CA, USA), AT1R, AT2R (Abcam) or β-actin (Sigma Chemical Co., St Louis, MO, USA). The membrane was then washed once for 15 min and twice for 5 min in 1× PBS with 0.1% Tween-20. Next, the membrane was incubated in buffer A containing a 1:1000 dilution of horseradish peroxidase-conjugated donkey anti-goat IgG (Amersham Life Science, Inc., Arlington Heights, IL, USA). The washes were repeated, and the membrane was developed with a chemiluminescent agent (ECL; Amersham Life Science, Inc.). The band densities were measured using TINA image software (Raytest, Straubenhardt, Germany).
Measurement of renin activity
Renin activity was determined as the formation of AI in the presence of excess substrate, AGT. Samples were incubated with or without porcine AGT (1 µM) (Sigma Chemical Co.) at 37°C for 1 h, followed by the measurement of AI levels using a commercial ELISA kit (Peninsula Laboratories, Belmont, CA, USA).
ELISA for AI and AII
The levels of AI and AII were measured in conditioned culture media using a commercial ELISA kit (Peninsula Laboratories) according to the manufacturer's protocol.
Immunofluorescent microscopy
Confluent GECs on cover slips were washed with cold PBS, fixed with 70% methanol for 30 min at 4°C, washed again with cold PBS, and then permeabilized with 0.2% Triton X-100 in PBS for 10 min at room temperature. After rinsing with PBS, nonspecific binding sites were blocked with 5% goat serum in PBS for 1 h at room temperature. Primary antibodies for VE-cadherin and heparan sulfate glycosaminoglycans (HS-GAG) (Abcam) (prediluted in 5% goat serum, 4% bovine serum albumin and 0.2% Triton X-100 in PBS) were applied at 4°C overnight. Antigen-antibody complexes were visualized by incubation with Cy3-conjugated secondary antibodies (Jackson ImmunoResearch Laboratories, Inc., West Grove, PA, USA) for 1 h at room temperature. The cover slips were washed with PBS and mounted on glass slides using Vectashield (Vector Laboratories, Inc., Burlingame, CA, USA). Images were obtained with a digital camera attached to a fluorescence microscope (BX51; Olympus Co., Tokyo, Japan), and the intensity of immunofluorescence was normalized to cell number, which was determined by DAPI staining.
Fluorescein isothiocyanate-labeled bovine serum albumin permeability assay
The permeability of GECs to macromolecules was assessed by measuring the passage of fluorescein isothiocyanate-labeled bovine serum albumin (FITC-BSA) (Sigma Chemical Co.) across the monolayer. Polycarbonate micropore membranes with a diameter of 24 mm and a pore size of 0.4 µm (Corning Costar, Cambridge, MA, USA) and coated with Quick Coating Solution were used. GECs (1 × 10³ in ENDO-Growth medium) were seeded onto the membranes and cultured for 5–7 days to allow them to become confluent. After serum restriction for 24 h, the cells were cultured under different experimental conditions for 24 h. Next, the medium in the insert was replaced with ENDO-Growth medium with 0.5 mg/mL FITC-BSA. An aliquot of medium from the upper chamber was collected after 1 h, and the fluorescence of the aliquot was measured using a fluorospectrometer at wavelengths of 492 and 520 nm. The permeability coefficient of albumin (Pa) was determined using the following equation: coefficient of albumin (Pa) = (CU/t) × (1/A) × (V/CI), where CU is the FITC-BSA concentration in the upper chamber, t is time (s), A is the area of the membrane (cm2), V is the volume of the upper chamber and CI is the FITC-BSA concentration in the insert [23].
Scanning electron microscopy
Cells cultured under different experimental conditions for 24 h on chamber slides and isolated glomeruli from each animal were fixed with 2% glutaraldehyde-paraformaldehyde in 0.1 M phosphate buffer (PB, pH 7.4) for 6 h at 32°C, washed three times for 30 min in 0.1 M PB, postfixed in 1% OsO4 dissolved in 0.1 M PB for 2 h at 4°C, and dehydrated by treatment with a graded series of ethanol (5 min each in 50, 60, 70, 80, 90 and 95%, and twice in 100%). Then, the specimens were infiltrated with propylene oxide followed by isoamyl acetate and subjected to a Critical Point Dryer (HCP-2, Hitachi, Chiyoda-ku, Tokyo, Japan). After drying, they were mounted and coated with gold by ion sputter (IB-3, Eiko, Sumida-ku, Tokyo, Japan). For the glomeruli, several cleavages were performed with a razor blade before coating. The samples were examined and photographed in a random and unbiased manner with a scanning electron microscope (FESEM-SIGMA, Carl Zeiss, Welwyn Garden City, UK) at an acceleration voltage of 20 kV.
Transmission electron microscopy (TEM)
Isolated glomeruli from each animal were fixed with 2% glutaraldehyde-paraformaldehyde in 0.1 M PB (pH 7.4) for 6 h at 32°C, postfixed in 1% OsO4 dissolved in 0.1 M PB for 2 h at 4°C, dehydrated with a graded series of ethanol (5 min each in 50, 60, 70, 80, 90 and 95%, and twice in 100%) and treated with propylene oxide. Then, the specimens were embedded with a Poly/Bed 812 kit (Polysciences, Warrington, PA, USA), followed by pure fresh resin embedding and polymerization in an electron microscope oven (TD-700, DOSAKA, Sakyo-ku, Kyoto, Japan) for 24 h at 65°C. Semithin sections (approximately 200–250-nm-thick) were initially cut and stained with toluidine blue (Sigma Chemical Co.) for light microscopy. Next, 70 nm thin sections were cut using a LEICA EM UC-7 (Leica Microsystems, Hernals, Vienna, Austria) with a diamond knife (Diatome, Nidau, Switzerland), transferred onto copper and nickel grids, and counterstained with 6% uranyl acetate and lead citrate. All thin sections were observed by transmission electron microscopy (TEM) (JEM-1011, JEOL, Akishima, Tokyo, Japan) at an acceleration voltage of 80 kV.
Morphometric measurement of GEC fenestrae
Photographs of five cultured GECs from three different experiments in each group and five glomeruli from three rats in each group were obtained to determine the size of fenestrae. From each photograph, fenestrae were constructed and measured using the hands-free tool of ImageJ software v1.60 (NIH, Bethesda, MA, USA; online at http://rsbweb.nih.gov/ij). For cultured GECs, at least 10 scanning electron microscopy (SEM) images at ×200 000 magnification from each cell were processed using ImageJ, and only the 10 largest pore-like structures from each image were used for the measurement of fenestrae area. Similarly, at least 30 SEM images obtained at ×300 000 magnification from each glomerulus were processed, and the size of fenestrae was determined using the fenestra in the center of each image. The size of the fenestrae was also assessed using at least 10 TEM images at ×100 000 magnification. The width of each fenestra was measured at the site between the endothelial cell membranes and parallel to the glomerular basement membrane. Finally, the number of fenestrae was counted using at least 10 SEM images of each glomerulus taken at ×100 000 magnification.
Statistical analysis
All values are expressed as the mean ± standard error of the mean. Statistical analysis was performed using the statistical package SPSS for Windows Ver. 13.0 (SPSS, Inc., Chicago, IL, USA). The results were analyzed using the Kruskal–Wallis nonparametric test for multiple comparisons. Significant differences determined using the Kruskal–Wallis test were further confirmed using the Mann–Whitney U-test. P-values <0.05 were considered statistically significant.
RESULTS
Cell culture studies
AGT, ACE, renin, AT1R and AT2R mRNA expression
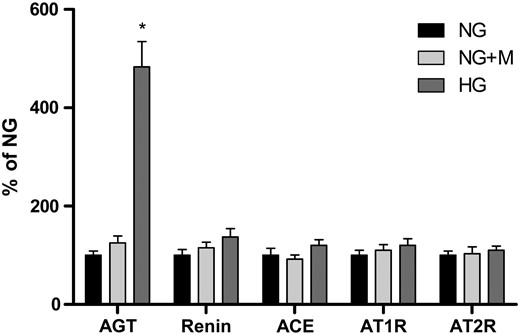
AGT, renin, ACE, AT1R and AT2R mRNA expression in GECs exposed to 5.6 mM glucose (NG), NG+24.4 mM mannitol (NG+M) and 30 mM glucose (HG) (n = 6). There was a significant increase in AGT mRNA expression in GECs exposed to HG medium. In contrast, there were no significant differences in renin, ACE, AT1R and AT2R mRNA expression between the NG and HG groups. Mannitol had no effect on the mRNA expression of RAS components in cultured GECs. *P < 0.01 versus NG and NG+M groups.
AGT, ACE, AT1R and AT2R protein expression
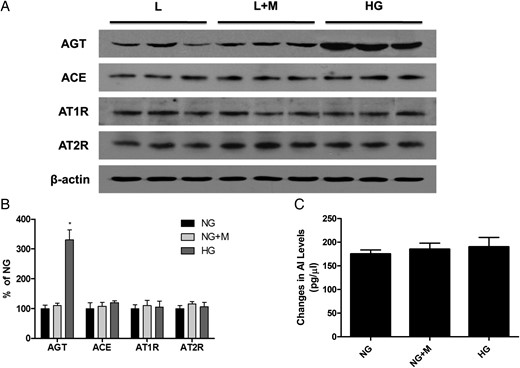
A representative western blot analysis of AGT, ACE, AT1R and AT2R protein expression (one representative of four blots) and renin activity in GECs exposed to 5.6 mM glucose (NG), NG+24.4 mM mannitol (NG+M) and 30 mM glucose (HG) (n = 5). (A and B) Similar to the mRNA expression, AGT protein expression was significantly higher in HG-stimulated GECs compared with NG cells. In contrast, there were no significant differences in ACE, AT1R and AT2R protein expression among the three groups. (C) The renin activity was also comparable among the groups. *P < 0.01 versus NG and NG+M groups.
Renin activity
The renin activity in cultured GECs, which was determined by assessing the changes in AI levels in the presence of excess exogenous AGT, was comparable among the groups (Figure 2C).
AI and AII levels in conditioned culture media
The concentrations of AI and AII in HG-conditioned cultured media (AI, 362.5 ± 35.7 pg/µL; AII, 118.7 ± 15.7 pg/µL) were significantly higher than those in NG media (AI, 110.3 ± 14.6 pg/µL; AII, 70.8 ± 10.7 pg/µL) (P < 0.05).
VE-cadherin and HS-GAG protein expression


VE-cadherin (A) and HS-GAG (B) protein expression assessed by immunofluorescent (IF) staining in GECs exposed to 5.6 mM glucose (NG), NG+24.4 mM mannitol (NG+M), NG+10−7 M L-158,809 (NG+ARB), 30 mM glucose (HG) and HG+ARB. There was no significant change in VE-cadherin protein expression, whereas HS-GAG protein expression was significantly lower in GECs exposed to HG medium compared with NG cells. In addition, the decrease in HS-GAG protein expression in HG-stimulated GECs was significantly attenuated by L-158,809 (×200). *P < 0.01 versus NG, NG+M and NG+ARB groups, #P < 0.01 versus HG group.
FITC-BSA permeability assay
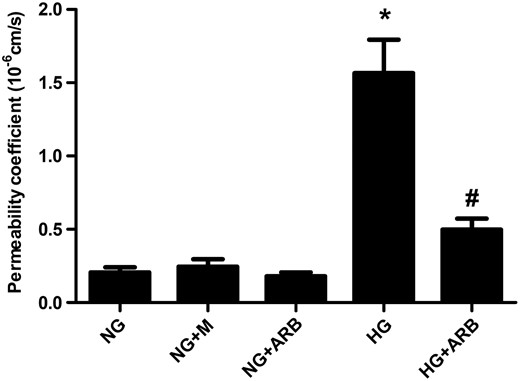
Permeability coefficient to albumin in GECs exposed to 5.6 mM glucose (NG), NG+24.4 mM mannitol (NG+M), NG+10−7 M L-158,809 (NG+ARB), 30 mM glucose (HG) and HG+ARB (n = 6). Compared with NG-stimulated cells, the permeability coefficient to albumin determined using the FITC-BSA permeability assay was significantly higher in GECs exposed to HG medium, and L-158,809 treatment significantly abrogated this increase in HG cells. *P < 0.001 versus NG, NG+M and NG+ARB groups, #P < 0.01 versus HG group.
Morphological changes of fenestrae in cultured GECs
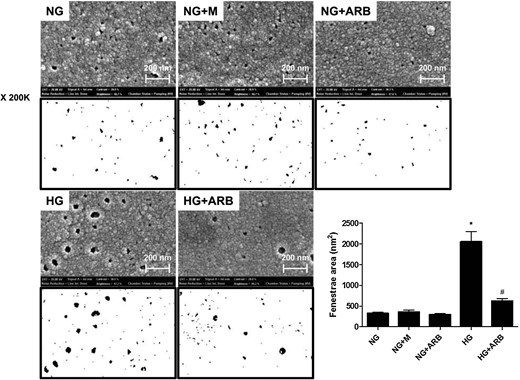
SEM images of GECs exposed to 5.6 mM glucose (NG), NG+24.4 mM mannitol (NG+M), NG+10−7 M L-158,809 (NG+ARB), 30 mM glucose (HG) and HG+ARB. The mean fenestrae size was significantly greater in GECs cultured under HG conditions than in NG cells, and the enlarged fenestrae in HG-stimulated cells were significantly ameliorated by L-158,809 (×200K). *P < 0.001 versus NG, NG+M and NG+ARB groups, #P < 0.01 versus HG group.
Animal studies
Animal data
All animals gained weight over the 3-month experimental period, but the weight gain was significantly higher in C rats compared with DM rats (P < 0.001). The ratio of kidney weight to body weight in DM rats (1.34 ± 0.13%) was significantly higher than in C rats (0.53 ± 0.04%) (P < 0.01), and this increase in DM rats was significantly attenuated by the administration of L-158,809 (0.84 ± 0.07%) (P < 0.05). The mean blood glucose levels in DM (487.8 ± 17.4 mg/dL) and DM+ARB rats (475.1 ± 14.2 mg/dL) were significantly higher compared with C (103.2 ± 5.5 mg/dL) and C+ARB rats (107.5 ± 6.4 mg/dL) (P < 0.001). Compared with the C (0.40 ± 0.06 mg/day) and C+ARB groups (0.41 ± 0.07 mg/day), the 24-h urinary albumin excretion was significantly higher in DM rats (1.99 ± 0.22 mg/day) (P < 0.01), and L-158,809 treatment significantly reduced albuminuria in the DM rats (1.04 ± 0.19 mg/day) (P < 0.05) (Table 1).
Animal data
| C (n = 8) | C+ARB (n = 8) | DM (n = 8) | DM+ARB (n = 8) | |
|---|---|---|---|---|
| Body weight (wt, g) | 579.5 ± 14.9 | 570.1 ± 16.7 | 344.7 ± 14.3* | 316.9 ± 17.1#* |
| Blood glucose (mg/dL) | 103.2 ± 5.5 | 107.5 ± 6.4 | 487.8 ± 17.4* | 475.1 ± 14.2* |
| Kidney wt/ body wt (%) | 0.53 ± 0.04 | 0.59 ± 0.06 | 1.34 ± 0.13** | 0.84 ± 0.07# |
| 24 h UAE (mg/day) | 0.40 ± 0.06 | 0.41 ± 0.07 | 1.99 ± 0.22** | 1.04 ± 0.19# |
UAE, urinary albumin excretion.
P < 0.001 versus C and C+ARB groups.
P < 0.01 versus C and C+ARB groups.
P < 0.05 versus DM group.
Morphological changes of fenestrae in the glomerular capillary wall


Electron microscopic images of GECs in control (C), C+L-158,809 (C+ARB), diabetes (DM) and DM+ARB rats. (A) The mean area of fenestrae assessed by SEM was significantly larger in isolated glomeruli from DM rats compared with C glomeruli, and the increase in the size of the glomerular capillary wall fenestrae was significantly inhibited in DM rats treated with L-158,809. In contrast, the number of fenestrae per area was comparable among the four groups (×100K and 300K). (B) TEM images also revealed that the mean width of fenestrae was significantly larger in DM glomeruli than in isolated glomeruli from C rats, and L-158,809 treatment significantly mitigated the increase in the width of glomerular endothelial cell fenestrae in DM rats (×30K and 100K). *P < 0.01 versus C and C+ARB groups, #P < 0.05 versus DM group.
DISCUSSION
Previous studies have shown that the local RAS within various kidney cells [17] is activated under diabetic conditions and that this activation plays a pivotal role in the pathogenesis of diabetic nephropathy [12, 22–25]. Recently, accumulating evidence has indicated that changes in GECs are associated with the development of proteinuria in diabetic nephropathy [6–8]. In this study, we demonstrate that AII concentrations are significantly higher in high glucose-stimulated GECs, and this increase is attributed to elevated AGT expression, with an increase in the AII substrate, rather than a greater conversion of AGT to AI or AI to AII. Moreover, ARB treatment significantly inhibits the decrease in HS-GAG expression and the increase in albumin permeability in GECs exposed to HG medium. The increase in the mean size of GEC fenestrae is also significantly abrogated by ARB in HG-stimulated GECs and DM rats. Based on these findings, we suggest that the locally activated RAS within GECs under diabetic conditions is partly responsible for the albuminuria in diabetic nephropathy.
Diabetic nephropathy is characterized pathologically by cellular hypertrophy and increased extracellular matrix accumulation and clinically by proteinuria [2, 26], and the RAS has emerged as an important role player in the overall pathophysiology of diabetic nephropathy based on the results of numerous previous clinical and experimental studies [13, 14]. Based on these findings, it is proposed that the beneficial effect of RAS blockers in diabetic nephropathy may be attributed to their direct effect on various renal cells. Many investigators demonstrated that AII mediated apoptosis, stimulated transforming growth factor-β1 production and signaling pathways such as mitogen-activated protein kinase, and contributed to the development of hypertrophy and matrix expansion in various renal cells [12, 17, 27, 28]. In addition, the local RAS was found to exist and to be activated in tubular epithelial cells [17], mesangial cells [18, 19], podocytes [20] and GECs [21] under diabetic conditions. In contrast to mesangial cells and podocytes, the RAS in GECs has only recently drawn scientific attention. A recent study showed that human GECs possess an endogenous cleavage capacity of angiotensin peptides by using matrix-assisted laser desorption/ionization time-of-flight mass spectrometry and isotope-labeled peptide quantification [29]. It was also demonstrated that ACE activity was prominent, whereas AII-metabolizing activity was modest in GECs. Moreover, high glucose and AII induced the expression of a dysfunctional endothelial nitric oxide synthase (eNOS) and stimulated the production of reactive oxygen species (ROS) from NADPH oxidase in cultured GECs. Cyclooxygenase-2 expression and prostacyclin synthesis were also upregulated in these cells by high glucose and AII [30]. These findings suggest that both high glucose and AII are involved in the regulation of glomerular microcirculation under diabetic conditions. Very recently, Peng et al. [21] found that high glucose increased AGT production and extracellular AII levels without any change in renin protein expression in cultured rat GECs, which was consistent with the results of the current study, indicating that the elevated AII concentration in high glucose-stimulated GECs was primarily due to an increase in AGT expression.
Because the GEC layer is a component of the glomerular filtration barrier along with GBM and podocytes, GECs are predicted to contribute to the development of proteinuria in various kidney diseases, including diabetic nephropathy [9]. Previous studies showed an increase in albumin permeability across cultured human umbilical vein endothelial cells and bovine aortic endothelial cells after 2 and 4 days incubation with high glucose medium, respectively [31, 32]. Similarly, Nitta et al. [33] found that the permeability of fluorescein-labeled albumin was significantly higher in a bovine GEC monolayer exposed to high glucose medium, which was significantly ameliorated by H-7, a protein kinase C (PKC) inhibitor. Based on these findings, they suggested that high glucose concentrations activated PKC, resulting in an increase in albumin permeability across GECs. Consistent with previous studies, we also observed that albumin permeability was significantly higher in human GECs cultured under high glucose conditions and that the increase in albumin permeability across a high glucose-stimulated GEC monolayer was significantly abrogated by ARB treatment. Taken together, these data suggest that the locally activated RAS is involved in albumin permeability in GECs under diabetic conditions partly via the PKC pathway.
GECs are covered by a 200–400-nm-thick layer of glycocalyx, which covers both the fenestral and inter-fenestral area [9]. Glycocalyx, which is composed of proteoglycan core proteins, GAG chains and sialoglycoproteins, is covalently bound to the GEC membrane and connected to the outer cell coat by charge–charge interactions. In addition, it serves as a charge-selective glomerular filtration barrier, a quality attributed to the anionic charge characteristics of HS-GAG [34]. Mounting evidence indicates that the GEC glycocalyx is altered under diabetic conditions. Singh et al. [6] demonstrated that the biosynthesis of GAG, particularly HS-GAG, was significantly reduced in cultured GECs under high glucose conditions, whereas the expression of proteoglycan core proteins remained unchanged. Moreover, they found a significant increase in the passage of albumin across a high glucose-stimulated GEC monolayer without any changes in intercellular junctions, which was reproduced by enzymatic removal of heparan sulfate from the GEC glycocalyx. ROS, an important mediator in the pathogenesis of diabetic nephropathy, also caused a significant decrease in heparan sulfate staining from the surface of cultured GECs along with a significant increase in albumin permeability; however, the effect of ROS was not mediated via the GAG biosynthetic pathway [35]. Based on these findings, it is proposed that excessive ROS generation under high glucose conditions contributes to the development of albuminuria by altering the properties of the glycocalyx in GECs. In the current study, a significant decrease in the expression of heparin sulfate was also observed in GECs exposed to high glucose medium, which was consistent with previous studies. In contrast, a previous study by Wijnhoven et al. [36] failed to show a significant increase in proteinuria in heparinase III-treated rats in which heparan sulfate was successfully removed from the glomeruli. Furthermore, in transgenic mice overexpressing human heparanase, biochemical analysis of heparan sulfate isolated from adult tissues revealed a profound decrease in the size of heparin sulfate chains [37] along with an increase in urinary protein content. Compared with control mice, however, the increase in proteinuria in transgenic mice was less than 2-fold (0.277 versus 0.155 mg/mL) despite extensive foot process effacement. These conflicting results led to the question of whether HS-GAG in the glycocalyx is solely responsible for the permselectivity exerted by the glomerular endothelium or whether some other changes in GECs are involved in this phenomenon.
Another characteristic finding of GECs is the presence of numerous transcellular fenestrations with a diameter of 60–100 nm in the normal state [9]. However, the functional role of GEC fenestrations in the glomerular filtration barrier has not been fully elucidated in various kidney diseases. Particularly in diabetic nephropathy, to date, only a few studies have examined the changes in GEC fenestrations. Toyoda et al. [8] studied 18 patients with type 1 diabetes (7 normoalbuminuric, 6 microalbuminuric and 5 proteinuric) and 6 normal control subjects, and investigated the structural characteristics of podocytes and endothelial cells in diabetic nephropathy. Using stereological measurements with overlapping digital electron microscopic images, the proportion of fenestrated GECs was significantly lower in type 1 diabetes mellitus even with normoalbuminuria, and the extent of reduction in the GEC fenestration was significantly inversely correlated with the mesangial fractional volume per glomerulus (r = −0.57, P = 0.01) and podocyte foot process width (r = −0.58, P = 0.01). Similar findings were also observed in type 2 diabetes mellitus. A recent study by Weil et al. [7] included 37 Pima Indians with type 2 diabetes mellitus (11 normoalbuminuric, 16 microalbuminuric and 10 macroalbuminuric) and showed that the mean percentage of GEC fenestration was significantly lower in type 2 diabetes mellitus with macroalbuminuria (19.3%) compared with patients with normoalbuminuria (27.4%) or microalbuminuria (27.2%). In addition, there were inverse correlations for the percent of fenestrated GECs with albuminuria, glomerular basement membrane thickness and fractional mesangial area, and a positive correlation between the percentage of GEC fenestration and the glomerular filtration rate. In the present study, we demonstrated an increase in the size of GEC fenestrae rather than a decrease, both in vivo and in vitro. Our study differed from earlier studies in that the duration of diabetes mellitus in both previous human studies was >10 years. Moreover, in the latter human study, hypertension was accompanied in >60% of type 2 diabetes mellitus patients with microalbuminuria or macroalbuminuria. Furthermore, those studies did not provide SEM images. These different experimental conditions and subjects may contribute to the opposite findings for the size of GEC fenestrae between this and previous studies. Based on the results of this study, we propose that a decrease in HS-GAG along with a significant increase in the size, but no significant change in the number of fenestrae in GECs under diabetic conditions, contributed to an increase in albumin permeability. Meanwhile, the STZ-induced diabetic Sprague-Dawley rats used in the current study did not exhibit a high level of albuminuria or proteinuria, which was consistent with the results of a number of previous studies [38, 39]. However, in some studies using transgenic animals such as Cyp1a1mRen2 rats, the amount of albuminuria was extremely high in STZ-induced DM animals [40]. In addition, the endothelial cells of diabetic glomeruli on the SEM images were slightly flattened compared with the control glomeruli. The exact reason is not clear, but intraglomerular hypertension, loss of HS-GAG and presumable derangement of the cytoskeleton by high glucose may in part contribute to this finding. Moreover, to verify the fenestrae structure of cultured GECs, a TEM study should be performed, but it was difficult to obtain clear-cut TEM images of cultured GECs, possibly due to destroyed or missing fenestrae structure during the fixation or cutting process or due to the relatively small-sized fenestrae compared with GECs in vivo.
In conclusion, the current study found that all components of the RAS were present in GECs, and the local RAS was activated under diabetic conditions. Furthermore, diabetes-induced RAS activation in GECs was involved in albumin permeability. Therefore, the inhibitory effect of RAS blockade on proteinuria in diabetic nephropathy may be partly attributable to its direct impact on GECs.
ACKNOWLEDGEMENTS
This work was supported by the Brain Korea 21 PLUS Project for Medical Science, Yonsei University College of Medicine, a National Research Foundation of Korea grant funded by the Korean Government (MEST) (NRF-2015R1A2A2A01002308) and a grant of the Korean Health Technology R&D Project, Ministry of Health and Welfare, Republic of Korea (HI12C0646).
CONFLICT OF INTEREST STATEMENT
None declared.


Comments