


Abstract
Inflammation is a common feature in dialysis patients and is associated with cardiovascular complications and poor outcome. Measuring the variability of inflammatory markers may help in understanding underlying factors triggering inflammation. Whether the inflammatory pattern in hemodialysis (HD) and peritoneal dialysis (PD) patients differs has scarcely been studied. Here we explored factors associated with the magnitude and variability of inflammation markers in HD and PD patients.
In two 3-month, prospective cohort studies comprising 228 prevalent HD and 80 prevalent PD patients, interleukin-6 (IL-6) and high-sensitivity C-reactive protein (CRP) were measured in blood samples drawn each month and every week, respectively. Information on comorbidity, protein-energy wasting (PEW) and medications was gathered at baseline, and information on symptoms potentially related to inflammation was gathered weekly. A mixed-effect model was used for multivariate analysis of factors linked to CRP and IL-6 variation.
IL-6 and CRP levels were higher and showed higher variability in HD versus PD patients [median IL-6 8.3 (interquartile range, IQR, 5.3–14.5) versus 6.7 (IQR 4.2–10.0) pg/mL, P < 0.001 and median CRP 6.1 (IQR 2.5–14.0) versus 5.4 (IQR 1.6–9.0) mg/L, P < 0.001). PEW predicted increased inflammation variability after correcting for age, sex, dialysis vintage, modality and comorbidity. Increased comorbidity predicted IL-6, but not CRP, variability.
Circulating concentrations as well as variability of IL-6 and CRP levels were higher in HD as compared with PD patients. In HD and PD patients, short-term variability of IL-6 and CRP levels associated strongly with PEW, while comorbidity was related to IL-6 but not to CRP variability.
INTRODUCTION
Although inflammation is a well-known feature in dialysis patients, its underlying factors and mechanistic pathways are still to a large extent poorly understood [1]. Inflammation may be caused by many factors, related to both underlying disease and the dialysis procedure itself [2]. Acute phase reactants, such as C-reactive protein (CRP), and cytokines, such as interleukin-6 (IL-6), are strongly associated with cardiovascular morbidity and mortality risk in dialysis patients [3–6]. CRP has been proposed to be included in the routine clinical risk assessment of dialysis patients, possibly combined with other biomarkers, such as troponins and natriuretic peptides [1, 7, 8]. However, the usefulness of inflammatory biomarkers in this context has been debated because of their seemingly large variation, which often appear to occur without obvious clinical reasons. A previous study on prevalent hemodialysis (HD) patients has shown high intraindividual variation of IL-6 and high-sensitivity CRP (hs-CRP) [9]. We have shown that comorbidity, age and sex, in addition to clinical factors, associate with high inter- and intraindividual variation of hs-CRP in prevalent HD patients [10]. The difference between magnitude and variation of inflammation in HD compared with peritoneal dialysis (PD) patients has scarcely been studied, and hitherto mainly in small patient cohorts [11, 12].
IL-6, a pro-inflammatory cytokine that induces the hepatic production of CRP, is linked to many pathways that contribute to cardiovascular disease (CVD), such as endothelial dysfunction and atheroma formation [13, 14]. IL-6 is also linked to protein-energy wasting (PEW), a common and severe problem in patients with end-stage renal disease [15, 16]. There is increasing evidence that markers of inflammation should be evaluated in the context of assessment of nutritional status in uremic patients [17]. Indeed, poor appetite in dialysis patients is associated with significantly higher IL-6 and CRP levels [18].
As there is a need for further understanding of factors that induce variation of inflammatory markers and whether repeated measurements of these markers can add to risk assessment, we studied two carefully phenotyped cohorts of prevalent HD and PD patients who were followed longitudinally for 3 months.
MATERIALS AND METHODS
The study consisted of two cohorts, 228 prevalent HD patients and 80 prevalent PD patients [Mapping of Inflammatory Markers in Chronic Kidney disease (MIMICK) 1 and 2]. All patients included had been on dialysis treatment for ≥3 months. The Ethics Committee of Karolinska Institutet, Stockholm, Sweden, approved the study protocols, and informed consent was obtained from all participants.
The protocol and patient characteristics of MIMICK-1 [10] included patients from six dialysis units in Stockholm, Sweden, recruited from October 2003 through September 2004. Initially, 254 patients were available; 26 were excluded because of unwillingness to participate (6), contagious infection (1), early death (1), logistical problems (7) and lack of clinical information (11). The MIMICK-2 cohort is based on prevalent PD patients recruited from March 2008 through April 2011. Out of 164 patients listed in three PD units in Stockholm, 67 patients were excluded initially. Causes for exclusion were unwillingness to participate (49), medical reasons such as contagious infections and terminal illness (9), planned living donor renal transplantation (3), logistical problems (3), problems with communication (2) and unknown cause (1). Of the remaining 97 patients, an additional 13 were excluded; eight switched to HD, three received a renal transplant and two died. Eighty-four patients were included at study start. Four were excluded from analysis because of logistical problems, and for multivariate analyses one was excluded because of insufficient data.
The duration of the study was 3 months. Patients answered a weekly questionnaire on symptoms potentially related to inflammation: fever, cold/sore throat, cough, otalgia, dyspnea, diarrhea, vomiting, dysuria, arthralgia, rashes, wounds, injuries, antibiotic treatment and operations. Baseline data were collected on comorbidity, medication and nutritional status. The etiology of underlying kidney disease in MIMICK-1 was chronic glomerulonephritis (18%), diabetic nephropathy (18%), vascular disease/nephrosclerosis (16%), interstitial nephritis (12%), polycystic kidney disease (12%) and miscellaneous/unknown causes (23%). In MIMICK-2, the underlying diagnoses were chronic glomerulonephritis (15%), vascular disease/nephrosclerosis (13%), diabetic nephropathy (11%), polycystic kidney disease (9%), interstitial nephritis (7%) and miscellaneous/unknown cause (45%). Comorbidity was registered by one clinician at study start using the Davies comorbidity index, which divides patients into low-, medium- and high-risk groups and includes ischemic heart disease, left ventricular dysfunction, peripheral/cerebral vascular disease, diabetes mellitus, malignancy, systemic collagen vascular disease and other significant diseases [10, 19]. The diagnosis of left ventricular dysfunction was based on clinical symptoms, chest X-ray and/or echocardiography. In MIMICK-1, 19% of patients had low-risk, 57% medium-risk and 24% high-risk comorbidity. In MIMICK-2, 26% of patients had low-risk, 58% medium-risk and 16% high-risk comorbidity. Prevalence of diseases in the MIMICK-1/MIMICK-2 cohorts was as follows: peripheral/cerebral vascular disease 31/28%, ischemic heart disease 30/31%, diabetes mellitus 26/24%, congestive heart failure 21/16%, active malignancy 11/11%, systemic collagen vascular disease 8/6% and other significant pathology 30/18%. Nutritional status was evaluated at study start using subjective global assessment (SGA) [20]. In MIMICK-1, 106 patients (48%) had PEW, while in MIMICK-2 31 patients (40%) had PEW (SGA score >1, data missing on two patients).
Antihypertensive treatment among the HD patients was as follows: β-blockers, 113 patients (49%); angiotensin-converting enzyme inhibitors or angiotensin II receptor blockers, 73 patients (32%); and calcium channel blockers, 58 patients (25%). Seventy-two patients (31%) were on statins and 68 (29%) were on acetylsalicylic acid. The median dose of erythropoiesis stimulating agents was equivalent to 10 000 IU/week (range, 0–40 000 IU/week, conversion factor for darbepoetin 1 µg = 200 IU). Among PD patients, 57 (71%) were on β-blockers, 45 patients (56%) used angiotensin-converting enzyme inhibitors or angiotensin II receptor blockers and 26 patients (33%) used calcium channel blockers. Thirty-nine patients (49%) were on statins and 33 (41%) were on acetylsalicylic acid. The average dose of erythropoiesis stimulating agents was equivalent to 5754 IU/week (range, 0–20 000 IU/week, conversion factor for darbepoetin, 1 µg = 200 IU, for recombinant epoetin-β, 1 µg = 240 IU). Of the PD patients, 19 (24%) were on automated peritoneal dialysis and the remaining 61 (76%) were on continuous ambulatory peritoneal dialysis. Information on urine volume was available in 60 PD patients; median volume 925 mL/24 h [interquartile range (IQR) 500–1300].
Biochemical methods
Samples of venous blood were collected at the start of the study and every week during 12 weeks; for the HD patients it was done before start of a dialysis session. The plasma was separated, and samples were kept frozen at −70°C if not analyzed immediately. The measurement of inflammatory markers was centralized in one single laboratory. hs-CRP was measured with nephelometry, plasma IL-6 was analyzed on an Immulite Automatic Immunoassay Analyzer (DPC, Los Angeles, CA, USA) with assays manufactured for this analyzer and according to the instructions of the manufacturer. hs-CRP was measured at baseline and then weekly throughout the study (a total of 13 measurements). Routine biochemistry and IL-6 were measured at study start and once a month thereafter (a total of four measurements).
Statistics
Nonparametric methods were used for comparison of clinical characteristics and biomarkers between cohorts (Wilcoxon for continuous variables and Fisher's exact test for categorical variables). Results are presented as median and IQR if not stated otherwise. The comprehensive comparisons were carried out by using a mixed-effect model that included both fixed effects and a random effect to account for repeated observations of the same patients. The fixed effects included baseline factors (age, sex, vintage, dialysis modality, nutritional status and comorbidity), the self-reported events/symptoms and study week (0–12 weeks). In an initial analysis, all 13 symptoms were included but thereafter nonstatistically significant symptoms were excluded for the final mixed model analysis. The intraclass correlation coefficient (ICC) was determined with the mixed model to describe the portion of inflammation variability explained by inter- versus intraindividual variation. Spearman rank correlation was used to evaluate the association between CRP, IL-6 and albumin.
RESULTS
While the prevalence of inflammation was high in both groups of dialysis patients, two markers of inflammation, IL-6 and hs-CRP, as well as albumin and the cardiac biomarker N-terminal pro-B-type natriuretic peptide (NT-proBNP), were all higher in HD than in PD patients (Table 1). The PD patients had a shorter dialysis vintage and higher body mass index. Age and comorbidities were similar in both cohorts.
Biomarkers and clinical characteristics at baseline in HD and PD patients
| Characteristics | HD patients (n = 228) | PD patients (n = 80) | P-value |
|---|---|---|---|
| Age, years | 66 (51–74) | 65 (56–77) | 0.54 |
| Sex (male), % | 56 | 68 | 0.09 |
| Dialysis vintage, months | 29 (14–57) | 11 (6–29) | <0.001 |
| Smoker no/yes, % | 80/20 | 80/20 | 1.0 |
| BMI, kg/m2 | 24 (21–27) | 25 (23–28) | 0.02 |
| PEW (SGA >1), % | 48 | 40 | 0.23 |
| Comorbidity (low/medium/high), % | 19/57/24 | 26/58/16 | 0.18 |
| Diabetes mellitus, % | 26 | 24 | 0.82 |
| Peripheral/cerebral vascular disease, % | 31 | 28 | 0.64 |
| Ischemic heart disease, % | 30 | 31 | 0.92 |
| Left ventricular dysfunction, % | 21 | 16 | 0.45 |
| Albumin, g/L | 35 (32–38) | 32 (28–35) | <0.001 |
| NT-proBNP, pg/mL | 9205 (2954–26 876) | 3080 (1188–8845) | <0.001 |
| hs-CRP, mg/L | 6.7 (2.5–21.0) | 4.6 (1.5–10.6) | 0.01 |
| IL-6, pg/mL | 8.7 (5.4–15.5) | 6.6 (4.0–9.6) | 0.003 |
Data are expressed as median values (IQR) or %.
BMI, body mass index; hs-CRP, high-sensitivity C-reactive protein; HD, hemodialysis; IL-6, interleukin 6; IQR, interquartile range; NT-proBNP, N-Terminal pro-B-type natriuretic peptide; PD, peritoneal dialysis; PEW, protein-energy wasting; SGA, subjective global assessment.
There was large intraindividual and interindividual variability in IL-6 levels (Figure 1). Overall median values of repeated IL-6 measurements were 8.4 (IQR 5–15) pg/mL in HD patients and 6.5 (IQR 4–10) pg/mL in PD patients, P < 0.001, with a significant difference between the two cohorts across all four months (all P-values <0.03). hs-CRP was also largely variable within and between patients (Figure 2). HD patients had higher hs-CRP levels compared with PD patients, overall median hs-CRP 6.5 (IQR 2.5–18.0) mg/L in HD and 4.8 (IQR 1.6–10.2) mg/L in PD, with a significant difference in 7 out of 13 weeks, and an overall significant difference (P < 0.001). The range, coefficient of variation and median of each patient's median IL-6 and hs-CRP are shown in Table 2 based on 13 hs-CRP and 4 IL-6 values. The coefficient of variation for monthly hs-CRP was 53.0% (HD patients) versus 52.9% (PD patients).
hs-CRP and IL-6 variability by dialysis modality
| hs-CRP HD, mg/L | hs-CRP PD, mg/L | IL-6 HD, pg/mL | IL-6 PD, pg/mL | |
|---|---|---|---|---|
| Median (IQR) | 6.1 (2.5–14.0) | 5.4 (1.6–9.0) | 8.3 (5.3–14.5) | 6.7 (4.2–10.0) |
| Range | 0.2–389.0 | 0.1–236.4 | 0.9–204.0 | 0.5–91.5 |
| CV, % | 80.4 | 84.4 | 33.0 | 33.5 |
| hs-CRP HD, mg/L | hs-CRP PD, mg/L | IL-6 HD, pg/mL | IL-6 PD, pg/mL | |
|---|---|---|---|---|
| Median (IQR) | 6.1 (2.5–14.0) | 5.4 (1.6–9.0) | 8.3 (5.3–14.5) | 6.7 (4.2–10.0) |
| Range | 0.2–389.0 | 0.1–236.4 | 0.9–204.0 | 0.5–91.5 |
| CV, % | 80.4 | 84.4 | 33.0 | 33.5 |
Median of each patient's median values. Mean of each patient's CV.
CV, coefficient of variation; HD, hemodialysis; hs-CRP, high-sensitivity C-reactive protein; IQR, interquartile range; IL-6, interleukin-6; PD, peritoneal dialysis.
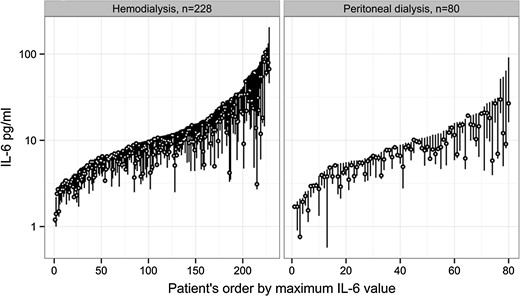
IL-6 variation in hemodialysis and peritoneal dialysis patients. Each bar represents a patient's highest, lowest and median IL-6 during 3 months. IL-6, interleukin-6.
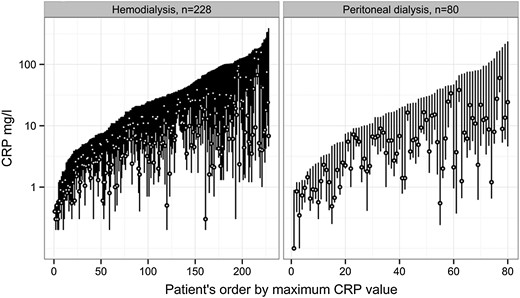
CRP variation in hemodialysis and peritoneal dialysis patients. Each bar represents a patient's highest, lowest and median hs-CRP during 3 months. hs-CRP, high-sensitivity C-reactive protein.
Results from the multivariate analysis show that male sex and age had a significant association with IL-6 variation. Patients with PEW had increased IL-6 variation, and an increased comorbidity score was associated with similar effect. PD patients displayed a smaller IL-6 variation than patients on HD. A few clinical symptoms reported by participants were associated with increased IL-6 variation: fever, cold, vomiting and a history of antibiotic use (Table 3). The same factors related to IL-6 and hs-CRP levels with the exception of comorbidity, which did not significantly associate with CRP variability, while all the same patient-reported plus four additional symptoms did: dyspnea, dysuria, recent injury and operation (Table 4). The ICC for IL-6 was 0.63, i.e. 63% of the overall variation was explained by variation between patients and 37% by variation within patients. The ICC for hs-CRP was 0.70; i.e. 70% of the variation was explained by variation between patients and 30% by within-patient variation.
Factors affecting IL-6 variability
| Predictors | Estimate | SE | 95% CI | P-value |
|---|---|---|---|---|
| Age, ≤45 versus 46–65/>65 years | 0.41/0.63 | 0.12/0.12 | 0.17–0.65/0.40–0.86 | 0.001/<0.001 |
| Sex, women versus men | 0.18 | 0.08 | 0.03–0.34 | 0.02 |
| Modality, PD versus HD | 0.28 | 0.09 | 0.11–0.45 | 0.002 |
| Comorbidity, low versus medium/high risk | 0.38/0.51 | 0.10/0.12 | 0.19–0.56/0.27–0.74 | <0.001/<0.001 |
| Protein-energy wasting (SGA >1) | 0.35 | 0.08 | 0.20–0.50 | <0.001 |
| Dialysis vintage, <24 versus ≥24 months | 0.06 | 0.08 | −0.09–0.21 | 0.44 |
| Fever (>38°C) | 0.46 | 0.10 | 0.27–0.65 | <0.001 |
| Cold | 0.17 | 0.05 | 0.08–0.27 | <0.001 |
| Vomiting | 0.12 | 0.06 | 0.01–0.23 | 0.04 |
| Use of antibiotics | 0.19 | 0.05 | 0.08–0.29 | <0.001 |
| ICC = 0.63 |
Based on log (IL-6). Symptoms reported weekly during 3 months.
CI, confidence interval; HD, hemodialysis; ICC, intraclass correlation coefficient; IL-6, interleukin-6; PD, peritoneal dialysis; SE, standard error; SGA, subjective global assessment.
Factors affecting hs-CRP variability
| Predictors | Estimate | SE | 95% CI | P-value |
|---|---|---|---|---|
| Age, ≤45 versus 46–65/>65 years | 0.70/0.92 | 0.22/0.21 | 0.29–1.12/0.51–1.33 | 0.001/<0.001 |
| Sex, women versus men | 0.28 | 0.14 | 0.01–0.54 | 0.04 |
| Modality, PD versus HD | 0.47 | 0.16 | 0.17–0.78 | 0.003 |
| Comorbidity, low versus medium/high risk | 0.31/0.32 | 0.17/0.21 | −0.12–0.64 / −0.08–0.72 | 0.06/0.13 |
| Protein-energy wasting (SGA >1) | 0.30 | 0.13 | 0.04–0.56 | 0.03 |
| Dialysis vintage, <24 versus ≥24 months | 0.02 | 0.14 | −0.25–0.28 | 0.91 |
| Fever (>38°C) | 0.54 | 0.09 | 0.36–0.72 | <0.001 |
| Cold | 0.26 | 0.05 | 0.17–0.35 | <0.001 |
| Dyspnea | 0.21 | 0.05 | 0.11–0.32 | <0.001 |
| Vomiting | 0.32 | 0.05 | 0.22–0.43 | <0.001 |
| Dysuria | 0.23 | 0.09 | 0.05–0.40 | 0.01 |
| Use of antibiotics | 0.38 | 0.05 | 0.28–0.48 | <0.001 |
| Injury | 0.20 | 0.06 | 0.09–0.31 | <0.001 |
| Operation | 0.36 | 0.08 | 0.20–0.52 | <0.001 |
| ICC = 0.70 |
Based on log (CRP). Symptoms reported monthly during 3 months.
CI, confidence interval; HD, hemodialysis; hs-CRP, high-sensitivity C-reactive protein; ICC, intraclass correlation coefficient; PD, peritoneal dialysis; SE, standard error; SGA, subjective global assessment.
As expected, the correlations between hs-CRP and IL-6 were positive and strong in both cohorts. In the HD population, IL-6 and hs-CRP at baseline were correlated (Spearman's ρ = 0.72; P < 0.001), as were median IL-6 and hs-CRP (Spearman's ρ = 0.69; P < 0.001). In the PD population, baseline and median IL-6 and hs-CRP had a significant correlation (Spearman's ρ = 0.72 and P < 0.001 for both). There was a moderate inverse correlation between baseline IL-6 and plasma albumin in both HD (Spearman's ρ = −0.51; P < 0.001) and PD patients (Spearman's ρ = −0.55; P < 0.001). The correlation between hs-CRP and albumin was also inverse but less strong (Spearman's ρ = −0.47; P < 0.001 in HD and −0.35; P = 0.001 in PD patients). Univariate analyses of IL-6 in relation to PEW and specific comorbidities showed that IL-6 was significantly higher in patients with PEW in both cohorts [HD patients with versus without PEW, IL-6 10.6 pg/mL (IQR 6.4–19.9) versus 6.9 pg/mL (IQR 4.8–10.4), P < 0.001; PD patients with versus without PEW, IL-6 8.0 pg/mL (IQR 6.1–11.6) versus 5.4 pg/mL (IQR 3.6–8.6), P = 0.003]. The same was true for patients with versus without peripheral/cerebral vascular disease [HD patients, IL-6 10.5 pg/mL (IQR 6.6–19.9) versus 7.5 pg/mL (IQR 4.8–12.5), P = 0.001; PD patients, IL-6 8.9 pg/mL (IQR 5.8–12.8) versus 6.1 pg/mL (IQR 3.7–8.7), P = 0.01]. In HD patients, congestive heart failure and ischemic heart disease were associated with higher IL-6 levels but this was not seen in PD patients. IL-6 levels did not differ depending on the presence/absence of diabetes. There was no difference in IL-6 or hs-CRP levels in HD patients using low-flux compared with high-flux membranes.
DISCUSSION
In this study, exploring the magnitude and variability of circulating inflammatory markers in dialysis patients, and using the same protocol in two prevalent cohorts of HD and PD patients, respectively, there was a high degree of fluctuation of IL-6 and hs-CRP levels in both cohorts. However, HD patients had overall higher IL-6 and hs-CRP levels, and also higher variability of these levels, compared with the PD patients.
Previous studies comparing IL-6 and hs-CRP levels in HD and PD in smaller cohorts of have shown conflicting results. Two concluded that there was no difference in IL-6 and CRP in HD versus PD patients [12, 21] whereas Haubitz et al. [11] reported an increase in CRP after start of HD but not after start of PD, and the latter group had CRP levels similar to healthy controls. Factors that potentially cause and maintain inflammation differ between the dialysis modalities. In HD, dialyzer membranes are thought to affect plasma cytokine concentrations, in part by activating leukocytes [22]. The dialysate is also a potential source of cytokine induction [23]. Although we previously reported that no correlation appeared between CRP variability and access type (fistula versus graft, fistula versus catheter) [10], vascular access is known to be a source of inflammation [24]. The importance of residual renal function should not be dismissed, as markers of inflammation increase with decreasing glomerular filtration rate (GFR), possibly through a combination of increased production and decreased metabolic clearance [25]. In patients starting renal replacement therapy, GFR was reported to be inversely associated with CRP and IL-6 levels [26]. In contrast, Maksic et al. [27] did not find a correlation between residual renal function and IL-6 levels in continuous ambulatory PD patients. The patients in our HD cohort probably had a lower residual renal function than the PD cohort (data not obtained in the HD cohort). Exit site and catheter tunnel infections as well as overhydration may be other contributors to inflammation in PD patients [28, 29]. The majority of patients in the HD cohort, who were included over 10 years ago, used low-flux filters. There has been an increase in the use of high-flux filters and online hemodiafiltration (HDF) in recent years. However, in a study comparing the effects of a single dialysis session on circulating levels of hs-CRP, IL-6 and pentraxin 3 between low-flux membranes, high-flux membranes and online HDF, no significant differences were seen [30]. We therefore speculate that changes occurring over time in the use of newer membranes and techniques may have had a limited impact on inflammatory markers, and that other factors, such as comorbidity, are more important determinants of inflammation.
PEW (by SGA) emerged as a strong predictor of inflammation variability in this study. Previous studies demonstrate significant correlations between inflammation and PEW [20, 31]. Reduced appetite, oxidative stress, increased resting energy expenditure and an inhibiting effect of IL-6 on IGF-1 may all contribute to uremic wasting [18, 32–34]. IL-6 and hs-CRP were strongly and inversely related to plasma albumin levels in both cohorts. Inflammation directly affects the synthesis of albumin [35] and in the absence of inflammation, plasma albumin levels are usually normal in the uremic milieu [36]. Albumin levels in dialysis patients are additionally affected by many other factors, such as renal and (in PD) dialysate losses, dialysis procedure and hydration status [37–39].
Comorbidity, which is strongly associated with PEW, was in this study related to the monthly fluctuation of IL-6, but not of CRP levels. We previously reported that comorbidity was related to weekly hs-CRP fluctuation in HD patients [10]. As dialysis modality and wasting were added to the multivariate analyses in this study, this may explain why comorbidity loses power to predict short-term variation in hs-CRP [15]. The interrelationship between PEW, inflammation and atherosclerosis has been discussed extensively since the late 1990s [6, 40, 41]. One can speculate that the fluctuation in the degree of inflammation shown in our data may reflect underlying comorbidities that maintain inflammatory activity, or the fact that patients suffer from these conditions partly because of underlying inflammation. The more stable nature and longer half-life of CRP [42, 43] may explain why more of the symptoms in the questionnaire correlated with hs-CRP than with IL-6 variation. By analyzing polymorphisms in the IL-6 gene, it was recently demonstrated that IL-6 may be causally involved in cardiovascular events in both non-renal [44] and chronic kidney disease patients [45]. In contrast, Zhang et al. [46] showed that CRP haplotypes did not predict CVD. This suggests that although CRP is a risk marker, it is not a risk factor for CVD. Indeed, although the prognostic value for all-cause and cardiovascular mortality in dialysis patients is quite similar for IL-6 and CRP [47], IL-6 is the stronger predictor of death [48].
Repeated measures of inflammation have been shown to add more information about outcome than a single value [10, 49, 50]. In interpreting variation, it is important to understand that it may be explained by fluctuations both within patients and between patients. In a 6-month study on monthly IL-6 variation in healthy individuals, mean IL-6 was 1.43 pg/mL (standard deviation 0.9), with a within-subject coefficient of variation of 48% [51]. Factors that are fixed, such as comorbidity, could lead to increased variation of inflammation within a patient and, at the same time, explain the difference in inflammation between patients with different burdens of comorbidity. In our cohorts, there were few patients with either stable high or stable low levels of inflammation (Figures 1 and 2), while a majority had overall large variations in hs-CRP and IL-6. Possibly, fluctuation in inflammation represents an unstable condition leading to a long-term decline in health and increased risk for mortality. Analyzing variability gives us an opportunity to better understand which factors underlie the inflammatory response.
Strengths and limitations of the study
This is the first study to compare inflammation in HD and PD patient cohorts using a similar protocol design, with repeated measurements of inflammatory markers and a simultaneous registration of inflammatory symptoms. The careful phenotyping with weekly CRP measurements and matching for age, sex, smoking, comorbidity and prevalence of PEW between the two dialysis groups also strengthen the study.
Some caveats of this study should be acknowledged. First, the observation period is limited to 3 months. Second, as the PD cohort is rather small, lack of power may explain why comorbidity does not associate with CRP variability. The comorbidity assessment was based solely on information from patients' charts and clinical events relied on patients' self-report. Although comorbidity did not differ significantly between HD and PD, we cannot exclude that patients selected for PD may constitute a healthier group of patients. Finally, as IL-6 was measured monthly this limits the information on the fluctuations of this marker.
CONCLUSION
Systemic levels of both hs-CRP and IL-6 are higher in HD than in PD patients. As the short-term variability of inflammation is higher among HD patients, further studies should evaluate if this contributes to a survival advantage in PD. As PEW is strongly related to both IL-6 and CRP variability, careful monitoring of nutritional status and proper nutritional interventions are important in inflamed dialysis patients.
CONFLICT OF INTEREST STATEMENT
None of the authors has any conflict of interest to declare. The results presented in this paper have not been published previously in whole or part, except in abstract format. Abstracts from this study have been presented at the ERA-EDTA Congress 2014 and the 2014 meeting of the Swedish Society of Nephrology.
ACKNOWLEDGEMENTS
We thank the participants in this study. We are indebted to our research staff at KBC (Åsa Lindé, Annika Nilsson, Ann-Christin Emmoth and Ulrika Jensen) and KFC (Björn Anderstam, Monica Eriksson and Ann-Christin Bragfors-Helin). The collection of patient material was supported by an unrestricted grant from Amgen. Baxter Novum is the result of a grant from Baxter Healthcare Corporation to the Karolinska Institutet. This work was made possible by research funding from Karolinska Institutet.


Comments