


Abstract
Persistent CD4 T-cell lymphopenia after kidney transplantation has been associated with an increased occurrence of opportunistic infections, malignancies and even mortality, but studies have focussed only on the first few years after kidney transplantation. In this study, we investigated the risk factors and clinical significance of long-term profound CD4 lymphopenia detected ≥10 years after renal transplantation.
Between 2007 and 2010, 6206 CD4 T-cell counts, including 1507 counts <300/mm3, were identified in an active cohort of 1876 kidney transplant patients. We identified 27 HIV-negative lymphopenic kidney transplant recipients out of 513 patients with graft survival over 10 years. We compared this cohort to 54 non-lymphopenic controls matched for the date of kidney transplantation.
The prevalence of CD4 lymphopenia 10 years after transplantation was 5.3%. CD4 T-cell lymphopenia was associated with significantly lower thymic output and with B-cell lymphopenia (P < 0.05). The duration of pre-transplant dialysis, but not the use of lymphopenic induction or recipient age, was significantly associated with a persistent CD4 lymphopenia (6.1 versus 3.0 years, P = 0.008). CD4 lymphopenia was associated with a higher frequency of cancer (50 versus 29.6%, P = 0.047). Most strikingly, long-term lymphopenia was significantly and independently associated with an accelerated decline in renal allograft function (P = 0.005), despite a similar rate of biopsy-proven acute rejection and comparable immunosuppression.
Our study shows an association between long-term CD4 T-cell lymphopenia in kidney recipients and malignancy and an accelerated decline of kidney allograft function.
INTRODUCTION
One of the most challenging goals in solid organ transplantation is to tailor the immunosuppressive regimen for each individual patient to minimize immunosuppression while still preventing allograft rejection. Opportunistic infections and malignancies often attributed to the immunosuppression itself remain a significant cause of death after transplantation [1]. To date, no biomarker has been identified to detect over-immunosuppression and its associated deleterious sequelae [2]. Lymphodepletive therapies, particularly anti-thymocyte globulins (ATGs), administered at the time of transplantation are commonly associated with early lymphopenia. Indeed, ATG therapy induces a profound and early decrease in circulating T-cell number followed by progressive immune reconstitution [3]. This reconstitution predominantly occurs by two main mechanisms: thymic output of newly generated T-cells and lymphopenia-driven homeostatic proliferation. Several studies have shown that increased thymic output may persist unexpectedly long-term after kidney transplantation, even in adult patients [4, 5]. It has been proposed that the increased interleukin 7 (IL-7) bioavailability resulting from T-cell lymphopenia can drive thymic function rebound [5, 6].
Immune reconstitution is completed by 2 years after transplantation in the majority of kidney transplant recipients [3]. Persistent CD4 T-cell lymphopenia after 1 year post-transplant has been associated with an increased occurrence of opportunistic infections such as Pneumocystis jirovecii pneumonia (PCP) [6, 7], skin carcinomas [8], cardiovascular events [9] and even increased mortality [10]. The vast majority of studies investigating the significance of CD4 T-cell lymphopenia, however, focussed only on the first few years after kidney transplantation. All such studies have identified lymphodepletive therapies as the main risk factor for early CD4 lymphopenia. In contrast, the mechanisms and clinical significance of late (>10 years) CD4 lymphopenia remain poorly investigated and largely unknown.
We aimed to investigate the prevalence, related comorbidities and mechanisms of long-lasting CD4 lymphopenia ≥10 years after kidney transplantation.
METHODS
Study design and patients
This is a single-centre retrospective study examining the consequences and risk factors of persistent long-term lymphopenia after kidney transplantation. The study consisted of a matched case–control analysis comparing kidney transplant recipients with and without lymphopenia. From 2007 to 2010, 6206 T lymphocyte counts were measured from 1876 kidney transplant recipients actively followed at our institution. Twenty seven patients who had undergone kidney transplantation at least 10 years prior to the time of enrolment and had a CD4+ T-cell count <300/mm3 on two consecutive samples at least 1 year apart between 2007 and 2010 were enrolled in the study. Each lymphopenic case was matched with two non-lymphopenic controls (Figure 1); controls were selected as those transplanted just before and right after each case in order to ensure comparable immunosuppressive regimens, post-transplant management and post-transplant duration. The median time between the respective dates of transplantation of cases and controls was 13 days. The two groups were compared for demographic characteristics, treatment and post-transplant outcomes. A matched cohort study involving the same patients from the time of inclusion to last follow-up to investigate patient and graft survival was also performed. For survival analysis, the date of the first CD4 T-cell count was set as the starting point of follow-up. Non-inclusion criteria included positive HIV serology, transplantation duration <10 years and self-limited CD4 lymphopenia.
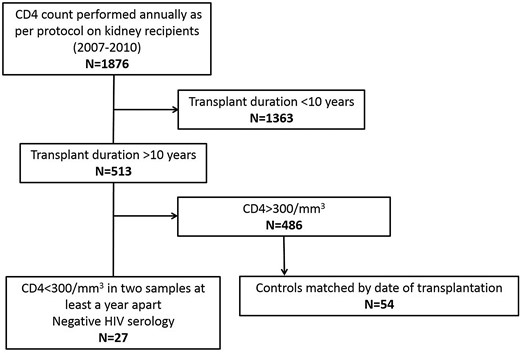
Flow chart of the study.
Clinical and demographic data were collected from 2010 to 2012 from medical records. Cardiovascular events were defined as myocardial infarction, peripheral arterial disease of the lower limbs, cerebral stroke and aortic aneurysm. Opportunistic infections were defined as toxoplasmosis, systemic or oesophageal candidiasis, CMV disease, EBV reactivation, BK virus nephritis, cryptosporidiosis, pneumocystis pneumonia and mycobacterial infection. Progression of graft dysfunction was defined as a 50% increase in serum creatinine level and/or graft failure.
Flow cytometry
We performed extensive lymphocyte phenotypic analysis via flow cytometry in all the consenting patients of the study cohort who visited our institution between November 2012 and December 2014. Thorough analyses of T- and B-cell phenotypes were performed in 23 patients, including 11 from the lymphopenic group and 11 from the control group. Counting and phenotyping of lymphocyte subsets were performed on fresh whole blood. Absolute lymphocyte counts were determined using MultiTest CD3-APC/CD8-perCP/CD45-PE/CD4-FITC (SK3, 2D1, SK1 and SK7 clones, respectively) antibody mix with Trucount beads according to the manufacturer's instructions with a FACSCalibur cytometer (BD Biosciences, Le Pont de Claix, France). Immunophenotyping of T and B cells was performed on a CANTO II cytometer (BD Biosciences); the results were analysed using FlowJo (Tree Star, Ashland, OR, USA) software. The following antibodies (clones) were obtained from BD Biosciences: CD4 (RPA-T4), CD8 (RPA-T8), CD31 (L133-1), CD45RA (L48), CD45RO (UCHL-1), CD57 (HNK1), CD19 (HiB19), CD20 (L27), CD38 (HB7), IgD (IA6-2), CD27 (M-T271). The CCR7 antibody (clone 150503) was purchased from R&D Systems (Minneapolis, MN, USA).
CD4 and CD8 T-cell subsets were defined as follows: naive cells (CD45RO− CD45RA+CCR7+), recent thymic emigrants or RTE (CD45RO−CD45RA+CCR7+CD31+), central memory cells or TCM (CCR7+CD45RA−), effector memory cells or TEM (CCR7−CD45RA−) and terminally differentiated TEM or TEMRA (CCR7−CD45RA+).
B cells (CD19+) were defined as the following subsets according to the expression of IgD and CD38: naive cells (bm1: IgD+CD38−), naive activated cells (bm2: IgD+CD38+), germinal centre cells (bm3+4: IgD−CD38++), early memory cells (bm5: IgD-CD38+), memory cells (bm5: IgD-CD38−), plasma cells or plasmocytes (IgD-CD38+++) and transitional cells (bm2′: IgD+CD38++).
Histological analysis
As per our standard protocol, a screening biopsy was performed at 10 years post-transplantation. A renal pathologist (M.R.), blinded to the CD4 T-cell counts, retrospectively studied the available protocol kidney biopsies performed 10 years after transplantation for the lymphopenic (n = 7) and control groups (n = 12). All histological lesions were scored according to the current Banff classification.
Statistical analysis
Continuous variables are presented as means ± SD and categorical variables as counts and percentages. Characteristics of lymphopenic and non-lymphopenic patients were compared using conditional logistic regression analysis to take into account the matched design of our study.
Survival Kaplan–Meier curves were created. For the prognostic analysis of composite outcome, a Cox proportional hazard model was fitted using cluster robust standard errors estimation to take into account the matched design of our study. The proportional hazard assumption was tested by a weighted residual method. Variables with P-values <0.20 in univariate analysis were introduced into multivariate Cox analysis through a stepwise backward selection.
As data from all patients were not available for exhaustive lymphocyte counts and histological features of protocol biopsies, matched testing was not possible. In these cases, continuous variables were compared using the non-parametric two-tailed Mann–Whitney test and categorical variables were compared using the χ2 test or Fischer exact test.
All analyses were performed using R software (R Foundation for Statistical Computing, Vienna, Austria) or PRISM (version 5.00; GraphPad Software, San Diego, CA, USA).
RESULTS
More than 5% of the kidney transplant recipients experienced CD4 lymphopenia after 10 years post-transplant
Between 2007 and 2010, 6206 CD4 T-cell counts, including 1507 counts <300/mm3, were measured in a cohort of 1876 kidney transplant patients, at the following approximate time points: day 0, 3 months post-transplant, 1 year post-transplant and subsequent annual visits each year post-transplant (Figure 2). Each dot represents a single lymphocyte count and thus different dots may be attributed to the same patient evaluated at multiple time points. Overall, the graph shows the CD4 T-cell count trajectory after kidney transplantation. The prevalence of CD4 lymphopenia peaked just after kidney transplantation and then decreased over time. The point prevalence of CD4 lymphopenia (defined by a CD4+ T-cell count <300/mm3) at 2, 5 and 10 years post-transplantation were 20.2, 14.3 and 9.8%, respectively (Figure 2).
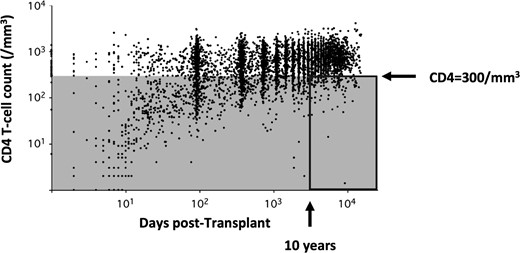
CD4+ T-cell count trajectory after renal transplantation. Each dot depicts one of the 6595 CD4 T-cell counts performed in 1876 renal transplant recipients over time. Five hundred and thirteen patients of the cohort had at least two lymphocyte counts ≥10 years after transplantation. This study focussed on the 27 patients with a CD4+ T-cell count <300/mm3 (grey area) at least twice 1 year apart after 10 years of transplantation (delineated by a rectangle, prevalence of 5.26%).
Demographic characteristics of lymphopenic and non-lymphopenic populations were remarkably similar in terms of recipient age, gender, rank of transplantation and time elapsed since transplantation. However, the overall time spent on dialysis before the current transplantation was significantly longer in the lymphopenic group (6.1 ± 5.2 years versus 3.0 ± 3.0 years; P = 0.008) (Table 1). To ensure that the sustained lymphopenia observed over 10 years post-transplantation was not due to chronic viral infections, we compared CMV, EBV and hepatitis virus serology and PCR in the lymphopenic and non-lymphopenic groups (Table 2). Of note, the two groups were comparable at the time of transplantation and at inclusion with regard to virologic status (Table 2).
Demographics and baseline characteristics
| Demographic data | CD4+ T-cell lymphopenia (N = 27) | Missing data | Controls (N = 54) | Missing data | P-value |
|---|---|---|---|---|---|
| Age (years) | 58 ± 14 | 0 | 54 ± 14 | 0 | 0.140 |
| Male (%) | 14 (51.9) | 0 | 31 (57.4) | 0 | 0.610 |
| Transplant duration (years) | 19.1 ± 9.2 | 0 | 18.8 ± 8.7 | 0 | 0.620 |
| Rank of renal transplantation >1 [n (%)] | 1 (3.7) | 1 | 6 (11.1) | 1 | 0.310 |
| Recipient age at transplantation (years) | 38 ± 17 | 0 | 33 ± 15 | 0 | 0.160 |
| Serum creatinine level at inclusion time (µmol/L) | 152 ± 84 | 0 | 138 ± 58 | 1 | 0.510 |
| eGFR at inclusion time (mL/min/1.73 m2) | 50.7 ± 17.5 | 0 | 58.6 ± 24.3 | 1 | 0.150 |
| Dialysis duration (years) | 6.1 ± 5.2 | 2 | 3 ± 3 | 1 | 0.008 |
| CD4+ T-cell (/mm3) | 230 ± 45 | 0 | 885 ± 346 | 0 | <0.001 |
| Lymphocyte (/mm3) | 807 ± 313 | 0 | 1854 ± 638 | 1 | <0.022 |
| CD8+ T-cell (/mm3) | 305.7 ± 253 | 0 | 568 ± 287 | 1 | 0.004 |
| Gammaglobulin (g/L) | 11.2 ± 4.5 | 0 | 11.6 ± 3.3 | 4 | 0.810 |
CMV, EBV and hepatitis viral status at the time of transplantation and at inclusion
| Viral status (n) | Lymphopenic | Missing data | Non-lymphopenic | Missing data | P-value |
|---|---|---|---|---|---|
| Transplantation time (D0) | |||||
| CMV | n = 15 | 12 | n = 33 | 21 | |
| D−R− | 4 (26.7) | 4 (12.1) | ns | ||
| D+R− | 3 (20.0) | 9 (27.3) | ns | ||
| D−R+ | 5 (33.3) | 10 (30.3) | ns | ||
| D+R+ | 3 (20.0) | 10 (30.3) | ns | ||
| EBV | n = 9 | 18 | n = 16 | 38 | |
| D−R− | 1 (11.1) | 0 (0.0) | ns | ||
| D+R− | 2 (22.2) | 0 (0.0) | ns | ||
| D−R+ | 1 (11.1) | 5 (31.3) | ns | ||
| D+R+ | 5 (55.6) | 11 (68.8) | ns | ||
| Hepatitis virus | n = 14 | 13 | n = 26 | 28 | |
| Anti-HCV: D−R− | 13 (92.9) | 26 (100.0) | ns | ||
| HBsAg: D−R− | 14 (100.0) | 25 (96.2) | ns | ||
| Positive anti-HBs (recipient) | 13 (92.9) | 24 (92.3) | ns | ||
| Inclusion | |||||
| CMV | n = 21 | 6 | n = 42 | 12 | |
| Positive test CMV IgG | 13 (61.9) | 24 (57.1) | ns | ||
| Positive blood CMV PCR | 0 (0.0) | 0 (0.0) | ns | ||
| Past CMV infection | 2 (7.4) | 5 (9.3) | ns | ||
| EBV | n = 27 | 0 | n = 54 | 0 | |
| Positive blood EBV PCR | 3 (11.1) | 1 (1.9) | ns | ||
| Past EBV/PTLD | 2 (7.4) | 0 (0.0) | ns | ||
| Hepatitis virus | n = 27 | 0 | n = 54 | 0 | |
| Positive blood HCV/HBV PCR | 6 (22.2) | 5 (9.3) | 0.17 | ||
| HCV/HBV infection | 7 (25.9) | 12 (22.2) | ns | ||
D, donar; R, recipient; HBsAg, hepatitis B surface antigen; HBV, hepatitis B virus; HCV, hepatitis C virus; ns, not significant; PCR, polymerase chain reaction; PTLD, post-transplant lymphoproliferative disorder.
Long-term CD4 lymphopenia did not correlate with the use of lymphodepletive agents
To assess the potential role of specific immunosuppressive agents associated with long-term persistence of CD4 lymphopenia, we compared the immunosuppressive regimens administered to the two study groups (Table 3). The groups did not differ with respect to the use of lymphodepletive therapies (anti-thymoglobulins or OKT3) either as induction therapy or anti-rejection therapy (Table 3). There was also no statistical difference at 10-years post-transplant in the frequency of patients treated with calcineurin inhibitors, steroids or azathioprine for maintenance therapy, though a greater number of lymphopenic patients received mycophenolate mofetil (44 versus 20%, P = 0.02). Importantly, at the time of lymphocyte phenotyping (19.1 ± 9.1 and 18.8 ± 8.7 years after transplantation in the lymphopenic and control groups, respectively), there was no longer any significant difference in mycophenolate mofetil exposure between the two groups (Table 3).
Induction therapies and maintenance immunosuppressive regimens
| Immunosuppressive regimens | CD4+ T-cell lymphopenia (N = 27) | Missing data | Controls (N = 54) | Missing data | P-value |
|---|---|---|---|---|---|
| ATG or OKT3 induction therapy [n (%)] | 19 (79.2) | 3 | 29 (61.7) | 7 | 0.300 |
| ATG induction [n (%)] | 14 (58.3) | 3 | 19 (40.4) | 7 | 0.155 |
| OKT3 induction [n (%)] | 5 (20.8) | 3 | 11 (23.4) | 7 | 0.807 |
| Acute rejection [n (%)] | 14 (56) | 2 | 33 (66) | 4 | 0.404 |
| ATG induction or rejection treatment [n (%)] | 15 (62.5) | 0 | 21 (44.7) | 0 | 0.157 |
| Maintenance immunosuppressive therapy at 10 years of transplantation [n (%) of patients] | |||||
| Steroids | 22 (100) | 5 | 47 (100) | 7 | 1 |
| Calcineurin inhibitor | 16 (64) | 2 | 34 (68) | 4 | 0.810 |
| mTOR inhibitor | 2 (8) | 2 | 2 (4) | 4 | 0.490 |
| Mycophenolate mofetil | 11 (44) | 2 | 10 (20) | 4 | 0.022 |
| Dosage (g/day) | 1.3 ± 0.49 | 2 | 1.1 ± 0.43 | 4 | 0.610 |
| Azathioprine | 12 (48) | 2 | 33 (66) | 4 | 0.110 |
| Dosage (mg/day) | 108 ± 18 | 2 | 105 ± 37 | 4 | 0.390 |
| Maintenance immunosuppressive therapy at last follow-up [n (%) of patients] | |||||
| Steroids | 23 (88.5) | 1 | 49 (92.5) | 1 | 0.570 |
| Calcineurin inhibitor | 14 (53.8) | 1 | 34 (64.2) | 1 | 0.210 |
| mTOR inhibitor | 2 (7.7) | 1 | 2 (3.8) | 1 | 0.490 |
| Mycophenolate mofetil | 9 (34.6) | 1 | 19 (35.8) | 1 | 0.870 |
| Dosage (g/day) | 1.1 ± 0.6 | 1 | 0.8 ± 0.3 | 1 | 0.150 |
| Azathioprine | 10 (38.5) | 1 | 18 (34) | 1 | 0.630 |
| Dosage (mg/day) | 56 ± 35 | 1 | 93 ± 37 | 1 | 0.210 |
Long-term CD4 lymphopenia was associated with malignancies and mortality
To investigate whether long-term lymphopenia resulted in an increased rate of immunosuppression-related complications, we examined the occurrence of infections, malignancies and cardiovascular disease in the two groups (Table 4). The rate of infectious complications was markedly high in both groups (88 versus 74%, P = 0.14), with pyelonephritis as the most frequent infection type (Table 4). The incidence of opportunistic infections was not significantly different between patients with CD4 lymphopenia and controls (22.2 versus 13%, P = 0.29) (Table 4).
Malignancies, infectious complications and cardiovascular events
| Complication/event | CD4+ T-cell lymphopenia (N = 27) | Missing data | Controls (N = 54) | Missing data | P-value |
|---|---|---|---|---|---|
| Neoplastic and infectious complications [n (%)] | |||||
| Malignancies | 13 (50) | 1 | 16 (29.6) | 0 | 0.047 |
| Skin cancer | 9 (34.6) | 1 | 8 (14.8) | 0 | 0.069 |
| PTLD | 3 (11.5) | 1 | 2 (3.7) | 0 | |
| Infectious complications | 23 (88.5) | 1 | 40 (74.1) | 0 | 0.140 |
| Graft pyelonephritis | 9 (34.6) | 1 | 15 (27.8) | 0 | |
| Pneumonia | 5 (19.2) | 1 | 5 (9.3) | 0 | |
| Sinusitis | 2 (7.7) | 1 | 5 (9.3) | 0 | |
| Angiocholitis, sigmoiditis, cholecystitis | 2 (7.7) | 1 | 5 (9.3) | 0 | |
| Opportunistic infection | 6 (22.2) | 1 | 7 (13.0) | 0 | 0.290 |
| Cardiovascular risk factors and events [n (%)] | |||||
| Hypertension | 22 (84.6) | 1 | 38 (71.7) | 1 | 0.280 |
| Diabetes mellitus | 5 (19.2) | 1 | 13 (25) | 2 | 0.570 |
| Treated dyslipidemia | 13 (50) | 1 | 40 (75.5) | 1 | 0.026 |
| Cardiovascular events | 9 (34.6) | 1 | 15 (28.3) | 1 | 0.490 |
Notably, 50% of the lymphopenic patients developed at least one cancer after transplantation, whereas the controls had a lower (29.6%) rate of malignant complications (P = 0.047). Skin carcinomas were more frequent in the lymphopenic group (35 versus 15%) but fell short of statistical significance in this limited population (P = 0.07). Of note, the number of patients who received chemotherapy post-transplant was low in both groups and not significantly different (n = 4 versus n = 3, P = 0.21). Chemotherapy was administered for post-transplant lymphoproliferative disorder (n = 5), acute leukaemia (n = 1) and recurrent head and neck cancer (n = 1).
No increased rate of cardiovascular events was observed in the lymphopenic patients as compared with the controls (34.6 versus 28.3%, P = 0.49). There was also no significant difference in the cardiovascular risk factors of the two groups: hypertension (85 versus 72%, P = 0.28) and diabetes mellitus (19 versus 25%, P = 0.57). Interestingly, the number of patients treated for dyslipidemia was significantly lower in the CD4 lymphopenic group (50 versus 75.5%, P = 0.026).
A striking finding that emerged from our analysis was that the lymphopenic patients had a higher mortality rate as compared with controls {hazard ratio [HR] = 4.53 [95% confidence interval (CI) 1.23–16.65], P = 0.02} (Figure 3A).
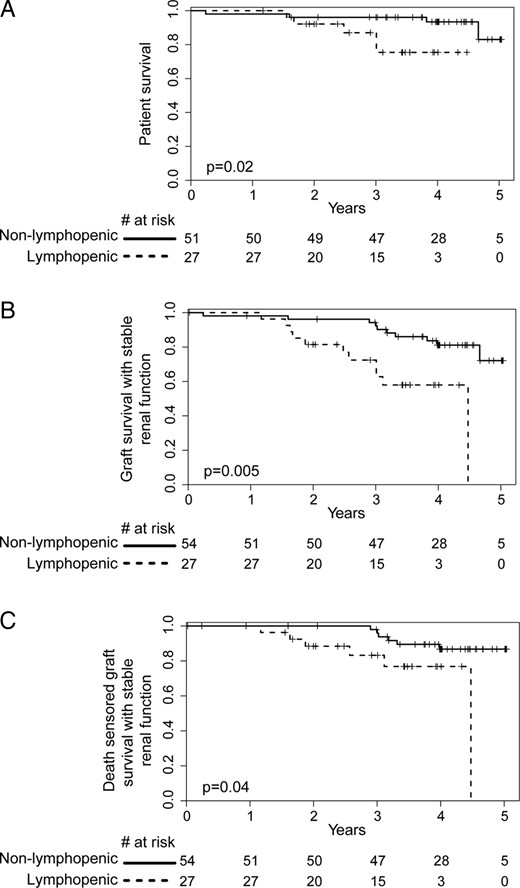
Kidney graft survival analysis. (A) Patient survival, (B) overall renal allograft survival and (C) death censored renal allograft survival analysis in both lymphopenic and non-lymphopenic groups. A composite criterion was used to assess the progression of the chronic allograft nephropathy (50% increase of serum creatinine level or kidney graft loss). Survival curves start at the date of inclusion in the study.
CD4 lymphopenia was associated with an accelerated decline in renal function and inflamed fibrosis
To further assess the impact of CD4 lymphopenia on graft outcome, we investigated changes in renal function from the time of the immunological investigation to the last follow-up time point (Figure 3B and C). Long-term CD4 lymphopenia was significantly associated with a hastened decline in graft function [HR = 3.89 (95% CI 1.50–10.10), P = 0.005] (Figure 3B), even after censoring for death [HR = 3.52 (95% CI 1.03–11.99), P = 0.04] (Figure 3C), although creatinine levels (152 ± 84 versus 138 ± 58 µmol/L, P = 0.51) or eGFR (50.7 ± 17.5 versus 58.6 ± 24.3 mL/min/1.73 m2, P = 0.15) did not differ between the two groups at the time of study investigation. In the multivariate analysis, CD4 lymphopenia [HR = 4.58 (95% CI 1.78–11.79), P = 0.002], serum creatinine levels at inclusion time [HR = 1.01 (95% CI 1.0–1.02), P = 0.007] and cancer [HR = 2.35 (95% CI 1.04–5.33), P = 0.04] were independently associated with an increased rate of progression toward graft dysfunction (Table 5). In contrast, we did not find any correlation between total lymphocyte count or CD8 count at inclusion time and graft outcome (data not shown).
Univariate and multivariate analysis of factors associated with a significant decline in graft function
| Independent variable | P (univariate) | P (multivariate) | HR (95% CI) |
|---|---|---|---|
| CD4 T-cell lymphopenia | 0.005 | 0.002 | 4.58 (1.78–11.79) |
| Serum creatinine at inclusion time | 0.02 | 0.007 | 1.01 (1.00–1.02) |
| Malignancies | 0.105 | 0.04 | 2.35 (1.04–5.33) |
| Opportunistic infection | 0.099 | 0.980 | 0.99 (0.44–2.24) |
| Gender | 0.99 | ||
| Age at first lymphocyte phenotype | 0.763 | ||
| Dialysis vintage | 1.077 | ||
| Acute rejection | 0.869 |
In an attempt to elucidate the potential mechanisms of accelerated deterioration of graft function in the lymphopenic group, we retrospectively studied the 10-year protocol kidney biopsies available for the lymphopenic and control groups. Biopsies from the lymphopenic group revealed higher rates of interstitial fibrosis and tubular atrophy Banff scores of grades 2 and 3 than controls (43 versus 0%; Fischer's exact test, P = 0.04) and a significantly higher frequency of glomerulosclerosis (40 versus 12%, P = 0.029). Furthermore, we found a higher Banff score of total inflammation (ti), including the inflammatory cells infiltrating scarred parenchyma, in the biopsies performed in lymphopenic patients (0.43 ± 0.53 versus 0 ± 0, P = 0.004), although the i and t Banff scores were comparable in the two groups. None of the biopsies studied provided evidence of T-cell- or antibody-mediated rejection according to Banff classification.
CD4 lymphopenia was associated with lower thymic export
In the CD4 lymphopenic group, the mean CD8+ T-cell count (306 ± 253 versus 568 ± 287, P < 0.0001) was also significantly lower than in controls (Table 1). To investigate potential mechanisms underlying the lack of reconstitution in both of these T-cell compartments, we performed extensive lymphocyte phenotypic analysis via flow cytometry.
Naive T-cells, including CD31+ recent thymic emigrants, were significantly reduced in both CD4 and CD8 compartments in the lymphopenic group; the decrease in the number of naive cells largely accounts for the low CD4 and CD8 T-cell counts in these patients (Figure 4A and B). Central memory CD4 T-cells, but not effector memory T-cells or central memory CD8 T-cells, were significantly reduced in the lymphopenic group (Figure 4A and B). Among the CD8 memory T-cells, the TEMRA subset was also decreased in the lymphopenic group. In addition to T-cell lymphopenia, the group had significantly lower B-cell counts, mostly due to a dramatic reduction in naive, early memory and transitional B cells (Figure 4C).
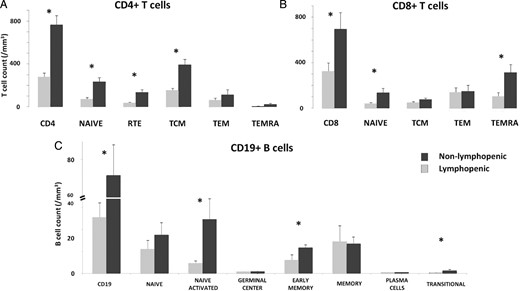
Phenotypic analysis of lymphocyte populations. A thorough phenotypic study of lymphocyte populations, including (A) CD4, (B) CD8 and (C) B cells, was performed in 19 patients: 10 in the lymphopenic group and 9 in the controls. *Indicates statistical significance (P < 0.05).
DISCUSSION
The most striking finding of this study is the significantly worse overall graft outcome in patients with long-term CD4 lymphopenia as compared with controls. Prior to our investigation, the most straightforward explanation for this finding would have been that lymphopenic patients experience more infections and therefore require more tapering of immunosuppression, unleashing the donor-specific alloimmune response. However, the immunosuppressive regimens were comparable between the two groups. Of note, in HIV-positive kidney transplant patients, in whom a higher rate of acute rejection has been observed, the trend of an inverse correlation between CD4 count and rejection rate has been noted [11]. Several factors may explain this possibly counterintuitive association. Lymphopenia induces the homeostatic proliferation of the remaining T-cells, predominantly depletion-resistant memory T-cells known to be less sensitive to immunosuppressive drugs [12] and immunoregulation [13]. In our study, the patients with long-term CD4 lymphopenia had significantly more extensive fibrosis and inflammation within the scarred area on the 10-year protocol biopsies, further supporting involvement of an immune-mediated mechanism in the accelerated decline in graft function. The total i score (ti), taking into account all inflammatory infiltrates, including those within scarred areas, was found to correlate better with graft survival than the Banff i [14] and has been proposed to be incorporated into Banff classification [15].
Previous studies [3] have predominantly focussed on early T-cell lymphopenia, which has been broadly ascribed to lymphodepletive therapies. Immune reconstitution following lymphodepletive induction is thought to lead to a complete recovery of the T-cell subsets within 2 years in the vast majority of kidney transplant recipients; however, at this time most but not all patients have a normal CD4 T-cell count [16, 17]. Besides, a recent study showed that ATG induction was associated with long-term impairment of T-cell function and related infections, even after the patients had normalized CD4 T-cell counts [18]. This is a reminder that the CD4 cell count incompletely assesses the recovery of an immunocompetent CD4+ T-cell pool.
After 10 years post-transplant, the overall prevalence of CD4 T-cell lymphopenia was ∼5%, nearly half the point prevalence at 10 years observed in our study (9.8%) as well as in others (9.2%) [19]. The negative impact of late CD4 lymphopenia on graft and patient survival might account at least in part for the low prevalence of CD4 lymphopenia after 10 years.
There is a great need for biomarkers to assess the immunosuppression requirement of patients to minimize over-immunosuppression; however, there has been little success to date in spite of extensive efforts [2]. CD4 T-cell lymphopenia after kidney transplantation has emerged as a valuable indicator of increased risk of skin malignancies [8] and opportunistic infections, the most concerning of which is Pneumocystosis jirovecii [17, 20], consistent with studies in HIV-infected patients [18, 19]. The increased rate of neoplasias and skin carcinomas in lymphopenic patients is a reminder of the key role of T-cells in immune surveillance, including in the eradication of tumour cells induced by ultraviolet light and drug exposure [21]. Our study found an association between CD4+ T-cell counts and malignancies in general, but that finding remains controversial [19, 22] and merits further evaluation in larger studies. Interestingly, in our cohort, skin carcinomas accounted for 62 and 44% of the first malignant events in the lymphopenic and control groups, respectively.
A higher rate of cardiovascular events has been associated with sustained lymphopenia in both HIV-infected patients [23] and kidney transplant recipients [9]. The prevailing paradigm proposes that immune reconstitution after profound CD4 lymphopenia skews the T-cell response toward its pro-inflammatory and pro-atherogenic Th1 component, especially if the host has been exposed to opportunistic pathogens [24, 25]. However, our study found a similar rate of cardiovascular events in lymphopenic patients and controls.
In contrast to the CD4 depletion observed within the early years after kidney transplantation, we did not find any association between long-lasting CD4 lymphopenia and depletive induction therapies. Individual genetic susceptibility, including polymorphisms in cytokines and cytokine receptors involved in T-cell homeostasis (IL-2, IL-7, IL-21), might play a role. Interestingly, the duration of pre-transplant dialysis was the sole clinical factor associated with long-term CD4 lymphopenia. Other studies have shown that uraemic toxins and end-stage renal disease negatively impact thymic function and lead to accelerated aging of the immune system [26, 27]. Taken together, these findings may help explain the generally worse graft outcomes and higher rates of post-transplant malignancies in patients who have undergone a prolonged period of dialysis before transplantation [26, 28]. Consistent with this, preserved pre-transplant thymic function has been associated with a decreased risk of developing opportunistic infectious diseases (pneumocystosis) [7] and neoplasias [29] after transplantation. In our study, the patients with long-lasting lymphopenia had a reduced number of naive CD4 and CD8 T-cells, which is associated with a dramatic decrease in recent thymic emigrants, although the two groups had comparable ages and graft function at the time of inclusion.
We acknowledge that our study has limitations with respect to its retrospective design and limited cohort size. However, organizing a large prospective study to investigate the incidence of a rare and late event, such as long-term CD4 lymphopenia, is virtually impossible. In addition, we paid close attention to possible selection bias due to the impact of changes in techniques and immunosuppressive drugs over time and we thus included controls matched for the date of transplantation. Our study only focussed on patients who had survived long after transplantation, which could also create bias.
In conclusion, our study demonstrates that late CD4 lymphopenia is associated with a greater risk of malignancies and mortality compared with non-lymphopenic patients. Furthermore, these rates are comparable to those identified in previous studies focussing on early post-transplant lymphopenia. In addition, late CD4+ lymphopenia was found to be an independent risk factor for accelerated decline in graft function. This study should prompt clinicians to evaluate thymic function in patients who have undergone long-term dialysis treatment. Our results provide a basis for the design of prospective studies attempting to tailor immunosuppressive regimens based on individualized risk assessment of prolonged lymphopenia.
CONFLICT OF INTEREST STATEMENT
None declared.
ACKNOWLEDGEMENTS
The authors are grateful to the health care staff at the departments of Adult Nephrology and Renal Transplantation, and to Laurence Vendrame, Mimouna Bensaïd and Marie Maschi, technicians at the Immunology Laboratory at Necker Hospital, Paris. The authors would like to thank the laboratory technicians of the Renal Pathology Department at Necker Hospital and especially Nicole Mariage for her invaluable help in collecting samples.
REFERENCES
Author notes
S.C. and J.Z. contributed equally to this work.


Comments