


Abstract
Hyperglycemia-induced endoplasmic reticulum (ER) stress and oxidative stress could be causes of renal fibrosis in diabetes. Oleanolic acid (OA) naturally occurs in fruits and vegetables. It has anti-inflammatory, antihyperlipidemic and antioxidant effects. N-acetylcysteine (NAC) is a precursor of glutathione, which has a strong antioxidant effect in the body. In this study, we investigated the therapeutic effects of OA and NAC in diabetic nephropathy (DN).
Otsuka Long-Evans Tokushima Fatty rats were treated with OA (100 mg/kg/day) or NAC (300 mg/kg/day) for 20 weeks by oral gavage.
The OA or NAC administration increased blood insulin secretion and superoxide dismutase levels, and decreased triglycerides and urinary albumin/creatinine levels. In the kidney, the damaged renal structure recovered with OA or NAC administration, through an increase in nephrin and endothelial selective adhesion molecules and a decrease in transforming growth factor-β/p-smad2/3 and ER stress. Reactive oxygen species and ER stress were increased by high glucose and ER stress inducers in cultured mesangial cells, and these levels recovered with OA (5.0 μM) or NAC (2.5 mM) treatment.
The findings in this study suggest that OA and NAC have therapeutic effects for DN through an antioxidant effect and ER stress reduction.
INTRODUCTION
Diabetic nephropathy (DN) is the most common cause of end-stage renal disease, and possibly one of the reasons for increased mortality and morbidity in diabetic patients. It is characterized by glomerular hypertrophy, mesangial sclerosis and extracellular matrix protein deposition in the mesangium, resulting in a reduced glomerular filtration rate [1, 2]. These changes aggravate kidney function and increase urinary albumin excretion.
Otsuka Long-Evans Tokushima Fatty (OLETF) rats have polyuria, polydipsia, mild obesity and hyperglycemia. Histologically, the pancreatic islets changes can be classified into three stages in diabetes: (1) mild lymphocyte infiltrates in islets at less than 9 weeks of age. (2) hyperplastic change and fibrosis in islets at 10-40 weeks of age. (3) islets atrophy induces at >40 weeks of age. Also, OLETF rats have DN characteristics such as diffuse glomerulosclerosis, nodular lesion (thickening of basement membranes, mesangial proliferation, fibrin cap). These clinical and pathologic traits of disease in OLETF rats are similar to those of human Type 2 diabetes mellitus [3].
The endoplasmic reticulum (ER) is membranous and is involved in secretory protein folding, intracellular Ca2+ storage, and synthesis of unsaturated fatty acids, sterols and phospholipids [4]. Misfolded proteins accumulate under inappropriate conditions such as hypoxia, hypoglycemia and calcium or redox imbalance. Thus, prolonged ER stress induces various diseases, including cancer, metabolic disorders and stroke [5, 6].
In diabetic patients, hyperglycemia increases reactive oxygen species (ROS), which leads to increased levels of advanced glycation end products (AGEs) and their receptors, both of which can activate the pathways leading to additional ROS production [7]. ROS activates transcription factors that eventually increase the expression of extracellular matrix genes, resulting in progression to fibrosis and end-stage renal disease [8]. The nuclear factor erythroid 2-related factor 2/kelch-like ECH-associated protein 1 (Nrf2/Keap1) system provides critical cytoprotective effects against oxidative and electrophilic stress [9]. Nrf2 is normally maintained in the cytoplasm with the cytosolic repressor protein Keap1, which promotes ubiquitination and proteasomal degradation of Nrf2 [10, 11]. Activated Nrf2 induces the expression of several cytoprotective proteins such as NAD(P)H quinone oxidoreductase 1, heme oxygenase-1 (HO-1), glutamate-cysteine ligase and glutathione transferases [12].
Oleanolic acid (OA, 3β-hydroxyolean-12-en-28-oic acid) is a pentacyclic triterpenoid compound that exists ubiquitously throughout the plant kingdom and is therapeutically effective without apparent side effects [13]. Several studies reported that OA has antioxidant, microbicidal, antidiabetic, anti-inflammatory, hypolipidemic and antiatherosclerotic activities [14], and inhibits the generation of AGEs under diabetic conditions [15]. In addition, OA protects the kidney in streptozotocin-induced diabetic mice through anti-glycation effects [16].
N-acetylcysteine (NAC, 2-acetamido-3-sulfanylpropanoic acid) is a precursor of intracellular cysteine and glutathione in mammals, and several previous studies have shown that NAC has powerful antioxidant and protective effects in the β-cells of diabetic db/db mice, Zucker diabetic fatty rats and alloxan-induced diabetic CD1 mice. Moreover, NAC supplementation prevents hyperglycemia or improves glucose intolerance associated with the preservation of glucose-induced insulin secretion [17–20]. Previously, Ahmad et al. [21] showed that NAC treatment ameliorated renal injury in streptozotocin (STZ) and iomeprol-induced renal injury mice. Also, Shimizu et al. [22] found that urinary protein and urinary thiobarbituric acid reactive substances as an oxidative stress marker had been decreased by NAC treatment. Therefore, NAC can be used as a positive control for evaluating OA's effect on DN.
The pharmacological effects of OA and NAC have been demonstrated; however, the mechanism of their action in DN is not clear.
In this study, we explored not only the therapeutic potential of OA but also the mechanisms of both OA and NAC on DN in a type 2 diabetic rat model.
MATERIALS AND METHODS
Experimental animals and sample preparation
Long-Evans Tokushima Otsuka (LETO, non-diabetic control model) and OLETF (type 2 diabetes mellitus model) rats were purchased from Otsuka Pharmaceutical Co., Ltd (Tokushima, Japan). Animals were housed at constant temperature (20 ± 2°C) and humidity (50–60%) with a 12-h light and 12-h dark cycle. At 25 weeks of age, the rats were divided into four groups: LETO, OLETF, OA-treated OLETF and NAC-treated OLETF. The compounds were administered from 25 to 45 weeks of age by oral gavage. After the experimental periods, all rats were sacrificed. Serum and tissues were collected for further studies. All experiments were performed under the approval of the Institutional Animal Care and Use Committee (Yonsei University, Wonju, Korea).
Body weights, tissue weights and the glucose tolerance test
Body weights were measured every week from 25 to 45 weeks of age. Kidney, pancreas and liver tissue weights were measured after sacrifice. Twelve-hour fasting blood glucose levels were analyzed with the LifeScan SureStep (LifeScan, Burnaby, BC, Canada) from tail vein blood. Glucose (2.0 g/kg) was administered by intraperitoneal injection for glucose tolerance tests, and insulin solution (1.0 U/kg body weight, Humulin R; Eli Lilly, Indianapolis, IN, USA) was administered by intravenous injection for insulin tolerance tests. The serum glucose disappearance rate (short insulin tolerance test, KITT; %/min), which indicates the time necessary to reduce the basal glucose level by one-half, was calculated as 0.693/t1/2, where t1/2 was determined from the slope of the glycemic concentrations from 3 to 15 min after insulin injection. Pancreatic β-cell function was determined by the homeostasis model assessment of β-cell function (HOMA-β) [23]. HOMA-β = [20 × fasting insulin (μU/mL)]/[glucose (mmol/L) − 3.5].
Serum analysis
Serum insulin (Shibayagi Co., Shibukawa, Japan), adiponectin (AdipoGen Inc., Seoul, Korea) and superoxide dismutase (SOD) (Cayman Chemical, Ann Arbor, MI, USA) activities were measured using the respective commercially available kits. Serum glucose, total cholesterol (TC) and triglyceride (TG) levels were evaluated using enzymatic test kits (Asan Pharmaceutical Co., Seoul, Korea) according to the manufacturers' protocols.
Assessment of albuminuria
Twenty-four-hour urine was collected at 45 weeks using metabolic cages for the measurement of the urinary albumin (Exocell Nephrat II; Exocell Inc., Philadelphia, PA, USA) and creatinine (The Creatinine Companion; Exocell Inc.).
Transmission electron microscopy in kidney
For transmission electron microscopic (TEM) observations, the specimens were fixed in 2.5% glutaraldehyde for 2 h at 4°C, washed in 0.1 M phosphate buffer at pH 7.4 and then postfixed in 1% osmium tetroxide in the same buffer for 90 min. Then, the specimens were dehydrated through a graded series of ethanol, exchanged through propylene oxide and embedded in a mixture of Epon. Electron micrographs were taken at ×30 000 for each sample. The number of slit pores was counted and divided by the glomerular basement membrane (GBM) length (10 μm) to arrive at the linear density, using an image analysis system. The GBM thickness was assessed from measurements at three different cross-sectioning sites.
Immunohistochemistry and renal histopathology
Paraffin-embedded kidneys were sectioned and stained with periodic acid–Schiff (PAS) stain and Masson's trichrome stain. The tissue sections were examined with an optical microscope (×400) equipped with a charge-coupled device camera (Pulnix, Sunnyvale, CA, USA) to obtain pictures of glomeruli, which were subsequently transferred to a computer. For the immunohistochemical examination, deparaffinized kidney sections were incubated with primary rabbit anti-caspase 3. The sections were also incubated with rabbit anti-IgG secondary antibody for 30 min before immunoperoxidase staining was conducted, using the antibody enhancer horseradish peroxidase polymer (Biocare Medical, Walnut Creek, CA, USA). Slides were counterstained with hematoxylin. To assess caspase-positive areas, the digital images at ×400 magnification were analyzed using an image analysis system (SIS, GmbH, Munster, Germany).
Immunofluorescence in rat kidney
Paraffin-fixed sections (4.0 μm) were incubated overnight with the primary antibody, rabbit anti-8-OHdG (Santa Cruz Biotechnology, Danvers, MA, USA), at 4°C. After incubation with Alexa Fluor 488-labeled rabbit IgG (Santa Cruz Biotechnology) for 2 h at room temperature, sections were mounted with Fluoroshield and 4′,6-diamidino-2-phenylindole (Sigma Chemical Corp., St Louis, MO, USA) to label nuclei. A laser-scanning confocal microscope LSM 510 META (Carl Zeiss MicroImaging, Thornwood, NY, USA) was used to obtain the images.
Apoptosis assays
The terminal deoxynucleotidyl transferase dUTP nick end labeling (TUNEL) (Millipore, Billerica, MA, USA) technique was used to detect apoptotic nuclei, by following the manufacturer's protocol. The images were analyzed using an image analysis system. Magnifications were ×400.
RNA extraction and quantitative real-time polymerase chain reaction
Total RNA from the kidney cortex was isolated with TRIzol (Sigma). The cDNA was prepared using 1.0 μg total RNA of each sample, according to the protocols provided with a commercially available kit (QuantiTect® reverse transcription kit; Promega, Hilden, Germany). For quantitative real-time polymerase chain reaction (PCR), SYBR Green PCR master mix (Applied Biosystems, Foster City, CA, USA) was used in an ABI PRISM 7900HT Sequence Detection System (Applied Biosystems). The following primers were used: glyceraldehyde 3-phosphate dehydrogenase (GAPDH)-sense (5′-AGA CAG CCG CAT CTT CTT GT-3′), anti-sense (5′-TGA TGG CAA CAA TGT CCA CT-3′); vascular endothelial growth factor (VEGF)-sense (5′-TTG AGA CCC TGG TGG ACA TC-3′), anti-sense (5′-CTC CTA TGT GCT GGC TTT GG-3′); NOX4-sense (5′-CCA GAA TGA GGA TCC CAG AA), anti-sense (5′-GCA GCA GCA GCA TGT AGA AG-3′); catalase-sense (5′-ATT GCC GTC CGA TTC TCC-3′), anti-sense (5′-CCA GTT ACC ATC TTC AGT GTA-3′); GPx-sense (5′-GCT GCT CAT TGA GAA TGT CG-3′), anti-sense (5′-GAA TCT CTT CAT CTT GCC ATT-3′); and Type IV collagen-sense (5′-CCA GGA TTC CAA GGT CAG AA-3′), anti-sense (5′-CCC TGG TTC TCC TTT GAT GA-3′). Gene expression was analyzed using the 2−ΔΔCt method by normalizing with GAPDH gene expression in all experiments.
Immunoblotting
Kidney cortex and mouse mesangial cells were homogenized in PRO-PREP™ protein extraction solution (iNtRON Biotechnology, Korea) with proteinase and phosphatase inhibitors (GenDEPOT, Barker, TX, USA). The concentration of supernatant protein was measured using the bicinchoninic acid protein assay kit (Pierce, Rockford, IL, USA). The protein samples were electrophoresed on sodium dodecyl sulfate polyacrylamide gel electrophoresis (8–12%) gels and transferred to a polyvinylidene difluoride membrane. The blots were incubated with primary antibodies, including anti-Bcl2, anti-BAX, anti-VEGF, anti-α-SMA, anti-endothelial selective adhesion molecules (ESAM), anti-p-PERK, anti-p-eIF2α, anti-Nrf2, anti-Keap1, anti-ATF6 (Santa Cruz Biotechnology), anti-transforming growth factor (TGF)-β, anti-β-actin, anti-nephrin (Abcam), anti-p-smad2/3, anti-Bip, anti-CHOP and anti-caspase3 (Cell Signaling, Danvers, MA, USA) antibodies. Blots were visualized using a chemiluminescence UVP BioSpectrum 600 imaging system.
ER stress induction or inhibition in mesangial cells
Mouse mesangial cells were cultured at 37.5°C in Dulbecco's modified Eagle's medium containing 5.5 mM glucose, 1% antibiotics and 10% FBS. The cultured mesangial cells were fasted for 24 h and treated with low-glucose (LG, 5.5 mM) and high-glucose (HG, 30 mM) media. For ER stress induction, we used thapsigargin (Tg, 100 nM) treated with LG, and for ER stress inhibition, we used 4-phenylbutyrate (4PBA, 1 mM) treated with HG.
Determination of ROS generation
ROS generations in mesangial cells were measured with carboxymethyl-H2-dichlorofluorescein diacetate (CM-H2DCFDA; Invitrogen, Carlsbad, CA, USA). Briefly, mesangial cells were incubated for 30 min at 37°C with 10 µM CM-H2DCFDA in PBS. After 30min, excess dye was washed out using PBS. And then cells were fixed with 10% methanol in PBS for 5 min and washed again using PBS. Fluorescence was determined by laser-scanning confocal microscope.
Statistical analyses
Data are expressed as mean ± standard error of the mean (SEM). Statistical analyses were conducted using SPSS version 18.0 for Windows using one-way analysis of variance and Tukey's tests. A t-test was used for experiments with only two groups. Differences were considered significant at P < 0.05.
RESULTS
Anthropometric data and biochemical analysis in the experimental rats
At 45 weeks of age, body weight was not different among the OLETF, OA and NAC groups, but these three diabetic groups showed significantly reduced body weight compared with the non-diabetic LETO group (Supplementary data, Figure S1A). Pancreas weight was not different among the four groups. Kidney and liver tissues were significantly increased in the OLETF group compared with the LETO group, but epididymal fat tissue weight was significantly decreased in the OLETF group compared with the LETO group, but they were not changed by OA or NAC administration (Supplementary data, Figure S1B). Fasting blood glucose levels were significantly increased in the OLETF group compared with the LETO group (Figure 1A). OA or NAC administration slightly reduced the increased blood glucose, but this was not significant. The blood insulin level was significantly decreased in OLETF rats, but the level was increased after OA or NAC treatment (Figure 1B). Adiponectin level in OLETF rats was slightly decreased, but significantly increased in the NAC-treated group (Figure 1C). TC levels in all groups did not show significant differences, but TG levels were significantly decreased in the OA- or NAC-treated groups (Figure 1D and E).
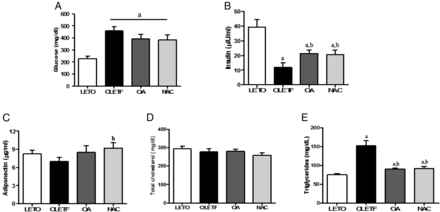
Biochemical characteristics of the experimental animals. Serum glucose levels were increased in the OLETF group compared with the LETO group, but the increased serum glucose levels were slightly reduced in the OA and NAC groups compared with the OLETF group (A). Otherwise, insulin levels were significantly decreased in the OLETF group. Decreased insulin levels were effectively increased in the OA- or NAC-treated groups (B). Adiponectin levels were slightly decreased in the OLETF group compared with the LETO group, but the adiponectin levels of the NAC group were significantly increased compared with the OLETF group (C). Serum TC levels did not show any difference among the four groups, but TG levels were increased in the OLETF group compared with the LETO group (D). Increased TG levels were significantly decreased by OA or NAC administration (E). LETO, control group; OLETF, diabetic control group; OA, oleanolic acid-treated diabetic group; NAC, N-acetylcysteine-treated diabetic group. Data are expressed as mean ± SEM. aP < 0.05 versus LETO, bP < 0.05 versus OLETF.
Changes in glucose control induced by OA or NAC administration
Intraperitoneal glucose tolerance test (IPGTT) and intravenous insulin tolerance test (IVITT) results are shown in Figure 2. The area under the curve for glucose in the OLETF group was significantly increased during IPGTT compared with the LETO group and was improved in the NAC-treated group compared with the OLETF group (Figure 2A–D). The mean rate constants for the disappearance (KITT) value, calculated during the insulin tolerance test, were significantly decreased in the OLETF group compared with the LETO group. The KITT value was slightly increased in the OA or NAC groups compared with the diabetes group (Figure 2E). The value of HOMA-β was decreased in the OLETF group compared with the LETO group, while the levels were significantly increased in the OA or NAC groups compared with the OLETF group (Figure 2F).
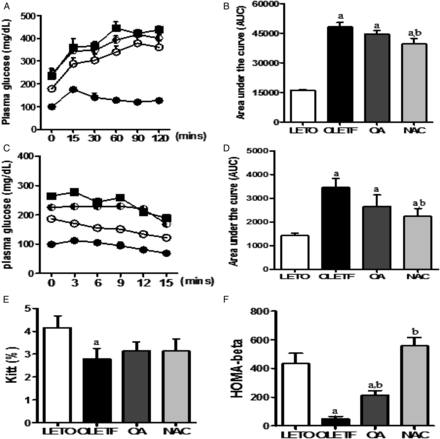
IPGTT and IVITT in experimental animals. Blood glucose levels were determined, and blood glucose area under the curve (AUC) was calculated after intraperitoneal injection of glucose (A, B) or after intravenous injection of insulin (C, D). The rate constant for the insulin tolerance test (KITT) was calculated after IVITT, and the insulin secretory capacity of β cells was calculated to use the HOMA-β formula (E, F). LETO, control group; OLETF, diabetic control group; OA, oleanolic acid-treated diabetic group; NAC, N-acetylcysteine-treated diabetic group. Data are expressed as mean ± SEM. aP < 0.05 versus LETO, bP < 0.05 versus OLETF.
OA and NAC repaired renal damage and reduced albuminuria
In the OLETF group, reduced podocyte slit pore density was significantly increased after OA and NAC administration (Figure 3A and B). Otherwise, increased GBM thickness and glomerular volume in the OLETF group significantly recovered with OA or NAC treatment (Figure 3C–E). In the OLETF group, the expressions of nephrin and ESAM were significantly reduced compared with the LETO group, but the levels were significantly increased by OA or NAC administration. VEGF mRNA and protein levels were increased in the OLETF group, but OA or NAC administration decreased VEGF mRNA and protein levels (Figure 3F and G, Supplementary data, Figure S2A). The level of the kidney damage indicator, the urine albumin/creatinine ratio (ACR), was significantly increased in the OLETF group compared with the LETO group at 45 weeks of age. However, ACR was significantly decreased by OA administration, and ACR was slightly reduced in the NAC-treated group compared with the OLETF group (Figure 3H).
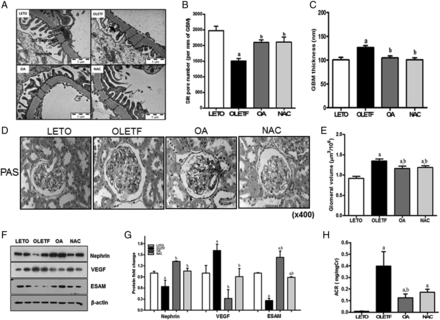
OA and NAC repaired damaged renal structures and urinary ACR (mg/mg Cr). Ultrastructural measurements by TEM were performed on the glomerular filtration barrier at ×30 000 magnification. The OLETF group experienced podocyte effacement and consequent reduced open slit pore density, while OA or NAC administration improved open slit pore density (A, B). Abnormally increased GBM thickness in the OLETF group was significantly reduced in the OA- or NAC-treated groups (A, C). At 45 weeks of age, renal glomeruli were stained with periodic acid-Schiff stain. Increased glomerular volume of the OLETF group was significantly decreased by OA or NAC administration (D, E). Decreased nephrin and ESAM levels in the OLETF group were significantly increased by OA or NAC administration. Moreover, increased VEGF was decreased in the OA- or NAC-treated groups (F, G). These changes reduced the increased urinary ACR in the OLETF group (H). LETO, control group; OLETF, diabetic control group; OA, oleanolic acid-treated diabetic group; NAC, N-acetylcysteine-treated diabetic group; ESAM, endothelial selective adhesion molecules. Data are expressed as mean ± SEM. aP < 0.05 versus LETO, bP < 0.05 versus OLETF.
OA and NAC suppressed diabetes-induced renal fibrosis
Glomerular fibrosis was increased in the OLETF group compared with the LETO group, but OA or NAC treatment reduced glomerular fibrosis (Figure 4A). Renal fibrosis was induced through TGF-β/p-smad2/3 pathway activation [24], and these levels were increased in the OLETF group. OA or NAC administration repaired renal fibrosis through reduced TGF-β/p-smad2/3 and α-SMA expression (Figure 4B and C). HG stimulation also increased TGF-β/p-smad2/3 expression in mesangial cells, and this expression was also reduced by OA or NAC (Figure 4D and E). However, the renal collagen IV mRNA levels were not significantly different among the four groups (Supplementary data, Figure S2A).
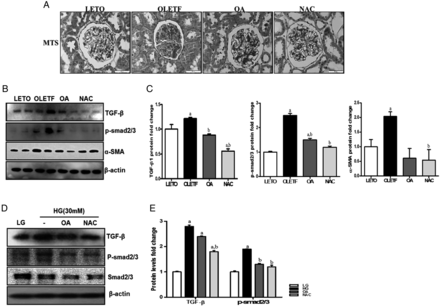
Antifibrosis effect of OA and NAC in OLETF rats. At 45 weeks of age, renal glomeruli were stained with Masson's trichrome stain (MTS) (A). In the OLETF group, increased glomerular fibrosis was decreased in the OA- or NAC-treated groups. In addition, the TGF-β/p-smad2/3 signal pathway, which induces tissue fibrosis, was increased in the OLETF group compared with the LETO group; increased TGF-β/p-smad2/3 levels were decreased by OA or NAC administration (B, C). HG also increased the TGF-β/p-smad signal pathway, and OA or NAC treatment reduced TGF-β/p-smad2/3 expression (D, E) in MES-13. LETO, control group; OLETF, diabetic control group; OA, oleanolic acid-treated diabetic group; NAC, N-acetylcysteine-treated diabetic group; LG, low-glucose (5.5 mM) media; HG, high-glucose (30 mM) media; MES-13, mouse mesangial cells. Data are expressed as mean ± SEM. aP < 0.05 versus LETO, bP < 0.05 versus OLETF.
OA and NAC suppressed ER stress and apoptosis
Mitochondrial dysfunction and increased ER stress are contributory to cell death [25]. In our study, the renal ER and mitochondria structures were broken in the OLETF group; moreover, ER stress markers (e.g. p-PERK, p-eIF2α, ATF6, Bip and CHOP) were increased compared with the LETO group. Increases in these markers were significantly reduced by OA or NAC administration, and increased ATF6 was significantly reduced by OA. Significantly increased CHOP in the OLETF group was reduced by NAC (Figure 5A–C).
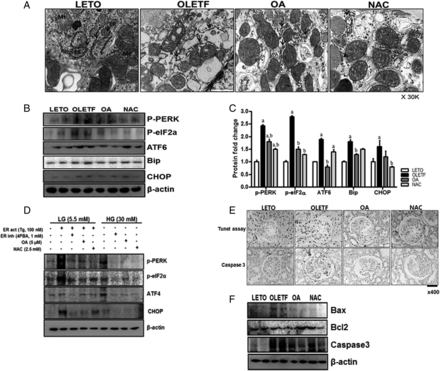
OA and NAC reduced ER stress and apoptosis. In the OLETF group, ER and mitochondrial structures were damaged by diabetes (A). ER stress markers (B, C) and cell apoptosis (E, F) were significantly increased in the OLETF group, but ER stress and apoptosis were decreased by OA or NAC administration. HG also activated ER stress markers in mesangial cells, but OA or NAC administration inhibited ER stress induction (D). LETO, control group; OLETF, diabetic control group; OA, oleanolic acid-treated diabetic group; NAC, N-acetylcysteine-treated diabetic group; LG, low-glucose (5.5 mM) media; HG, high-glucose (30 mM) media; Tg, thapsigargin; 4PBA, 4-phenylbutyrate. Data are expressed as mean ± SEM. aP < 0.05 versus LETO, bP < 0.05 versus OLETF.
ER stress markers, such as p-PERK, p-eIF2α, ATF4 and CHOP, were increased by LG with Tg. OA and NAC administration in LG with Tg reduced ER stress markers. HG stimulation also induced ER stress, and OA or NAC treatment inhibited ER stress, similar to the ER stress inhibitor 4PBA, in mouse mesangial cells (Figure 5D). The apoptosis regulator Bcl2 was decreased and apoptosis regulators Bax and caspase 3 were increased in the OLETF group. These changes increased glomerular cell apoptosis, and OA or NAC administration reduced apoptosis (Figure 5E and F). ER stress markers such as p-eIF2α and CHOP, which were increased by hydrogen peroxide in mesangial cells, were reduced by 4PBA, OA or NAC treatment (Supplementary data, Figure S3B).
OA and NAC ameliorate oxidative stress
8-Hydroxydeoxyguanosine (8-OHdG) is a ubiquitous marker of oxidative stress. In the OLETF group, glomerular 8-OHdG expression was increased, but it was reduced by OA or NAC administration (Figure 6A). SOD is known to protect cells or tissues against oxidative stress. In the OLETF group, serum SOD levels were significantly reduced compared with those in the LETO group, but the OA or NAC group showed significant recovery of serum SOD levels (Figure 6B). Renal glutathione peroxidase (GPX) and Nox4 mRNA levels were increased, but catalase mRNA levels were decreased in the OLTF group compared with the LETO group. OA or NAC administration reduced the increased GPX and NOX4 mRNA expression or increased the reduced catalase mRNA level (Supplementary data, Figure S2B). The reduced renal Nrf2 and HO-1 expression levels in the OLETF group were increased by OA or NAC administration (Figure 6C). HG increased ROS levels compared with LG stimulation in mouse mesangial cells. The HG with OA or NAC administration showed decreased ROS levels (Figure 6D). Tg-induced ER stress increased ROS formation (Supplementary data, Figure S3A) and Nrf2 expression, similar to HG stimulation. ROS and Nrf2 levels were dramatically reduced by Tg with OA or NAC administration in the mesangial cells. In the HG state, the ER stress inhibitor 4PBA markedly reduced Nrf2 expression, and OA or NAC administration also reduced Nrf2 expression compared with HG exposure (Figure 6E).
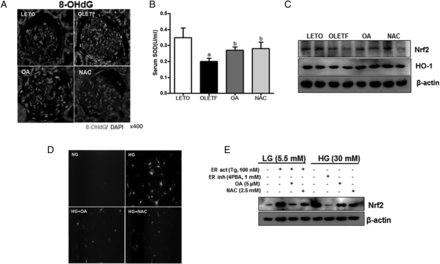
Antioxidant effect of OA and NAC. Increased 8-OHdG in the OLETF group was decreased by OA or NAC administration (A). Otherwise, serum SOD, renal Nrf2 and HO-1 levels were reduced in the OLETF group; OA or NAC restored these decreased levels (B, C). ROS was increased by HG stimulation; OA or NAC reduced ROS production (D). Moreover, Nrf2 expression was increased by Tg or HG, and 4PBA, OA or NAC treatment reduced the increased Nrf2 (E). LETO, control group; OLETF, diabetic control group; OA, oleanolic acid-treated diabetic group; NAC, N-acetylcysteine-treated diabetic group; SOD, superoxide dismutase; LG, low-glucose (5.5 mM) media; HG, high-glucose (30 mM) media; Tg, thapsigargin; 4PBA, 4-phenylbutyrate. Data are expressed as mean ± SEM. aP < 0.05 versus LETO, bP < 0.05 versus OLETF.
OA and NAC reduced ER stress-induced TGF-β/smad2/3 signaling
Figure 7A was shows that, not only Tg-induced ER stress but also HG increased HG-induced renal fibrosis-related signals, TGF-β/smad2/3 signaling and α-SMA, but these were reduced by 4PBA, OA or NAC treatment in mesangial cell (Figure 7A). The findings of our study combined with previous report showed that OA and NAC protected hyperglycemia-induced renal damage (Figure 7B). These results show that these two compounds may become therapeutically promising agents for the progression of DN.
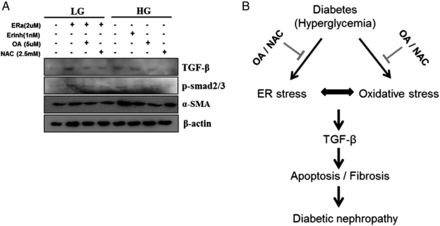
OA and NAC have antifibrotic effects through reduction of ER stress and oxidative stress in mesangial cells, as with ER, stress inducers and HG increased TGF-β, p-smad2/3 and α-SMA expression. OA or NAC administration not only inhibited ER stress but also reduced p-smad2/3 and α-SMA (A). Schematic representation of the proposed mechanism. OA or NAC repaired renal fibrosis and albuminuria through the reduction of oxidative stress and ER stress (B). OA, oleanolic acid-treated diabetic group; NAC, N-acetylcysteine-treated diabetic group; LG, low-glucose (5.5 mM) media; HG, high-glucose (30 mM) media; Tg, thapsigargin; 4PBA, 4-phenylbutyrate.
DISCUSSION
The major findings of the present study were (i) OA and NAC reduced oxidative stress via Nrf2 as an antioxidant transcription factor of oxidative and xenobiotic stress responses, (ii) OA and NAC inhibited ER stress and (iii) interplay between ER stress and oxidative stress induced cellular fibrotic and cellular apoptosis in DN. OA or NAC inhibited these interactions, thus ameliorating DN (Figure 7B).
In diabetes, hyperglycemia induces AGE production, protein kinase C pathways, the hexosamine pathway, stress signaling and mitochondrial dysfunction, which induce diabetic complications; these pathways are activated by hyperglycemia-induced ROS [26]. Hyperglycemia increases not only ROS but also ER stress. ER stress has been considered a new therapeutic target for several diseases, including diabetic complications [5]. However, the relevance of ROS and ER stress to DN is not adequately known, and how OA and NAC affect these is equally unknown.
Generally, the antioxidant enzyme SOD removes ROS formation from the cellular environment by catalyzing the dismutation of two superoxide radicals to hydrogen peroxide and oxygen [27], and this SOD level is decreased in diabetic patients with microalbuminuria [28]. Nrf2 is a transcription factor that activates antioxidant genes, and it is expressed in many tissues including the kidney. The Nrf2/Keap1 system is considered to be a major regulator of cytoprotective responses to oxidative and electrophilic stress [10]. Nrf2 suppresses hyperglycemia-induced oxidative stress and metabolic dysfunction. Nrf2 agonists improve metabolic profiles and renal injury in streptozotocin-induced diabetic mice [29, 30]. Both our study and another study showed the decreased Nrf2 in disease group. Tan et al. [31] showed that cardiac Nrf2 expression at 2 months after onset of diabetes (early stage) was increased but is significantly downregulated at 5 months after the onset (late stage) in diabetic hearts [31]. Interestingly, the Nrf2 expression was shown contrary to in vivo study, as Nrf2 increased by ER stress inducer or HG stimulation. During the early stage of disease, Nrf2 and Nrf2-dependent antioxidant response element (ARE)-driven genes are activated to inhibit oxidative stress such as ROS, electrophiles and xenobiotics. In the study by Yoh et al. [32], STZ-injection to nrf2-null mice developed renal impairments earlier and accompanied more severe mesangial injuries compared with STZ injected wild-type mice. Presumably, the Nrf2 was degraded in chronic condition, and it cannot activate the transcription factor and aggravate DN. In this study, the serum SOD levels, renal Nrf2 and its downstream target molecule, HO-1, were decreased in the OLETF group at 45 weeks of age, and these changes were reversed by OA or NAC administration. Otherwise, HG or ER stress inducer treatment increased Nrf2 expression in mesangial cells, and these changes were reversed by OA and NAC administration. Thus, our study indicated that Nrf2 has a compensatory effect for kidney protection at the early stage of diabetes; when antioxidant function is further impaired at the late stage of diabetes, this leads to a decreased Nrf2. Further study is necessary to characterize the mechanism of Nrf2 activation.
Prolonged ER stress is the cause of the homeostatic dysfunction of ER and induces endothelial–mesenchymal transition, apoptosis and inflammation. As a result, these changes induce cellular apoptosis, fibrosis and tissue damage [33]. TGF-β1 is a well-known key mediator in the pathogenesis of renal fibrosis [34]. It directly induces α-SMA, which has been suggested to play a role in the production of contractile force during wound healing and fibrocontractive diseases [35, 36]. In this study, ER stress increased in the OLETF group with HG and ER stress inducer treatment. Accordingly, TGF-β/p-smad2/3 pathway signals and α-SMA also increased. However, OA or NAC administration decreased both ROS and ER stress, and decreased renal fibrosis through the reduction of TGF-β/smad2/3 and α-SMA. These findings show that interaction between ER stress and oxidative stress is an important factor in inducing cellular fibrosis and apoptosis in DN. In addition, OA and NAC ameliorate DN through the inhibition of oxidative stress and ER stress in a type 2 diabetic rat model.
In summary, we demonstrated that OA and NAC have protective effects for DN through an antioxidant effect and ER stress reduction. Multiple complicated signaling agents are involved in the progressive development of DN. The results of this study suggest that OA and NAC can be promising therapeutic agents for the progression of DN.
CONFLICT OF INTEREST STATEMENT
None declared.
ACKNOWLEDGEMENTS
This research was supported by Basic Science Research Program through the National Research Foundation of Korea (NRF) funded by the Ministry of Education (2015R1A6A1A03032522). The authors are grateful to Prof. YS Kang (Division of Nephrology, College of Medicine, Korea University, Guro Hospital, Seoul, Republic of Korea) for providing the mouse mesangial cells (MES-13) and Ms. Sera Kim (Institute of Lifestyle Medicine, Yonsei University Wonju College of Medicine, Wonju, Gangwon-Do, Republic of Korea) for proofread this manuscript.
REFERENCES


Comments