


In addition to classically activated macrophages that have effector roles in tissue injury, alternatively activated M2 macrophages are involved in the resolution of inflammation in animal models of kidney disease. To clarify the clinical relevance of macrophage phenotypes in human glomerular diseases, we evaluated the renal accumulation of macrophages and plasma and urine levels of CD163, an M2 marker, in lupus nephritis (LN) patients.
Kidney biopsies and plasma and urine samples were obtained from LN patients who underwent renal biopsy between 2008 and 2012. CD163+, CD68+ and CD204+ cells were counted in paraffin-embedded and frozen sections. LN histological activity was evaluated semiquantitatively using the biopsy activity index. Plasma and urinary soluble CD163 (sCD163) concentrations were also measured and evaluated for their significance as potential LN biomarkers.
Immunohistological analysis of glomeruli from LN patients revealed that >60% of CD68+ macrophages had merged with CD163+ cells. The increased number of glomerular CD163+ macrophages was correlated with LN severity, as determined by the biopsy active index (r = 0.635). Urinary (u-) sCD163 level was strongly correlated with glomerular CD163+ cell counts and histological disease score as well as urinary monocyte chemoattractant protein 1 levels (r = 0.638 and 0.592, respectively). Furthermore, the u-sCD163 level was higher in patients with active LN than in those with other diseases.
Glomerular CD163+ macrophages are the predominant phenotype in the kidneys of lupus patients. These findings indicate that the u-sCD163 level can serve as a biomarker for macrophage-dependent glomerular inflammation in human LN.
INTRODUCTION
Macrophages have been implicated in the pathogenesis of renal diseases [1] and are functionally distinguished as a classically activated, inflammation-promoting M1 type and an alternatively activated M2 type that exhibits an anti-inflammatory function and contributes to wound healing [2, 3]. Animal studies have demonstrated that administration of M2 macrophages mitigates renal damage in adriamycin nephropathy, type 1 diabetes and experimental autoimmune encephalomyelitis [4–7]. In contrast, the functional phenotype of macrophages in human renal diseases is not known [8, 9].
CD163 is a type I transmembrane protein belonging to the cysteine-rich scavenger receptor superfamily type B that acts as a scavenger receptor for the haemoglobin–haptoglobin complex [10, 11]. CD163 is a surface marker expressed by M2 macrophages that accumulate during the healing phase of acute inflammation. It is actively released from the plasma membrane by metalloproteinases in response to certain inflammatory stimuli and diffuses to inflammatory tissues or enters the circulation in its soluble form (sCD163) [12, 13], which may have anti-inflammatory activity and is a useful marker of macrophage activation in inflammatory diseases such as sepsis, liver disease, malaria, autoimmune disorders and reactive haemophagocytic syndrome [11, 14, 15]. However, few studies have addressed the significance of sCD163 levels in urine [16].
Lupus nephritis (LN) is a feature of systemic lupus erythematosus (SLE) and is linked to poor clinical outcome in patients. Markers of SLE activity, including serum complement (C)3, C4 and anti-double-stranded (ds)DNA antibody, are conventional biomarkers for assessing disease severity [17], but are insufficient for predicting the histological classification of LN. Kidney biopsy is still regarded as the gold standard for histological assessment of LN. However, given that kidney biopsy is an invasive procedure, alternative indices have been proposed for evaluating nephritis [18, 19]. One such index is the level of urinary monocyte chemoattractant protein (MCP)-1, which is a biomarker that reflects disease status and can be used to predict LN flares, although it does not have adequate sensitivity or specificity for clinical applications [20].
Macrophage infiltration into the glomerulus plays a significant role in LN pathogenesis [21], and therefore the identification of macrophage phenotypes and urinary proteins derived from renal macrophages may provide useful information on LN histological activity. In this study, we investigated the renal accumulation of macrophage phenotypes in human LN and the significance of sCD163, particularly in urine, as a biomarker of LN.
MATERIALS AND METHODS
Patients and sample collection
Kidney biopsy, urine and plasma samples were obtained from 74 patients with LN (45.0 ± 16.9 years old; 16 males and 58 females) who underwent renal biopsy at Nagoya University or its affiliated hospitals between 2008 and 2012. LN plasma samples were collected from 68 patients in the cohort. Samples were also obtained in the same manner in 2010 from patients with minimal change nephrotic syndrome (MCNS), membranous nephropathy (MN), diabetic nephropathy (DMN), IgA nephropathy (IgAN) and ANCA-associated vasculitis (AAV) as disease controls and from healthy volunteers as normal controls. Normal kidney samples were obtained from a healthy part of kidneys that were removed because of cancer. Patients who received any renal replacement therapy at the time of sampling were excluded from the cohort. Clinical and laboratory data were collected retrospectively from medical records at the time of renal biopsy. The institutional review board of our institution approved this study.
Clinical and laboratory data were obtained at the time of kidney biopsy. The estimated glomerular filtration rate (eGFR) was calculated using the following formula: eGFR (mL/min/1.73 m2) = 194 × serum Cr (mg/dL)−1.094 × age−0.287 (×0.739 if female). Plasma and urine samples were stored at −80°C until use.
Urinary protein and creatinine (Cr) concentrations were measured by Mitsubishi Kagaku BCL Inc. (Tokyo, Japan).
Histological assessment
Histological classification of LN in renal biopsies was performed according to International Society of Nephrology/Renal Pathology Society (ISN/RPS) criteria [22]. Patients exhibiting class III or IV along with class V were categorized as class III and IV, respectively. The biopsy active index (BAI) was evaluated semiquantitatively based on previously reported pathological findings [23].
Immunohistochemical analysis of kidney biopsy samples
Kidney biopsy samples were fixed in 10% formalin, embedded in paraffin, and cut into 4-µm sections for immunohistochemistry. Sections were labelled with mouse anti-human CD68 monoclonal IgG3 (clone PG-M1; Dako, Glostrup, Denmark), mouse anti-human CD163 monoclonal IgG1 (clone 10D6; Abcam, Cambridge, UK) or mouse anti-human CD204 monoclonal IgG1 (clone SRA-C6; TransGenic, Tokyo, Japan). Immunoreactivity was detected with a secondary antibody and 3,3′-diaminobenzidine (DAB) from the Histofine Simple Stain Max PO kit (Nichirei, Tokyo, Japan). The average number of glomerular CD68+, CD163+ and CD204+ macrophages per glomerulus was determined by examining at least five glomeruli from each patient. Kidney samples from 64 patients were subjected to histological assessment for CD163+ macrophages; 62 of the kidney samples were analysed for CD68+ and CD204+ cells because fewer than five glomeruli were observed in two of the samples. DAB-positive areas in the renal cortex were examined for tubulointerstitial macrophage accumulation by microscopy (BZ 9000; Keyence, Osaka, Japan) in at least 12 consecutive high-power fields (400×) using image analysis software (Keyence).
Immunohistochemical analysis of renal tissue was performed to examine whether or not CD163+ cells expressed CD68 or CD204 as M2 macrophages. Mouse anti-human CD68 monoclonal IgG1 (clone KP1; Abcam), mouse anti-human CD163 monoclonal IgG1 (clone EDHu-1; AbduErotic, Raleigh, NC, USA) and mouse anti-human CD204 monoclonal IgG1 were fluorescently labelled using a Zenon Alexa Fluor 488 or 568 mouse IgG1 labelling kit (Life Technologies, Carlsbad, CA, USA) according to the manufacturer's instructions. Kidney samples were obtained from 10 class IV LN patients with at least one glomerulus in each section. More than 30 glomeruli were analysed. Positive cells were counted under a fluorescence microscope (Keyence).
Enzyme-linked immunosorbent assay
Plasma and urinary (u-) sCD163 concentrations were measured using enzyme-linked immunosorbent assay (ELISA) kits according to the manufacturer's instructions (DY1607 Duo Set; R&D Systems, Minneapolis, MN, USA). Plasma and urine samples were diluted 100- and 10-fold, respectively. Urinary MCP-1 concentration was determined using an ELISA kit (R&D Systems) in samples that were diluted 4-fold. All samples were processed in duplicate.
Statistical analysis
Data were analysed using JMP software. Continuous variables were compared using the Kruskal–Wallis, Steel–Dwass and Tukey/Kramer tests. Comparisons between cohorts with or without glucocorticoids (GCs) were made using Welch's t-test. For comparisons among LN classes, statistical values were evaluated in class III, IV and V patients because there were few class II LN patients in the cohort. The coefficient of determination was used to examine the strength of association between two continuous variables. Receiver operating characteristic (ROC) curves and the area under the curve (AUC) were used to assess the diagnostic value of each biomarker as well as cut-off value, sensitivity and specificity, and positive and negative likelihood ratios were calculated using SPSS software (SPSS Inc., Chicago, IL, USA).
RESULTS
Patient characteristics
Serum and renal biopsy samples were collected from 74 patients with LN at the time of their admission to Nagoya University Hospital and its affiliated hospitals for renal biopsies between 2008 and 2012. Similarly, samples were collected from patients with MCNS, MN, DMN, IgAN and AAV as disease controls, and from healthy volunteers (except for biopsy samples) as a normal control. Patient profiles and clinical data are shown in Table 1. Renal function, as determined by eGFR, was impaired in the DMN and AAV groups, and the degree of proteinuria varied among disease groups. Nine of 10 AAV patients were histologically active, as evidenced by an average rate of cellular or fibrocellular crescents >40%, whereas 38 LN patients were treated with either steroid or other immunosuppressive agents, and three patients received both prior to sample collection. Serological activity was evaluated according to serum C3 concentration and anti-dsDNA antibody, clinical activity was assessed by the Systemic Lupus Erythematosus Disease Activity Index, LN histology was determined based on ISN/RPS classification, and histological scores were evaluated according to BAI (Table 2).
Clinical and demographic data of the study population
| Normal | IgAN | AAV | MCNS | MN | DMN | LN | |
|---|---|---|---|---|---|---|---|
| Age at examination (years)a | 38.9 ± 8.8 | 37.2 ± 7.5 | 70.2 ± 6.5* | 48.8 ± 13.1 | 65.0 ± 11.1* | 59.3 ± 9.1* | 45.0 ± 16.9 |
| Sex (male:female) | 7:7 | 6:4 | 5:5 | 9:8 | 9:7 | 7:3 | 16:58 |
| Immunosuppressive treatment (number of patients) | 0 | 0 | 4 | 4 | 1 | 0 | 36 |
| Serum creatinine (mg/dL)a | 0.74 ± 0.16 | 0.92 ± 0.23 | 2.87 ± 2.13* | 0.98 ± 0.74 | 0.77 ± 0.30 | 2.63 ± 1.17* | 1.08 ± 1.00 |
| eGFR (mL/min/1.73 m2)a | 74.4 ± 20.7 | 60.1 ± 17.1 | 24.9 ± 20.9* | 61.3 ± 22.2 | 64.8 ± 21.5 | 18.6 ± 8.7* | 72.9 ± 36.2 |
| Proteinuria (g/gCr)a | N.D. | 1.40 ± 1.76 | 2.17 ± 1.99 | 7.94 ± 5.95* | 4.26 ± 4.20 | 9.76 ± 3.74* | 3.43 ± 3.44 |
| Urine sample (number of patients) | 14 | 10 | 10 | 17 | 16 | 10 | 74 |
| Plasma sample (number of patients) | 14 | 10 | 10 | 17 | 13 | 10 | 68 |
| Histologyb (number of patients) | 0 | 9 | 8 | 17 | 15 | 9 | 64 |
N.D., not detected.
aData are expressed as the mean ± SD.
bRenal specimens with more than five glomeruli were subjected to histological analysis by counting glomerular macrophages.
*The Tukey/Kramer test was used for comparisons with LN at a 5% significant level.
Clinical and laboratory data and histological findings of LN patients
| Number of patients | Valuea (normal range) | |
|---|---|---|
| C3 (mg/dL) | 72 | 52.5 ± 25.0 (86–160) |
| Anti-DNA antibody (IU/mL) | 65 | 102.1 ± 129.4 (<6.0) |
| CRP (mg/dL) | 68 | 0.77 ± 1.11 (<0.3) |
| Total SLEDAI | 67 | 13.6 ± 5.5 |
| Renal SLEDAI | 70 | 8.2 ± 4.0 |
| ISN/RPS class | ||
| II | 4 (3)b | |
| III | 8 (8)b | |
| III + V | 12 (12)b | |
| IV | 27 (21)b | |
| IV + V | 13 (10)b | |
| V | 10 (10)b | |
| Activity index | 74 | 4.9 ± 3.3 |
CRP, C-reactive protein; SLEDAI, systemic lupus erythematosus disease activity index.
aData are expressed as the mean ± SD.
bRenal specimens with more than five glomeruli were subjected to histological analysis by counting glomerular macrophages.
Glomerular CD163+ M2 macrophages are associated with kidney disease
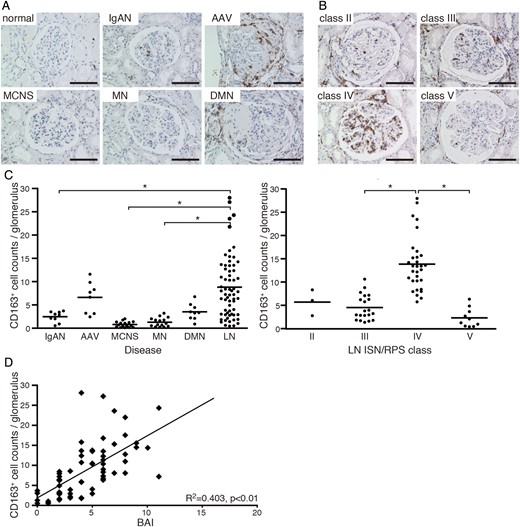
CD163 expression in patients with various kidney diseases and LN. (A) Microscopic observation of CD163+ macrophages (brown) in glomeruli of normal, IgAN, AAV, MCNS, MN and DMN kidneys. Bar: 100 µm. (B) Light microscopic analysis of LN classified according to ISN/RPS criteria. Bar: 100 µm. (C) Quantitative analysis of CD163+ cell numbers in glomeruli from patients with various kidney diseases (IgAN, n = 9; AAV, n = 8; MCNS, n = 17; MN, n = 15; DMN, n = 9; LN, n = 64; left) and LN (class II, n = 3; III, n = 20; IV, n = 31; V, n = 10; right). Each patient is represented by a dot and the mean value of each group is shown as a horizontal bar. *P < 0.05. (D) Correlation between glomerular CD163+ cell numbers from LN patients and BAI; each dot represents a value from a single patient. Coefficients of determination (R2) and P-values are shown.
In contrast to glomerular macrophage accumulation in LN, tubulointerstitial CD163+ macrophages were predominantly observed in patients with impaired renal function, irrespective of SLE disease status or pathological LN classification (Supplementary data, Figure S1).
CD163 is co-expressed with other M2 macrophage markers
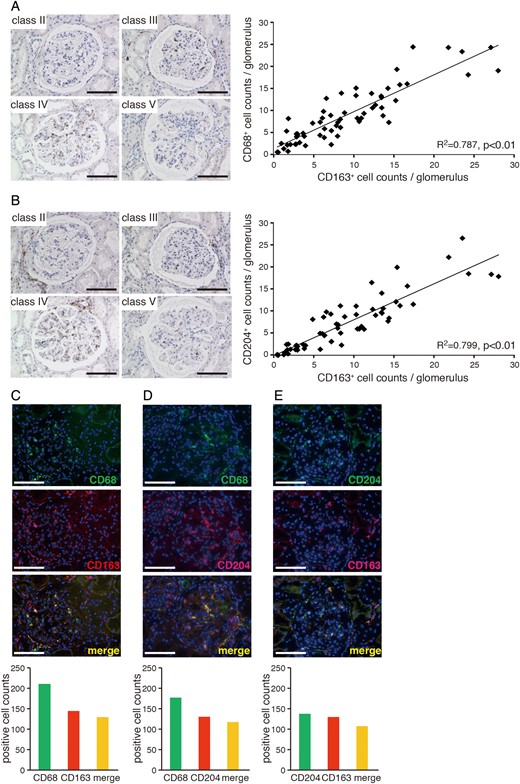
Association between the expression of CD163 and other M2 markers in LN. Glomerular CD68+ (A) and CD204+ (B) macrophages in LN classified according to ISN/RPS criteria (left panels). Bar: 100 µm. Correlations between CD68+ or CD204+ and CD163+ cell numbers in LN glomeruli (right panels) from 62 kidney samples. Coefficients of determination (R2) and P-values are shown. (C–E) Double-immunolabelling of CD68 and CD163 (C), CD68 and CD204 (D), and CD163 and CD204 (E) in LN glomeruli (upper panels). Bar: 100 µm. Quantitative analysis of single cells showing co-localization of markers in more than 30 LN glomeruli (lower panels) from a total of 10 patients.
u-sCD163 is a potential biomarker for LN
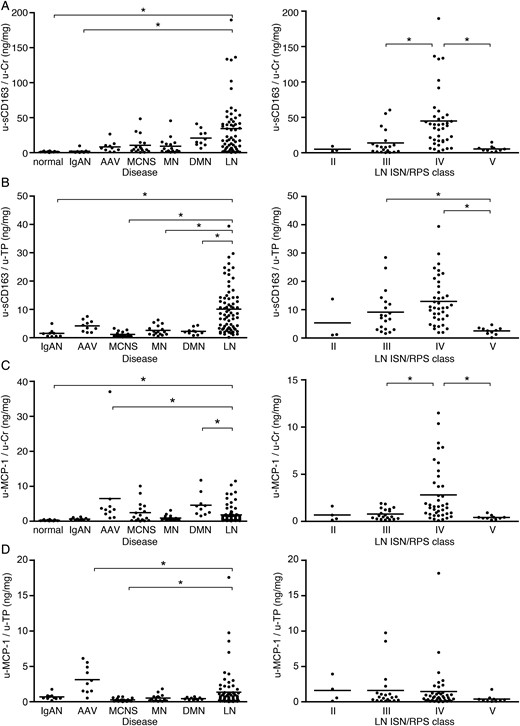
Urinary sCD163 and MCP-1 concentrations in various kidney diseases and LN. Urinary protein excretion of sCD163 (A and B) and MCP-1 (C and D) (u-sCD163 and u-MCP-1, respectively) corrected by urinary Cr or urinary total protein (u-Cr and u-TP) in renal diseases (left) and LN classified according to ISN/RPS criteria (right). Each patient is represented by a dot and the mean of each group is shown as a horizontal bar. *P < 0.05. In (B) and (D), data from normal subjects were excluded from the analysis because of the absence of proteinuria.
Elevated plasma sCD163 levels in LN are not associated with ISN/RPS class
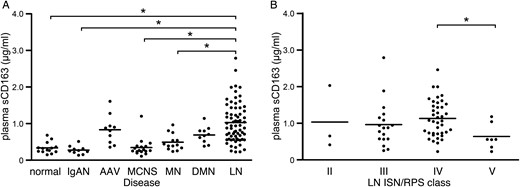
Plasma sCD163 and MCP-1 concentrations in various kidney diseases and LN. Plasma sCD163 concentrations in patients with kidney diseases (A) and LN classified according to ISN/RPS criteria (B); each patient is represented by a dot and the mean of each group is shown as a horizontal bar. *P < 0.05.
u-sCD163 level is correlated with renal CD163+ macrophage infiltration and LN histological activity
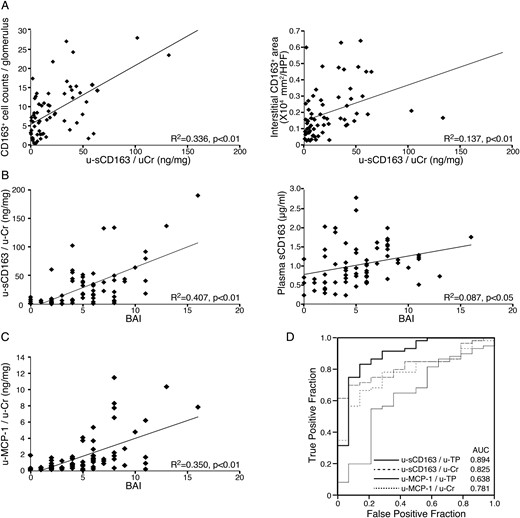
Association between sCD163 and histological LN subtype. (A) u-sCD163 levels are more highly correlated with CD163+ macrophage number in glomeruli (left) than in the interstitium (right). (B) The sCD163 level in urine (left) but not plasma (right) was highly correlated with BAI. (C) Correlation between urinary MCP-1 and BAI; each dot represents a value from an individual patient. Coefficients of determination (R2) and P-values are shown. (D) ROC curves of urinary sCD163 and MCP-1 (u-sCD163 and u-MCP-1, respectively) were generated to predict ISN/RPS class III and IV subpopulations. Values were corrected by urinary Cr or TP (u-Cr and u-TP, respectively) in LN patients, along with the corresponding AUCs.
Systemic GC administration does not affect glomerular CD163 expression and u-sCD163 excretion in class IV LN
GC promotes the conversion of human monocytes to CD163+ macrophages in vitro [32]. We therefore investigated the effect of GC treatment of LN on glomerular accumulation of CD163+ macrophages and u-sCD163 excretion. The number of glomerular CD163+ macrophages and u-sCD163 level were comparable between GC-treated and untreated populations in patients presenting class IV lesions (Table 3). Moreover, there was no association between GC dosage and CD163-related LN parameters (Supplementary data, Figure S2).
Clinical and laboratory data of class IV LN patients with or without GC treatment
| Non-GC | GC | |
|---|---|---|
| Number of patients | 17 | 21 |
| Age (years) | 48.8 ± 17.3 | 40.7 ± 16.0 |
| Sex (male:female) | 3:14 | 2:19 |
| Dosage of GC (mg/day) | 0 | 36.2 ± 20.7 |
| Serum creatinine (mg/dL) | 1.26 ± 0.99 | 1.40 ± 1.45 |
| eGFR (mL/min/1.73 m2) | 53.7 ± 21.1 | 66.5 ± 39.3 |
| Proteinuria (g/gCr) | 5.09 ± 3.85 | 6.15 ± 4.53 |
| C3 (mg/dL) | 35.3 ± 16.0 | 42.8 ± 16.6 |
| Anti-DNA antibody (IU/mL) | 158.0 ± 131.0 | 134.3 ± 166.5 |
| CRP (mg/dL) | 0.41 ± 0.68 | 0.96 ± 1.27 |
| Total SLEDAI | 16.1 ± 4.80 | 16.6 ± 5.20 |
| Renal SLEDAI | 10.0 ± 3.30 | 10.1 ± 3.50 |
| Activity index | 7.47 ± 2.92 | 7.24 ± 2.62 |
| u-sCD163/u-Cr (ng/mg) | 50.4 ± 48.3 | 43.9 ± 39.2 |
| u-sCD163/u-TP (ng/mg) | 12.6 ± 7.40 | 12.2 ± 9.50 |
| CD163+ cells/glomerulusa | 13.6 ± 5.20 | 14.5 ± 6.60 |
CRP, C-reactive protein; SLEDAI, systemic lupus erythematosus disease activity index.
Data are expressed as the mean ± SD. None of the parameters showed a significant difference.
Two patients receiving GC pulse therapy (>500 mg/day) at the time of sample collection were excluded.
aKidney samples from 13 patients in the non-GC group and 16 in the GC group were evaluated.
DISCUSSION
Macrophages can be classified into M1 or M2 subtypes. Glomerular infiltrating macrophages present the inflammatory M1 phenotype at the initiation of glomerulonephritis (GN), but an M2 macrophage population is involved in immunoregulation, in part during fibrogenesis at the resolution stage of glomerular inflammation [3]. However, there are few reports of macrophage phenotypes in GN [8, 9]. We investigated the accumulation of macrophages expressing CD163, a representative M2 marker, in human renal biopsy samples of various types of kidney disease as well as the clinical significance of sCD163 in the urine of LN patients.
CD163+ macrophages are considered to be M2 cells with anti-inflammatory activity. Stimulation with interleukin (IL)-6, IL-10 or macrophage colony-stimulating factor (M-CSF) induces differentiation of naïve M0 macrophages into CD163+ cells [11]. In both healthy and diseased individuals, CD163+ macrophages are distributed in various organs including the lymph nodes, spleen, bone marrow, lung, liver and skin [33]. CD163+ macrophages have also been detected in the kidneys of patients with IgAN and AAV [8, 9]. We observed that glomerular CD163+ cell infiltrates were negligible in MCNS, mild in IgAN and MN, moderate in DMN, and pervasive in the crescentic glomeruli of AAV patients. However, LN showed a higher average number of glomerular CD163+ macrophages than other renal diseases, although this effect varied according to LN class. A marked elevation in the renal levels of IL-6, IL-10 and M-CSF, which are essential for macrophage differentiation into CD163+ cells, has previously been reported in human LN [19, 34]. These findings indicate that the glomerular microenvironment modified by inflammation can convert infiltrated macrophages to the CD163+ phenotype. In addition to glomeruli, CD163+ macrophages were also present in the tubulointerstitial area of LN kidneys. Notably, tubulointerstitial accumulation of CD163+ macrophages was highly correlated with eGFR expression but not with glomerular CD163+ cell number (data not shown). Additionally, CD163+ macrophages were frequently distributed in areas with tubulointerstitial fibrosis despite the presence of renal injury (data not shown), indicating that tubulointerstitial accumulation of CD163+ macrophages is not a disease-specific feature but rather reflects renal function in various types of chronic kidney disease.
Some in vitro studies have shown that CD163+ macrophages exert their anti-inflammatory function by producing IL-10 [35]; however, the in vivo roles of CD163+ cells are largely unknown. CD163 was observed to co-localize with IL-10 and chemokine (C-C motif) ligand 18, which are two cytokines with immunosuppressive and fibrotic activity, in macrophages that infiltrated into submandibular glands in IgG4-associated dacryoadenitis [36]. It is therefore possible that CD163+ macrophages are involved in immunosuppression and fibrosis in inflamed tissue. A functional analysis that includes cytokine profiling of CD163+ macrophages will be performed in future studies to clarify the significance of glomerular CD163+ macrophages in LN.
There are few reliable markers for assessing the inflammatory activity of the monocyte/macrophage lineage in GN. The proinflammatory status of macrophages is reflected by the expression of the calcium-binding proteins myeloid-related proteins 8 and 14 [37–39], which are therefore potential M1 macrophage markers. However, both of these proteins have been detected in monocytes and neutrophils in the glomerular infiltrate of renal diseases, and they are frequently expressed in highly proliferative forms of GN including LN and crescentic GN [40, 41]. These findings, along with the abundant glomerular accumulation of CD163+ macrophages in proliferative LN observed in the present study, suggest that both M1 and M2 macrophage phenotypes coexist in active glomerular lesions in GN. It is often difficult to estimate the time elapsed after disease onset from histological and clinical information. In LN, histological changes in glomeruli, including immune complex deposition, precede clinical symptoms of renal damage [42–44]. Renal biopsy is usually performed when patients show evidence of renal damage; as such, we often observe the subacute phase but not the initiation of glomerular inflammation in LN kidneys, at which time the development and resolution of inflammation may co-exist. This can explain our observation that the CD163+ M2 population accounted for over 60% of total glomerular CD68+ macrophages in class IV LN patients. Although we did not evaluate M1 macrophages in LN kidneys, the M1 and M2 definitions are not always clear, as these cells are plastic and there may be a continuum between M1 and M2 phenotypes during differentiation in a dynamic microenvironment depending on inflammatory status. Contrary to the prevailing view that M2 macrophages are involved in the resolution of tissue inflammation, histological evidence suggests that glomerular infiltration of CD163+ M2 macrophages precedes crescent formation in AAV patients [9]. Furthermore, a recent study of patients with Th1- and Th2-associated inflammatory diseases demonstrated that CD163+ macrophages co-expressed phosphorylated signal transducer and activator of transcription 1 and recombination signal binding protein for immunoglobulin kappa j region, both of which transcriptionally regulate M1 macrophage polarization, in inflammatory conditions [45]. Additional studies of transcription factors involved in macrophage polarization would be useful to clarify the role of CD163+ macrophages in glomerular injury, including LN.
Potential LN biomarkers identified in the circulation and urine include autoantibodies, antigens and cyto-/chemokines [17, 19]; urinary MCP-1 is among the most potent of these biomarkers [46, 47]. In the current study, urinary MCP-1 levels were highly associated with LN activity but also elevated in AAV and DMN patients; in these individuals, renal dysfunction was more severe than in LN patients, as indicated by higher serum Cr levels. Renal function is highly correlated with renal tubular damage; in an inflammatory setting, not only macrophages but also tubular cells secrete MCP-1 [48]. We therefore speculate that urinary MCP-1 excretion is not specific to glomerular damage in LN. In contrast, CD163 is expressed exclusively by M2 macrophages and is not secreted by other cell types, including tubular cells. Therefore, the u-sCD163 level accurately reflects renal conditions involved in macrophage infiltration, as evidenced by the greater AUC value compared with that determined for urinary MCP-1.
Finally, we did not determine the u-sCD163 level in LN patients after immunosuppressive therapy. Because almost all cases in our cohort exhibited clinical remission along with elimination of proteinuria, we did not expect sCD163 excretion. Repeated renal biopsies to evaluate curative effects are not a common practice unless patients show an unfavourable clinical course; therefore, performing a histological assessment for glomerular CD163+ cells after treatment is ethically unacceptable in patients with clinical remission. Because our cohort had a small number of class II LN cases, the significance of u-sCD163 in active LN was not fully evaluated and requires validation in a large cohort of LN patients. Nonetheless, u-sCD163 is a biomarker that can be evaluated noninvasively and directly reflects macrophage-mediated glomerular inflammation; it can also distinguish between class III/IV and V LN in patients who show relapsed proteinuria during their clinical course.
CONFLICT OF INTEREST STATEMENT
None declared.
ACKNOWLEDGEMENTS
The authors thank Ms N. Asano, Ms Y. Sawa and Mr N. Suzuki for their technical assistance. We also thank Dr Naoyuki Fukuda for providing access to the conference room at Nagoya Sakae Clinic (Nagoya, Japan). This work was supported by a Grant-in-Aid for Scientific Research (C) from the Ministry of Education, Culture, Sports, Science and Technology (N.T. and S. Maruyama) and by a Grant-in-Aid for Progressive Renal Diseases Research/Research on Intractable Diseases from the Ministry of Health, Labour, and Welfare of Japan (S. Maruyama and S. Matsuo). We also thank the Terumo Foundation for Life Sciences and Arts (N.T) and Aichi Kidney Foundation (N.E.) for their generous support.
REFERENCES


Comments