


Abstract
Protein-energy wasting (PEW) is common in patients undergoing hemodialysis (HD). Studies have assessed the positive effect of oral nutritional supplementation (ONS) or resistance exercise (RE) on nutritional status (NS) markers in patients undergoing HD.
The aim of this study was to assess the effect of ONS and RE on NS and the quality of life (QOL) of 36 patients undergoing HD. In a randomized clinical trial, patients were divided into the following two groups: a control group (ONS) that received a can of ONS during their HD sessions and an intervention group (ONS + RE) that received a can of ONS and underwent a 40-min session of RE during their HD sessions. Both interventions lasted 12 weeks. The patients' anthropometric, biochemical, dietetic and bioelectrical impedance measurements as well as their QOL, evaluated using the Kidney Disease Quality of Life Short Form, were recorded.
At baseline, 55.5% of patients presented with PEW according to International Society of Renal Nutrition and Metabolism criteria (20 patients). We found statistically significant changes from baseline in both groups, such as increases in body weight, body mass index, midarm circumference, midarm muscle circumference, triceps skinfold thickness, fat mass percentage, handgrip strength, phase angle and serum albumin. A decrease in the prevalence of PEW was observed in both groups at the end of the intervention. A delta comparison between groups showed no statistically significant differences in the anthropometric and biochemical parameters. No significant improvement was observed in QOL and body composition measured by bioimpedance vector analysis. Dietary energy and protein intake increased significantly during the study period for all patients.
Oral nutritional supplementation during HD improves NS. The addition of RE during HD does not seem to augment the acute anabolic effects of intradialytic ONS on NS.
INTRODUCTION
Patients undergoing hemodialysis (HD) have a high prevalence of protein-energy wasting (PEW). All alterations associated with chronic kidney disease (CKD) lead to a catabolic state and poor nutritional status (NS), which promote the loss of protein body stores and energy [1, 2].
These patients experience inadequate protein and energy intake [3], and the HD treatment itself induces a catabolic state [4, 5]. Several studies have shown that nutritional interventions, such as oral nutritional supplementation (ONS), during HD sessions reduce the risk of a catabolic state and improve the patient's NS [6–11]. Furthermore, exercise during HD has been widely reported to have physiological and psychological benefits [12–14]. The long-term effects of exercise on patients undergoing HD appear to be good because exercise reduces cardiovascular mortality and improves body weight, energy intake, body mass index (BMI), muscle strength, blood pressure control, quality of life (QOL) and control of diseases, such as diabetes [15, 16]. Resistance exercise (RE) is characterized by exercises in which the muscles, joints and thus the surrounding tissues are subjected to high-intensity stress for short periods of time, such as during the use of springs and pulleys and when lifting the body against gravity [17]. Recently we reported the effect of RE in adult HD patients. In that article we showed how RE during HD sessions provides an opportunity for improving the muscle mass and strength of HD patients, including those who are malnourished [18]. Few studies have assessed the capability of RE to further enhance the anabolic effects of ONS on NS, such as markers of muscle mass and muscle strength, in well-nourished chronic HD patients [19, 20]; however, until now, no study has evaluated both intradialytic interventions on patients with different nutritional statuses.
In the present study, we hypothesized that patients undergoing HD would have a better NS when receiving ONS and performing RE compared with patients receiving only ONS while undergoing HD.
MATERIALS AND METHODS
We conducted a clinical trial in which patients attending HD sessions were randomized to receive only ONS or to receive ONS and perform RE during HD sessions and were monitored for 12 weeks. This study was approved by the hospital ethics committee (registration number DI/15/105/03/020) and was therefore performed in accordance with the ethical standards laid down in the 1964 Declaration of Helsinki and its later amendments and in accordance with the CONSORT 2010 principles (http://www.consort-statement.org/). The study design, purpose and potential risks were explained to adult HD subjects before written informed consent was obtained.
The inclusion criteria were as follows: regular HD two times a week, signed informed consent, any gender, age >18 years and no physical activity. Patients with an amputation, hospitalization in the last 3 months, unsatisfactory attendance at HD sessions, pregnancy, excessive pallor, severe dyspnea, femoral fistula, arrhythmias, precordial pain, orthopedic or neurological compromises or cognitive alterations affecting their participation in the study were excluded. Additionally, patients with an intolerance to ONS, intolerance/contraindications to the exercise routine or infectious or cardiovascular complications during the study were eliminated. Patients who met the inclusion criteria were randomized into the two groups as shown below using the Research Randomizer program (www.randomizer.org).
All patients were provided with a diet plan that was calculated based on the recommendations issued by the Kidney Disease Outcomes Quality Initiative (KDOQI) guidelines [21] for their daily requirements of 35 kcal/kg, which was adjusted for age, sex and physical activity and included 1.2 g protein/kg, 25–35% fat and 50–60% carbohydrates as percentages of the total energy requirement. Associated comorbidities and serum electrolytes were considered when developing the diet plan.
Control group (ONS)
During the HD sessions, the patients received a can of a specialized oral nutritional supplement for maintenance dialysis patients that consisted of 434 kcal, 19.2 g protein and 22.8 g lipids (Nepro with Carb Steady, Abbott Nutrition). Nepro is low in vitamins A and D and high in folates and vitamin B6, and it includes high-oleic safflower oil, corn syrup solids and fructooligosaccharides (FOSs).
Intervention group (ONS plus RE)
The same specialized oral nutritional supplement given to the control group was given during the HD session, with half a can administered during the first hour of the HD session and half a can administered after the RE routine.
The patients were trained for 3 months according to an adaptation of the program ‘Exercise: A Guide for People on Dialysis’ [22]. Patients in our unit received 2 HD sessions/week, so they performed 24 sessions of RE.
One week prior to the clinical study, patients performed the physical conditioning exercise routine without any extra weight; afterwards, each subject was asked to use 500 g ankle weights and medium-resistance springs for their hands and arms, adjusted according to the location of the vascular access. Four types of RE were performed by the patients during the second hour of their HD session (four sets of 30 repetitions for 40 min). For the first exercise (lower leg extension), patients sat with their feet on the floor. This exercise consisted of slowly raising one leg up to waist height, slowly returning it to the floor and repeating the same movement with the other leg. For the second exercise (arm extension), the patients used medium-resistance springs. This exercise consisted of slowly pulling these springs up to their shoulders and slowly returning them to their original position. The patients who had a fistula performed this exercise with one hand; patients with a catheter performed the exercise with both hands. For the third exercise, patients reclined in a semi-recumbent position with their arms at the sides of the reclining chair (to maintain body balance). In this position, they slowly raised one leg up to head height without bending their knee and counted to five and then slowly returned the leg to its original position to repeat the exercise with the other leg. Finally, patients bent their knees one after another, taking them to their chest as if they were marching in the air (Figure 1). Each exercise period of 10 min was separated by 3 min of rest. The patients were advised to work with a level of perceived exertion of ‘somewhat strong’ (12–13 of Borg scale) [23]. For safety, the patients' heart rates and blood pressures were monitored throughout the session. If patients perceived the exercise as ‘very hard’ or ‘very, very hard,’ they were asked to slowly stop performing the exercise.
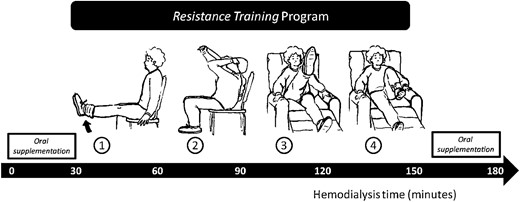
Schematic diagram of the study design. In the first hour, patients received half of the oral nutritional supplementation (ONS), during the second hour they performed four different resistance exercises and in the last hour they received the other half of the ONS.
Body composition and dietary intake assessment
Body composition and muscle function were measured using bioelectrical impedance and dynamometry, respectively, 20–30 min after each HD session at baseline and at 6 and 12 weeks. From the electrical properties of the body (resistance, reactance and the phase angle) measured using conventional impedance (single frequency; Quantum System, RJL Systems, Clinton Township, MI, USA), we plotted the bioelectrical impedance vectors against those of a healthy reference population [24]. The values of R and Xc in ohm/m were transformed into the bivariate Z-scores of Z(R) and Z(Xc) using the gender-specific means and standard deviations (SDs) of the healthy reference population, therefore defining one set of tolerance ellipses (50, 75 and 95%) independent of gender. Individual vectors were plotted on the Z-score graph. The mean vectors of the groups were represented as point vectors with their 95% confidence ellipses. Separate 95% confidence ellipses indicated a statistically significant difference between the mean vector positions on the RXc plane (P <0.05, which is equivalent to a significant Hotelling's T2 test). The ellipses were plotted using bioimpedance vector analysis (BIVA) software [25]. Muscle strength was measured by hand dynamometry (Smedley III, Takei Scientific Instruments, Niigata City, Japan), whereby patients squeezed the dynamometer as hard as they could for 5. For those patients who had a fistula, the measurement was performed with the hand opposite to the fistula; for those patients with a catheter, the measurement was performed using the dominant hand. The measurement was taken three times and the average of the three measurements was recorded as the handgrip strength (HGS).
Anthropometric measurements were taken with a Lange skinfold caliper by a trained dietitian (G.M.A.) to estimate the fat mass, midarm circumference (MAC), midarm muscle circumference (MAMC) and bone-free arm muscle area (AMA) [26–29].
Dietary protein intake (DPI) and dietary energy intake (DEI) values were determined from one 24-h diet recall (from a non-HD day) and were analyzed using the NutriKcal VO nutrient analysis software (version 2).
Laboratory parameters
Blood samples were taken before the HD session to determine the creatinine, albumin, phosphorus, potassium and total lymphocyte count (TLC) measurements.
Diagnosis of PEW
PEW was diagnosed if the patient presented with three positive criteria: BMI <23 kg/m2, serum albumin <3.8 g/dL and reduced AMA (a reduction >10% relative to the 50th percentile of the reference population), as recommended by Fouque et al. [30].
Quality of life assessment
QOL was assessed at baseline and at 12 weeks using the Kidney Disease Quality of Life Short Form (KDQOL-SF). Each question was precoded numerically and was then transformed to values from 0 to 100. Higher scores were associated with a better perception of QOL. Scores that were equal to or below the mean were considered to be indicators of lower QOL according to the standards of the KDQOL-SF [31–33].
Statistical analysis
According to the data distribution, Student's t-test was used to perform pre- and postintervention comparisons for parametric distributions, and the Mann–Whitney U or Wilcoxon tests were used for nonparametric distributions. The percentage change was calculated for quantitative variables and the necessary tests were conducted. Categorical variables were reported as proportions with their respective 95% confidence intervals. Pearson's chi-squared or Fisher's exact tests were used to analyze changes. A P-value <0.05 was considered statistically significant, and SPSS version 21.0 was used to analyze the data.
RESULTS
Forty-four patients started the study and 36 completed the program. The atrition was due to three patients who changed HD units in the ONS group and one death, two transplantations and two patients who changed HD units in the ONS + RE group (Figure 2).
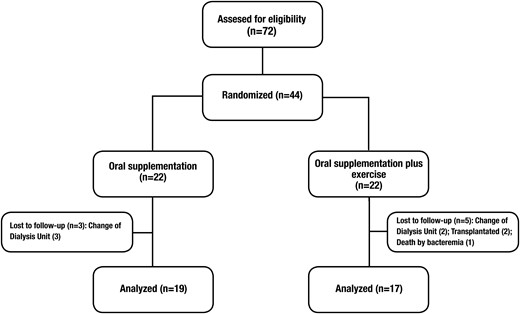
Flow chart of patients through the study. Forty-four patients were randomized in two different groups, 22 in the oral nutritional supplementation (ONS) group and 22 in the oral supplementation group plus resistance exercise (ONS + RE). Only 36 patients concluded the study, 19 in the ONS group and 17 in the ONS + RE group.
Throughout the study period, the patients tolerated both interventions. Adherence to the ONS was 95% in both groups, and the ONS + RE group had 77.5% adherence to the RE. The lack of exercise at the beginning of the HD sessions was mostly due to complications from vascular access, tiredness, dizziness or nausea. We did not receive reports of diarrhea, nausea, vomiting or hypotension due to the ONS during the study.
Baseline characteristics
Table 1 shows the baseline characteristics of the study population. There were no statistically significant differences between the groups at the beginning of the study. Thirty-one patients (86%) had a BMI <23 kg/m2, 30 patients (83%) had a serum albumin <3.8 g/dL and 23 patients (64%) presented with a >10% decrease in the AMA relative to the 50th percentile of the reference population. For all patient populations, the prevalence of PEW according to the International Society of Renal Nutrition and Metabolism (ISRNM) criteria was 55.5%.
Demographic, body composition and laboratory characteristics of the study population
| Total (n = 36) | ONS (n = 19) | ONS + RE (n = 17) | P-value | |
|---|---|---|---|---|
| Age (years) | 34 (24.5–43) | 30 (24–47) | 35 (24–41.5) | 0.940 |
| Gender, female | 21 (58.3) | 11 (57.9) | 10 (58.8) | 0.924 |
| Etiology | 0.090 | |||
| Unknown | 19 (52.8) | 8 (42.1) | 11 (64.7) | |
| Diabetes mellitus | 1 (2.8) | 0 (0) | 1 (5.9) | |
| Glomerulopathy | 2 (5.6) | 2 (10.5) | 0 (0) | |
| Hypertension | 6 (16.7) | 3 (15.8) | 3 (17.6) | |
| Other | 8 (22.2) | 6 (31.6) | 2 (11.8) | |
| Frequency of dialysis | 0.303 | |||
| 2 times per week | 30 (83.3) | 17 (89.5) | 13 (76.5) | |
| 3 times per week | 6 (16.7) | 2 (10.5) | 4 (23.5) | |
| Comorbidities | 0.487 | |||
| Diabetes | 3 (8.3) | 1 (5.3) | 2 (11.8) | |
| Hypertension | 25 (69.4) | 12 (63.2) | 13 (76.5) | |
| Body composition | ||||
| BMI (kg/m2) | 20.6 (19–22) | 21 (18.3–22.1) | 20.4 (19.4–23) | 0.601 |
| MAC (cm) | 23.6 (22–26) | 24 (21.3–26) | 23.5 (22–27.3) | 0.861 |
| AMC (mm) | 209 (193–240.5) | 205 (192–238.6) | 211.2 (191.3–245) | 0.924 |
| AMA (cm2) | 30.2 ± 12.09 | 28.5 ± 11.49 | 32 ± 12.8 | 0.366 |
| Triceps skinfold thickness (mm) | 8.4 ± 4.4 | 7.7 ± 3.4 | 9.1 ± 5.3 | 0.578 |
| FM% from anthropometry | 18.4 ± 7.6 | 17 ± 6.5 | 20 ± 8.6 | 0.257 |
| Handgrip strength (kg) | 18.2 (14–23.7) | 16 (10–24) | 20 (16–24.5) | 0.273 |
| R (Ω) | 584 (491–660) | 585.2 (505.3–664) | 572.6 (488–641) | 0.579 |
| Xc (Ω) | 61 (45.4–73.4) | 63 (46.7–77) | 57.8 (44.7–72.6) | 0.590 |
| Phase angle (°) | 5.8 ± 1.2 | 5.9 ± 1.4 | 5.8 ± 0.9 | 0.851 |
| Laboratory tests | ||||
| Hemoglobin (g/dL) | 8 (6.6–9.2) | 8.1 (7–10) | 7.4 (6.6–9.1) | 0.949 |
| Total lymphocytes count (cells/mm3) | 916.8 ± 378.4 | 997 ± 378 | 826 ± 368.5 | 0.181 |
| Creatinine (mg/dL) | 14.9 ± 4.9 | 15.7 ± 5 | 13.9 ± 4.9 | 0.284 |
| Albumin (g/dL) | 3.4 ± 0.28 | 3.5 ± 0.29 | 3.3 ± 0.25 | 0.118 |
| Phosphorus (mg/dL) | 6.3 ± 2.7 | 6.4 ± 2.8 | 6.2 ± 2.7 | 0.846 |
| Potassium (mmol/dL) | 5.9 (5–6.1) | 6 (5.4–6.3) | 5.5 (4.4–6) | 0.123 |
| Protein-energy wasting | 20 (55) | 11 (57.8) | 9 (52.9) | 0.396 |
| Vascular access | 0.546 | |||
| Catheter | 11 | 7 | 4 | |
| AV fistula | 25 | 12 | 13 |
Data are absolute number (percentage), mean ± SD or median (first and third quartiles).
ONS, oral nutritional supplementation; ONS + RE, oral nutritional supplementation plus resistance exercise; BMI, body mass index; MAC, midarm circumference; AMC, arm muscle circumference; AMA, arm muscle area; FM%, fat mass as a percentage of body weight; R, resistance at 50 kHz; Xc, reactance at 50 kHz.
Effect of the intervention on body composition indicators, biochemical parameters and QOL scale
Table 2 shows the body composition measurements taken during the study. All anthropometric parameters increased significantly in both groups during the study period. The HGS increased significantly from baseline in both groups throughout the follow-up period.
Changes in body composition measured by anthropometrics, muscle strength (dynamometry) and bioelectric impedance analysis
| ONS | ONS + RE | |||||||||
|---|---|---|---|---|---|---|---|---|---|---|
| Baseline (n = 19) | 6 weeks (n = 19) | Δc | 12 weeks (n = 19) | Δd | Baseline (n = 17) | 6 weeks (n = 17) | Δc | 12 weeks (n = 17) | Δd | |
| Weight (kg) | 46.5 (43–52) | 48 (45–53)a | 1 (0.0–2) | 48.5 (45–54)a | 1 (0.0–2) | 51 (46–56.7) | 51 (46.5–58)b | 0.5 (0.0–1) | 51.5 (46.5–58)b | 0.7 (0.25–1.5) |
| BMI (kg/m2) | 21 (18.3–22.1) | 21.3 (20–22)a | 0.4 (0.0–0.9) | 21.3 (20.1–22.2)a | 0.4 (0.0–0.9) | 20.4 (19.4–23) | 20.7 (19.6–23)b | 0.2 (0.0–0.5) | 20.7 (19.6–23.6)b | 0.30 (0.10–.60) |
| MAC (cm) | 24 (21.3–26) | 24.5 (23–26.5)a | 0.2 (0.0–1.2) | 24.5 (23–27)a | 0.5 (0.2–1.5) | 23.5 (22–27.3) | 24.5 (22.8–27)b | 0.5 (0.1–1) | 24.7 (23–27.5)b | 0.7 (0.1–1.1) |
| AMC (mm) | 205 (192–238.6) | 219 (201.4–238.6)a | 2.7 (0.0–9.1) | 220 (202.4–244.3)a | 5 (0.0–10) | 211.2 (191.3–245) | 216.7 (197–239)b | 5 (0.4–7.8) | 217.4 (200.6–241.7)b | 7 (0.4–10) |
| AMA (cm2) | 28.5 ± 11.49 | 29.2 ± 7.6a | 0.71 ± 6.1 | 29.7 ± 7.5a | 1.2 ± 5.9 | 32 ± 12.8 | 29 ± 9.9b | −2.9 ± 7.8 | 29.8 ± 9.7b | −2.3 ± 7.7 |
| Triceps skinfold thickness (mm) | 7.7 ± 3.4 | 8.1 ± 3.5a | 0.42 ± ± 1.01 | 8.1 ± 3.6a | 0.42 ± 1.07 | 9.1 ± 5.3 | 9.5 ± 5.3b | 0.41 ± 0.79 | 9.5 ± 5.4b | 0.35 ± 0.93 |
| FM% from anthropometry | 17 ± 6.5 | 17.6 ± 6.3a | 0.63 ± 1.3 | 17.6 ± 6.5a | 0.65 ± 1.4 | 20 ± 8.6 | 21.2 ± 8.9b | 0.22 ± 0.99 | 20.3 ± 9b | 0.34 ± 1 |
| Handgrip strength (kg) | 16 (10–24) | 18.2 (11.5–26)a | 1 (1–3) | 20.6 (15–27)a | 2.8 (1–5) | 20 (16–24.5) | 20.2 (17.5–30)b | 1.6 (0.2–3.2) | 22 (17.5–31)b | 2.6 (0.35–4.6) |
| R (ohm) | 585.2 (505.3–664) | 598 (559–666)a | −12 (−32–24) | 567 (529–634)a | −16 (−73–16) | 572.6 (488–641) | 553 (515–655)b | 40 (−27–56) | 538 (486–657)b | 0.7 (−35.3–47.2) |
| Xc (ohm) | 63 (46.7–77) | 64 (51–78)a | −1.6 (−6–9.1) | 64 (47–65)a | −0.6 (−5.7–12) | 57.8 (44.7–72.6) | 58 (48–74)b | 2.1 (−2.6–7.2) | 57.7 (49.6–78.6)b | 2.7 (−1.3–10) |
| Phase angle (°) | 5.9 ± 1.4 | 6 ± 1.5a | 0.16 ± 0.31 | 6.2 ± 1.4a | 0.31 ± 0.59 | 5.8 ± 0.9 | 5.9 ± 0.9b | 0.04 ± 0.51 | 6.1 ± 0.75b | 0.33 ± 0.47 |
Anthropometric indicators are mean ± SD or median (first and third quartiles).
ONS, oral nutritional supplementation; ONS + RE, oral nutritional supplementation plus resistance exercise; BMI, body mass index; MAC, midarm circumference; AMC, arm muscle circumference; AMA, arm muscle area; FM%, fat mass as percentage of body weight; R, resistance at 50 kHz; Xc, reactance at 50 kHz. No statistical difference was found in deltas between groups.
aP < 0.05, compared with the NS group at baseline.
bP < 0.05, compared with the NS + RE group at baseline.
cΔ = difference between baseline and 6 weeks
dΔ = difference between baseline and 12 weeks.
The results of the Z-score of the BIVA (Figure 3) revealed no significant difference in the overall body composition and hydration in all patients before or after either intervention; however, there was a migration of the vectors towards a dry weight and a potential improvement in lean body mass at the end of the intervention.
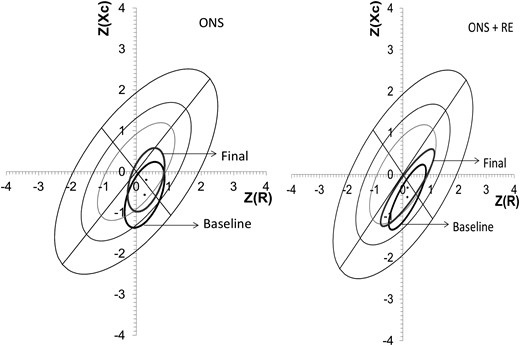
Mean vector position with 95% confidence ellipse, pre- and postintervention. There was no statistical difference in either groups, it can be seen that vector migration is similar in both groups, trending towards better body composition due to an increase in soft lean tissue mass.
Table 3 presents the changes observed in the biochemical indicators throughout the study. There were increases in the serum albumin concentrations in both groups: ONS, 3.5 ± 0.29 mg/dL at baseline versus 3.7 ± 0.46 mg/dL at 6 weeks and 3.7 ± 0.35 mg/dL at 12 weeks (P < 0.001); ONS + RE, 3.3 ± 0.25 mg/dL at baseline 3.7 ± 0.38 mg/dL at 6 weeks and 3.7 ± 0.33 mg/dL at 12 weeks (P < 0.001). No significant difference was found in the anthropometric and biochemical deltas between groups. Finally, we found that the ONS + RE group showed statistically significant improvements in two items of the KDQOL-SF scale—general health perceptions and social function—but there were no differences in the other items (Table 4).
Changes in biochemical parameters during the study
| ONS | ONS + RE | |||||||||
|---|---|---|---|---|---|---|---|---|---|---|
| Baseline (n = 19) | 6 weeks (n = 19) | Δc | 12 weeks (n = 19) | Δd | Baseline (n = 17) | 6 weeks (n = 17) | Δc | 12 weeks (n = 17) | Δd | |
| Hemoglobin (g/dL) | 8.1 (7–10) | 9.2 (8–10)a | 1.1 (−0.4–2.8) | 8.4 (7.4–10) | 0.2 (−0.7–1.2) | 7.4 (6.6–9.1) | 9 (7.6–10)b | 1.1 (0.3–1.7) | 9 (7.7–10) | 1.3 (−0.05–2.3) |
| Total lymphocytescount (cells/mm3) | 977.6 (767–1165) | 878.4 (764–1068) | −81.4 (−317.1–220.3) | 996.3 (886.2–1161) | 35.3 (−140.5–228.6) | 702 (586.5–1022.85) | 877.2 (654.5–1014) | 50.1 (−169.8–203.2) | 720 (637.2–798.5) | −25.5 (319.3–68.55) |
| Creatinine (mg/dL) | 15.7 ± 5 | 12.7 ± 5.4a | −3 ± 5.8 | 13.7 ± 4.8 | −2 ± 5.3 | 13.9 ± 4.9 | 12.1 ± 6 | −1.8 ± 5.7 | 12.4 ± 4.2 | −1.5 ± 3.5 |
| Albumin (g/dL) | 3.5 ± 0.29 | 3.7 ± 0.46a | 0.21 ± 0.34 | 3.7 ± 0.35a | 0.16 ± 0.25 | 3.3 ± 0.25 | 3.7 ± 0.38b | 0.29 ± 0.32 | 3.7 ± 0 .33b | 0.28 ± 0.22 |
| Phosphorus (mg/dL) | 6.4 ± 2.8 | 5.7 ± 2.5 | −0.68 ± 2.4 | 5.7 ± 1.9 | −0.67 ± 2.6 | 6.2 ± 2.7 | 5.5 ± 2.3 | −0.65 ± 3.1 | 6.4 ± 2 | 0.20 ± 2.6 |
| Potassium (mmol/dL) | 6 (5.4–6.3) | 5.1 (4.5–5.8) | −0.6 (−1–0.5) | 5.9 (5.2–6.7) | 0.0 (−0.8–0.7) | 5.5 (4.9–6) | 5 (4.4–6) | −0.1 (−0.65–0.30) | 5.1 (4.8–5.4) | −0.2 (−1–0.15) |
Biochemical indicators are mean ± SD or median (first and third quartiles). No statistical difference was found in deltas between groups.
ONS, oral nutritional supplementation; ONS + RE; oral nutritional supplementation plus resistance exercise.
aP < 0.05, compared with the ONS group at baseline.
bP < 0.05, compared with the ONS + RE group at baseline.
cΔ = difference between baseline and 6 weeks.
dΔ = difference between baseline and 12 weeks.
Assessment of quality of life before and after the intervention by KDQOL-SF questionnaire
| ONS | ONS + RE | |||||
|---|---|---|---|---|---|---|
| Pre | Post | P-value | Pre | Post | P-value | |
| Specific part | ||||||
| Symptoms | 75.6 ± 13.5 | 70.1 ± 16.6 | 0.06 | 72.8 ± 12.8 | 76.6 ± 14.8 | 0.22 |
| Effects of kidney disease | 64 ± 18.6 | 70.2 ± 21.1 | 0.09 | 57 ± 26.8 | 70 ± 25 | 0.05 |
| Burden of kidney disease | 41.3 ± 26 | 44.3 ± 26.4 | 0.51 | 28.6 ± 23.9 | 44.5 ± 30.8 | 0.04 |
| Work status | 30 ± 41 | 27.5 ± 41.2 | 0.77 | 28.2 ± 36.3 | 25.3 ± 36.7 | 0.81 |
| Cognitive function | 38 ± 20.9 | 33 ± 20.5 | 0.33 | 31.7 ± 31.8 | 25.4 ± 30 | 0.34 |
| Quality of social interaction | 33.7 ± 20 | 33 ± 22 | 0.91 | 35 ± 27.4 | 30.8 ± 27.3 | 0.47 |
| Sexual function | 83.8 ± 33 | 88.3 ± 23.3 | 0.41 | 92.18 ± 17 | 96 ± 12.7 | 0.49 |
| Sleep | 60.1 ± 21.7 | 63.9 ± 25 | 0.57 | 66 ± 17.6 | 67 ± 19.5 | 0.86 |
| Social support | 59.1 ± 30.8 | 70 ± 21.3 | 0.13 | 76 ± 29.1 | 68.7 ± 26.4 | 0.51 |
| Dialysis staff encouragement | 83.7 ± 12.9 | 80 ± 17.4 | 0.39 | 84.4 ± 23 | 79.7 ± 12 | 0.47 |
| Patient satisfaction | 65 ± 20.9 | 66.7 ± 21.7 | 0.74 | 72.9 ± 19.1 | 63.5 ± 21.3 | 0.12 |
| Generic part | ||||||
| Physical function | 66 ± 27 | 59.7 ± 26.4 | 0.25 | 63.1 ± 22.4 | 71.3 ± 22.3 | 0.18 |
| Physical role | 36.3 ± 40 | 68.8 ± 41.2 | 0.02 | 51.6 ± 43.3 | 65.6 ± 40.7 | 0.33 |
| Pain | 67.6 ± 28.5 | 65.4 ± 34.7 | 0.8 | 69 ± 31 | 77.3 ± 21.2 | 0.16 |
| General health perceptions | 46.8 ± 16 | 51 ± 14.1 | 0.24 | 52.2 ± 19.7 | 44 ± 17.9 | 0.01 |
| Emotional well-being | 63 ± 15.4 | 65.6 ± 17.3 | 0.49 | 68.5 ± 22.6 | 76.8 ± 19.4 | 0.25 |
| Emotional role | 65.05 ± 43.8 | 73.4 ± 33.3 | 0.43 | 68.8 ± 39.3 | 85.4 ± 29.7 | 0.25 |
| Social function | 66.3 ± 23.7 | 76.4 ± 25.5 | 0.2 | 54 ± 24.1 | 79.8 ± 29 | 0.01 |
| Energy/fatigue | 58.7 ± 24 | 68.1 ± 20 | 0.06 | 51.9 ± 21 | 57.2 ± 26 | 0.27 |
Data are mean ± SD.
ONS, oral nutritional supplementation; ONS + RE, oral nutritional supplementation plus resistance exercise.
Effect of the intervention on food intake
The DEI was different in both groups in the comparisons of baseline versus 12 weeks (ONS: 27 ± 10.5 kcal/kg/day versus 35 ± 16.4 kcal/kg/day, P < 0.05; ONS + RE: 27 ± 10.6 kcal/kg/day versus 36 ± 15.0 kcal/kg/day, P < 0.05). Similar results were found in the DPI (ONS: 1.0 ± 0.6 g/kg/day versus 1.6 ± 0.5 g/kg/day, P < 0.05; ONS + RE: 1.0 ± 0.4 g/kg/day versus 1.6 ± 0.5 g/kg/day, P < 0.05). No differences were observed in the DPI and DEI of the study groups at baseline compared with at 12 weeks.
Effect of the intervention on PEW
The overall PEW prevalence at baseline was 55% (20 patients) [11 patients (58%) in the ONS group and 9 patients (53%) in the ONS + RE group; P = ns]. At the end of the study, all groups had a decrease in the prevalence of PEW: from 58 to 11% (two patients) in the ONS group and from 53 to 18% (three patients) in the ONS + RE group; P = ns. The decrease in the prevalence percentage at the end of the study in the control and intervention groups was not significant.
DISCUSSION
PEW syndrome is highly prevalent in patients on chronic HD (18–75%) [30, 34]. In our study, we found a 55% prevalence of PEW according to the ISRNM criteria. Patients with CKD and PEW have been shown to have an increased risk of cardiovascular morbidity and mortality [35]. Different treatment strategies have been designed, with varying results, to reduce the incidence of PEW [12, 36–39]. Some researchers have determined the effect that RE [40] or ONS would have on HD patients [19, 41, 42]; however, there are insufficient data on how resistance exercise would enhance the protein anabolic effects of intradialytic ONS on NS and QOL.
A few studies have shown the combined effect of ONS and RE on patients on HD. Majchrzak et al. [19] studied the effect of these two interventions during HD sessions using kinetic studies of proteins and found that, compared with only ONS, exercise with ONS helped to maintain a positive protein balance during the post-HD phase. However, this was a transverse study without follow-up over time, so it cannot be compared with our study. Donj et al. [20] found statistically significant increases in different indicators of NS, such as body weight and the one-repetition maximum, during the study for all the patients combined; thus the addition of RE to nutritional ONS caused no significant difference between groups (ONS + RE versus ONS) [20]. However, these studies were limited in that they mainly included well-nourished African American patients. Donj et al.'s results are consistent with those of our study despite the different nutritional status of his population.
Tolerance to the ingestion of ONS in this study was observed to be without symptoms such as diarrhea, nausea, vomiting or hypotension; in addition, tolerance to RE was adequate from the point of view of fatigue and cardiovascular safety. This tolerance is important because patients on renal replacement therapy have been reported to perform little or no physical activity and to lead sedentary lives, thus reducing their functional capacity [43–45]. Our population reported that they performed no or very little physical activity before the intervention, as reported previously by Johansen et al. [46].
Regarding ONS alone, scientific evidence has shown that ONS helps maintain a positive balance of amino acids during HD sessions compared with without supplementation, as observed in a study by Pupim et al. [47]. ONS also improves the albumin level, as we demonstrated in our study, and possibly the survival of patients, as reported in observational studies by Weiner et al. and Lacson et al., which indicated that ONS treatment was associated with a 29 and 34% reduction in the risk of mortality, respectively [48, 49].
Recently, Kalantar et al. [50] gave a personal statement about the different advantages and disadvantages of food intake and the administration of ONS during HD. They concluded that nutritional interventions are the most promising strategy for increasing serum albumin concentrations and for improving the longevity and QOL of patients. Other studies have found the same positive effect of ONS during HD [51–53].
Our results showed that both interventions had a positive effect on NS. Statistically significant changes were observed in anthropometric measurements, such as increases in body weight, BMI, MAC, AMC, triceps skinfold thickness, percent of body fat mass, HGS, phase angle and serum albumin concentration. The ONS + RE group showed significant improvements in their general health perception and social function, according to the KDQOL-SF scale.
Despite the positive and significant changes that were observed in both groups, it is possible to think that ONS alone helps improve different indicators in the NS of patients without requiring them to exercise, given the physical and mental effort exercise entails.
We believe that the addition of RE in our study does not seem to augment the acute anabolic effects of intradialytic ONS on NS since patients performed two sessions of exercise per week over 3 months (24 exercise sessions) and, in contrast, the effective recommendation for exercise interventions required to see positive changes in clinical and nutritional outcomes is >30 min three times per week (more than 24 exercise sessions), as reported recently in a Cochrane meta-analysis of 32 studies [54].
On the other hand, we speculate that the addition of one can of ONS to RE is unable to increase this anabolic effect, as some studies have described that in addition of the HD procedure, which induces a catabolic state [4, 5], both muscle protein synthesis and muscle protein breakdown are increased after RE [55, 56].
Studies have reported that 76% of patients fell asleep during their HD sessions, causing fragmentation of nocturnal sleep. In addition, the mortality risk of patients who sleep >9 h/day has been shown to increase by 50% compared with those who sleep between 6 and 7 h/day [57–59]. Thus, an additional benefit of exercise during the HD sessions is to keep the patients awake and active.
Some limitations of our study are that there were no continuous measurements of Kt/V and normalized protein catabolic rates of the subjects. Although we did not have this information, it was possible to observe positive changes in the NS of the patients.
Another limitation of the study is that we could not measure the C-reactive protein however, we found an increase in the serum albumin, which could be explained by an increase in the consumption of energy and protein after the intervention.
Finally, it is well documented that patients with CKD who are treated with dialysis have severely limited exercise capacity, contributing to limitations in their ability to perform the activities of daily living. Low levels of physical functioning in HD patients have been reported using objective laboratory measures, physical performance testing and self-reported measures [60]. However, exercise has the potential to improve performance on physical function tests, and we do not capture any measurements that show a possible difference between groups [39].
We conclude that both interventions (ONS or ONS + RE) represent intriguing strategies to prevent and/or treat uremic wasting syndrome or malnutrition in HD patients. Although these results need to be confirmed with long-term studies, ONS alone or combined with RE appeared to be a safe intervention, improving NS with no reports of adverse side effects.
CONFLICT OF INTEREST STATEMENT
None declared.
ACKNOWLEDGEMENTS
We are grateful for Dra. Veronica Garza-Sanchez from the Dirección de Especialidades Médicas for providing the facilities to carry out this work. We also wish to thank the nursing staff in the Dialysis Unit of the Hospital General de Mexico.


Comments