


Abstract
Although previous studies suggest similar patient survival for peritoneal dialysis (PD) and haemodialysis (HD), PD use has decreased worldwide. We aimed to study trends in the choice of first dialysis modality and relate these to variation in patient and technique survival and kidney transplant rates in Europe over the last 20 years.
We used data from 196 076 patients within the European Renal Association-European Dialysis and Transplant Association (ERA-EDTA) Registry who started renal replacement therapy (RRT) between 1993 and 2012. Trends in the incidence rate and prevalence on Day 91 after commencing RRT were quantified with Joinpoint regression. Crude and adjusted hazard ratios (HRs) for 5-year dialysis patient and technique survival were calculated using Cox regression. Analyses were repeated using propensity score matching to control for confounding by indication.
PD prevalence dropped since 2007 and HD prevalence stabilized since 2009. Incidence rates of PD and HD decreased from 2000 and 2009, respectively, while the incidence of kidney transplantation increased from 1993 onwards. Similar 5-year patient survival for PD versus HD patients was found in 1993–97 [adjusted HR: 1.02, 95% confidence interval (95% CI): 0.98–1.06], while survival was higher for PD patients in 2003–07 (HR: 0.91, 95% CI: 0.88–0.95). Both PD (HR: 0.95, 95% CI: 0.91–1.00) and HD technique survival (HR: 0.93, 95% CI: 0.87–0.99) improved in 2003–07 compared with 1993–97.
Although initiating RRT on PD was associated with favourable patient survival when compared with starting on HD treatment, PD was often not selected as initial dialysis modality. Over time, we observed a significant decline in PD use and a stabilization in HD use. These observations were explained by the lower incidence rate of PD and HD and the increase in pre-emptive transplantation.
INTRODUCTION
Whether a patient with end-stage renal disease (ESRD) is treated with haemodialysis (HD) or with peritoneal dialysis (PD) depends on several factors, including patient education, anticipated waiting time for transplantation, desire to remain autonomous, travelling distance to a dialysis centre and the expected patient survival. The association between dialysis modality and survival has been studied frequently. Overall, most of these studies showed an initial survival benefit on PD in the first 2 years after commencing treatment, but a less favourable long-term survival for PD compared with HD [1, 2]. Although survival benefits for HD over PD have not been demonstrated in most patient groups and considering that PD is more cost-effective in developed countries, one would expect to see increasing rates of PD use. However, recent studies have reported a decrease in the percentage of PD utilization [3–9]. Jain et al. [3] showed that in developed countries, the proportion of patients on PD decreased from 20.6 to 15.3% between 1997 and 2008.
Mehrotra et al. [5] explored the decline in the use of PD as first dialysis modality in the USA showing that the decrease in PD incidence could not be attributed to changes in dialysis population characteristics like an increased age and body mass index or to a larger share of patients with hypertension and ischaemic heart disease. Moreover, they showed an improved survival for patients treated with PD, whereas survival outcomes for patients treated with HD did not substantially change.
As large European studies are currently lacking, we aimed to assess trends in the choice of the first dialysis modality and related patient survival in 14 renal registries from 11 European countries. Furthermore, to subsequently explain the trends in incidence, prevalence and patient survival, we put them in the context of technique survival and transplant rates.
MATERIALS AND METHODS
We used individual patient data from 14 registries that participated in the European Renal Association-European Dialysis and Transplant Association (ERA-EDTA) Registry since 1993. These include the national registries of Austria, Denmark, Finland, Greece, Iceland, the Netherlands, Norway and Sweden and the regional registries of Belgium (French-speaking part), Andalusia (Spain), Basque country (Spain), Catalonia (Spain), Valencian region (Spain) and Scotland (UK). The data include date of birth, sex, primary renal disease (PRD), start date and type of treatment, treatment modality changes and date and cause of death. Analyses were restricted to all patients starting renal replacement therapy (RRT) in the 20-year study period (1993–2012) who survived the first 3 months on RRT. Only the registry of the French-speaking part of Belgium did not provide data on patients younger than 20 years of age.
The treatment at Day 91 after commencing RRT was considered as the initial modality and we compared all HD with all PD patients, without further classifying into more detailed dialysis categories. The number of transplantations on Day 91 was used to get an impression of the number of pre-emptive transplantations. Means with SD and percentages were calculated by incidence year to describe the study population. Trends over the study period were studied using the Cochran–Armitage test for trends.
The incidence on Day 91 was defined as the number of new patients who had survived the first 3 months on RRT in a given year. The prevalence was defined as the number of patients receiving RRT on 31 December of a given year. The incidence rates and prevalence were adjusted using the age and sex distribution of the European standard population in 2005 (Eurostat) to represent the expected incidence and prevalence if the study population had the age and sex distribution as this reference population and to allow comparison over time. Time trends in the incidence and prevalence were analysed using Joinpoint regression analysis. This method is based on the Poisson distribution and identifies where a change—a so-called ‘joinpoint’—in the trend occurs. Changes in the slopes of these trends were calculated as annual percentage change (APC) with a 95% confidence interval (CI) for each segment (http://surveillance.cancer.gov/joinpoint/).
The median survival time for patients who started treatment with HD and PD was calculated using the Kaplan–Meier method. We examined trends in 5-year patient survival on dialysis from Day 91, meaning that deaths in the first 3 months after RRT initiation were not taken into account. Patients starting on PD as the first RRT modality were compared with those starting on HD in three patient cohorts as classified by incidence year (1993–97, 1998–2002 and 2003–07). Hazard ratios (HRs) with 95% CIs were calculated using Cox proportional-hazards regression. Where the proportional-hazards assumption did not hold, i.e. where survival curves crossed (Figure 1), we used an extended Cox model to specify time-dependent covariates and calculate HRs for each time period separately. Additionally, we calculated HRs by age group and diabetic status to examine the 5-year patient survival for PD compared with HD for patients in three cohorts. Survival analyses were based on an intention-to-treat approach whereby patients were classified based on their initial dialysis modality and transfers to other dialysis modalities were not taken into account. Follow-up time was 5 years and censoring occurred at recovery of renal function, kidney transplantation or loss to follow-up, whichever came first. Multivariable Cox models included the variables age, sex, PRD and country.
In a sensitivity analysis, we reduced the potential effects of treatment selection bias and thus accounted for the differences in patient selection over time, by applying propensity score matching to balance measured confounders between HD and PD patients. Propensity scores representing the likelihood of receiving PD were estimated using a logistic regression model including age, sex, PRD and country. We matched patients treated with HD and PD with similar propensity scores at a 1:1 ratio using the 1:N Case–Control Matching Macro and repeated the Cox regression analysis on the matched cohort [10].
Finally, time trends in technique survival were studied. The event of interest was the transfer to another dialysis modality and competing events were the occurrence of kidney transplantation or death within the first 5 years after Day 91 on the initial dialysis modality. To account for these competing events, we used the Cumulative Incidence Competing Risks method [11, 12]. Multivariable Cox regression models to calculate adjusted cause-specific HRs for technique survival included age, sex, PRD and country.
For all analyses, the most recent time period available was studied separately by comparing the 2-year patient and technique survival in the incident cohort in 2006–07 and 2008–09.
All analyses were performed using SAS 9.3, except for the Joinpoint regression that used Joinpoint regression software v4.0.4 (http://surveillance.cancer.gov/joinpoint/). P-values of <0.05 were considered statistically significant.
RESULTS
Study population
In the 20-year period between 1993 and 2012, the absolute numbers of patients receiving PD and HD increased (Table 1). Between 1993 and 1997, 22% of the patients received PD as first dialysis modality, whereas this percentage had decreased to 18% between 2008 and 2012. The mean age (SD) of patients treated with PD increased from 54.6 (17.1) years in 1993–97 to 59.9 (17.3) years in 2008–12 and that of patients on HD from 60.5 (15.6) to 66.4 (14.9) years. The proportion of patients above 65 years increased in both groups. In the PD population, the proportion of patients with hypertension/renal vascular disease as PRD increased, whereas the proportion of patients with glomerulonephritis decreased. Similar trends existed for patients treated with HD, but in this group also, the proportion of patients with diabetes mellitus as PRD increased. Overall, patients starting with PD treatment were significantly younger and more often had glomerulonephritis than patients starting with HD.
Baseline characteristics of patients who started dialysis in cohorts between 1993 and 2012
| 1993–97 | 1998–2002 | 2003–07 | 2008–12 | P for trend over time | ||||||
|---|---|---|---|---|---|---|---|---|---|---|
| PD (22%) | HD (78%) | PD (20%) | HD (80%) | PD (18%) | HD (82%) | PD (18%) | HD (82%) | PD | HD | |
| Incident patients, n (pmp) | 8466 (19.7) | 29 368 (68.2) | 9805 (22.3) | 38 164 (86.7) | 9998 (21.9) | 44 726 (98.1) | 9791 (20.7) | 45 758 (96.6) | ||
| Age, years, mean ± SD | 54.6 ± 17.1 | 60.5 ± 15.6 | 56.2 ± 17.4 | 63.4 ± 15.1 | 57.8 ± 17.5 | 65.4 ± 14.9 | 59.9 ± 17.3 | 66.4 ± 14.9 | ||
| Age, years, median | 57.4 | 64.0 | 58.7 | 66.8 | 60.4 | 68.9 | 62.8 | 69.4 | ||
| Age 65+ years, % | 31.9 | 47.2 | 36.4 | 54.9 | 39.0 | 59.6 | 44.6 | 61.4 | <0.001 | <0.001 |
| Sex, % males | 60.7 | 60.2 | 62.6 | 61.0 | 62.0 | 62.8 | 65.2 | 63.8 | <0.001 | <0.001 |
| PRD % | ||||||||||
| DM | 23.7 | 18.1 | 24.0 | 21.8 | 24.1 | 24.5 | 22.0 | 24.8 | 0.009 | <0.001 |
| HT/RVD | 12.6 | 14.3 | 14.4 | 16.5 | 16.0 | 18.8 | 18.5 | 19.3 | <0.001 | <0.001 |
| GN | 19.7 | 16.3 | 17.6 | 13.3 | 17.3 | 11.2 | 16.3 | 9.7 | <0.001 | <0.001 |
| Other | 43.4 | 50.7 | 43.0 | 48.0 | 42.1 | 45.2 | 41.8 | 45.2 | 0.01 | <0.001 |
P-values for trend comparisons over the four cohorts. SD, standard deviation; PRD, primary renal disease; DM, diabetes mellitus; HT/RVD, hypertension/renal vascular disease; GN, glomerulonephritis; HD, haemodialysis; PD, peritoneal dialysis.
Trends in incidence and prevalence of PD and HD
Joinpoint regression showed that the incidence of PD increased until 2000 and then decreased until 2012 (Figure 2A). For patients receiving HD treatment, the trend in incidence showed an increase up to 2004, a stabilization until 2009 and a significant decline thereafter.
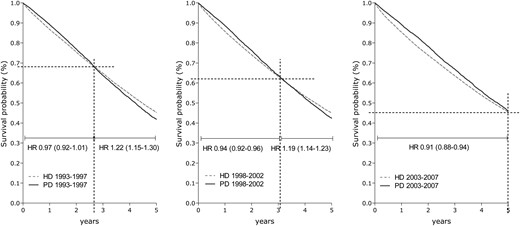
Five-year patient survival for patients starting dialysis on HD and PD in 1993–97, 1998–2002 and 2003–07, adjusted for age, sex, PRD and country.
Trends in prevalence are shown in Figure 2B. The PD prevalence first increased, then stabilized between 2000 and 2007 and declined over the last few years of the study period, while HD prevalence continued to increase at progressively slower rates until 2009 and remained stable thereafter.
Patient survival
The crude median survival for patients who received treatment with PD at Day 91 increased from 3.7 years between 1993 and 1997 to 4.4 years for patients who started PD between 2003 and 2007. For patients treated with HD at Day 91, the median survival for the same two periods was 3.7 and 3.6 years, respectively. After adjustment for age, sex, PRD and country, patient survival was better for patients starting dialysis in the third cohort (2003–07) when compared with those starting dialysis in the first cohort (1993–97), both for patients treated with PD (adjusted HR: 0.64, 95% CI: 0.61–0.67) and HD (adjusted HR: 0.82, 95% CI: 0.80–0.84). Adjusted Cox survival curves and stratified HRs for patients starting on PD versus HD are presented in Figure 1, showing an initial survival benefit for PD in the first years after starting dialysis. No difference in overall adjusted patient survival on PD relative to HD was found in the first and second cohorts (Table 2). However, in the third cohort, a 9% survival benefit was present for patients starting on PD versus HD (adjusted HR: 0.91; 95% CI: 0.88–0.95). Subgroup analysis showed survival benefits of PD for patients younger than 65 years and for non-diabetic patients. For patients aged 65 years and older and for patients with diabetes mellitus as PRD, patient survival on HD was better than on PD between 1998 and 2002, whereas no survival differences were observed for patients starting between 2003 and 2007 (Table 2).
HRs for 5-year survival in dialysis patients comparing the survival for PD relative to HD (reference group), in the cohorts of 1993–97, 1998–2002 and 2003–07, adjusted for age, sex, PRD and country
| All patients | Age <65 | Age 65+ | No diabetes | Diabetes | |
|---|---|---|---|---|---|
| Covariate adjustment | |||||
| 1993–97 | 1.02 (0.98–1.06) | 0.94 (0.89–1.00) | 1.08 (1.03–1.14) | 1.00 (0.95–1.05) | 1.05 (0.98–1.13) |
| 1998–2002 | 1.00 (0.96–1.03) | 0.92 (0.87–0.98) | 1.04 (1.00–1.09) | 0.96 (0.92–1.00)** | 1.09 (1.02–1.16) |
| 2003–07 | 0.91 (0.88–0.95) | 0.82 (0.77–0.87) | 0.96 (0.92–1.00)* | 0.86 (0.83–0.90) | 1.03 (0.97–1.10) |
| Propensity score matching | |||||
| 1993–97 | 1.02 (0.97–1.06) | 0.94 (0.88–1.00) | 1.09 (1.03–1.16) | 0.99 (0.94–1.05) | 1.04 (0.96–1.13) |
| 1998–2002 | 0.97 (0.93–1.01) | 0.93 (0.87–0.99) | 1.00 (0.94–1.05) | 0.93 (0.88–0.98) | 1.05 (0.97–1.13) |
| 2003–07 | 0.88 (0.85–0.92) | 0.81 (0.75–0.87) | 0.93 (0.88–0.98) | 0.84 (0.79–0.88) | 0.98 (0.91–1.06) |
*P = 0.08; **P = 0.03.
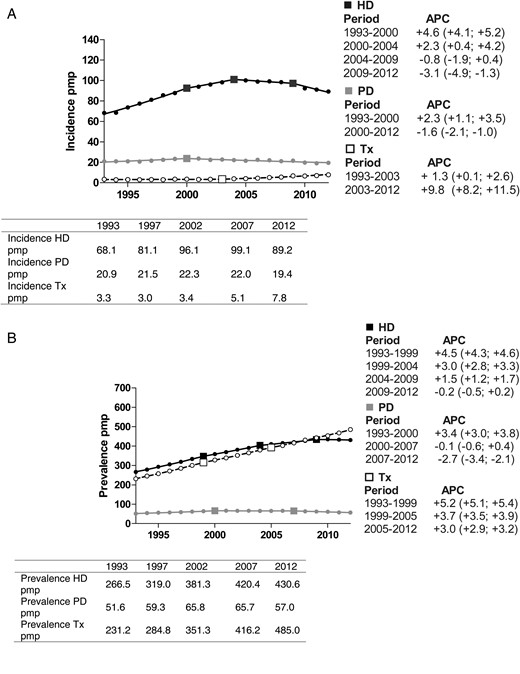
(A) Incidence of HD, PD and kidney transplantation over the period 1993–2012, adjusted for age and sex. (B) Prevalence of HD, PD and kidney transplantation over the period 1993–2012, adjusted for age and sex. Changes in the slopes of these trends were calculated as APC including a 95% CI for each segment (http://surveillance.cancer.gov/joinpoint/). HD, haemodialysis; PD, peritoneal dialysis; Tx, transplantation; APC, annual percentage change; pmp, per million population.
In addition, we studied the 2-year patient survival in the most recent time period available. For patients starting between 2008 and 2009 compared with 2006 and 2007, the survival on dialysis tended to improve both for patients who started on HD (adjusted HR: 0.91, 95% CI: 0.88–0.95) and PD (adjusted HR: 0.93 95% CI: 0.84–1.02). When comparing the 2-year patient survival on PD with HD, we found a survival benefit for PD (HR: 0.80; 95% CI: 0.74–0.87) for patients starting between 2008 and 2009.
Propensity score matching derived a cohort with baseline characteristics that were similar for patients who started with PD and HD (Table 3). The results in the propensity matched cohort were similar to the results from the conventional Cox regression analysis (Table 2).
Baseline characteristics of patients who started with PD and HD treatment after matching on propensity scores
| 1993–97 | 1998–2002 | 2003–07 | 2008–12 | |||||
|---|---|---|---|---|---|---|---|---|
| PD | HD | PD | HD | PD | HD | PD | HD | |
| Incident patients, n | 8198 | 8198 | 9610 | 9610 | 9856 | 9856 | 9631 | 9631 |
| Age, years, mean ± SD | 55.4 ± 16.4 | 55.4 ± 16.6 | 56.5 ± 17.0 | 56.6 ± 16.7 | 58.1 ± 17.0 | 58.3 ± 16.9 | 59.9 ± 17.2 | 60.1 ± 17.0 |
| Age, years, median | 58.0 | 58.4 | 58.8 | 58.7 | 60.5 | 60.8 | 62.8 | 63.0 |
| Age 65+ years, % | 32.8 | 34.6 | 36.6 | 36.6 | 39.3 | 41.2 | 44.6 | 45.6 |
| Sex, % males | 61 | 61 | 63 | 63 | 62 | 62 | 65 | 66 |
| PRD% | ||||||||
| DM | 23.5 | 24.6 | 24.4 | 25.2 | 24.4 | 25.4 | 22.4 | 23.7 |
| HT/RVD | 13.0 | 13.7 | 14.6 | 14.9 | 16.2 | 15.9 | 18.8 | 18.6 |
| GN | 19.7 | 18.4 | 17.6 | 16.8 | 17.2 | 16.7 | 16.5 | 15.7 |
| Other | 43.8 | 43.3 | 43.4 | 43.1 | 42.3 | 42.0 | 42.4 | 42.1 |
| Propensity score | 0.317 | 0.317 | 0.287 | 0.286 | 0.258 | 0.258 | 0.239 | 0.239 |
SD, standard deviation; PRD, primary renal disease; DM, diabetes mellitus; HT/RVD, hypertension/renal vascular disease; GN, glomerulonephritis; HD, haemodialysis; PD, peritoneal dialysis.
Kidney transplant rates
Figure 2A shows that the incidence of kidney transplantation on Day 91 has continued to rise since 1993. Also, the prevalence of kidney transplantation at Day 91 after the start of RRT increased steadily throughout the study period with a greater number of transplant recipients than HD patients since 2010 (Figure 2B). Kidney transplantation following treatment with PD and HD is presented in Figures 3 and 4, respectively. For PD patients, the transplantation rate within 5 years after starting PD remained stable at ∼30%, while the transplantation rate in patients on HD decreased from 23.7 to 18.0%.
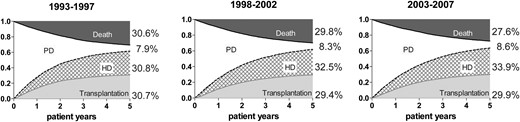
Unadjusted cumulative incidence survival curves for event-free survival, transfers to HD or occurrence of transplantation and death for patients who started PD in 1993–97, 1998–2002 and 2003–07.
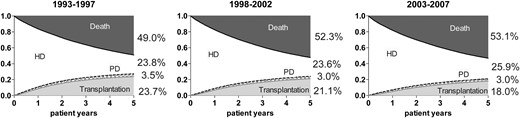
Unadjusted cumulative incidence survival curves for event-free survival, transfers to PD or occurrence of transplantation and death for patients who started HD in 1993–97, 1998–2002 and 2003–07.
Technique survival
To study PD technique survival, a competing risk approach was used in which transfers from PD to HD, kidney transplantation and death within 5 years after the initiation of PD were taken into account (Figure 3). Adjustment for age, sex, PRD and country showed a lower risk of switching from PD to HD in the more recent cohorts when compared with the first cohort (1998–2002—HR: 0.93, 95% CI: 0.89–0.98; 2003–07—HR: 0.95, 95% CI: 0.91–1.00, P = 0.048) (Table 4). For patients who started dialysis more recently, i.e. during 2008–09, the results were not different from that of patients starting during 2006–07 (adjusted HR: 1.01, 95% CI: 0.92–1.11).
Cause-specific HRs for switches from PD to HD and from HD to PD in the cohorts 1993–97 (reference group), 1998–2002 and 2003–07, adjusted for age, sex, PRD and country
| All patients | Age <65 | Age 65+ | No diabetes | Diabetes | |
|---|---|---|---|---|---|
| Transfers from PD to HD | |||||
| 1993–97 | 1.0 | 1.0 | 1.0 | 1.0 | 1.0 |
| 1998–2002 | 0.93 (0.89–0.98) | 0.91 (0.86–0.97) | 0.97 (0.90–1.04) | 0.92 (0.88–0.97) | 0.97 (0.88–1.06) |
| 2003–07 | 0.95 (0.91–1.00) | 0.97 (0.92–1.03) | 0.93 (0.87–1.00) | 0.95 (0.90–1.00) | 0.98 (0.89–1.07) |
| Transfers from HD to PD | |||||
| 1993–97 | 1.0 | 1.0 | 1.0 | 1.0 | 1.0 |
| 1998–2002 | 0.91 (0.85–0.98) | 0.93 (0.85–1.02) | 0.86 (0.76–0.97) | 0.88 (0.81–0.95) | 1.04 (0.89–1.21) |
| 2003–07 | 0.93 (0.87–0.99) | 0.97 (0.89–1.06) | 0.87 (0.78–0.98) | 0.90 (0.83–0.97) | 1.03 (0.89–1.20) |
With a similar approach, we studied trends in HD technique survival (Figure 4). After adjusting for age, sex, PRD and country, lower HRs for switching from HD to PD were found over time (Table 4).
DISCUSSION
In this large European registry study, time trends in PD and HD use were related to dialysis patient and technique survival. Despite improvements in the patient and technique survival for both dialysis modalities, we observed a decline in the prevalence of PD since 2007 and a stabilization of the HD prevalence since 2009.
The results of our survival analysis are consistent with several previous studies showing improved survival outcomes on PD compared with HD in recent years [5, 13–15]. This finding was consistent across patients <65 years old and patients without diabetes mellitus as PRD. However, the baseline characteristics of patients who started treatment on PD and HD substantially differed, with patients treated with PD being younger and relatively healthier than their HD counterparts. We therefore matched the groups of patients treated with HD and PD based on propensity scores to control for this confounding by indication. Overall, also the results in the propensity matched cohort showed a better survival for patients who started treatment with PD compared with patients who started treatment with HD, except for elderly patients and for patients with diabetes mellitus as PRD in whom no differences in survival were found.
The overall dialysis patient and technique survival has improved over time, potentially due to important developments in the dialysis techniques, and improved care alongside dialysis. Also other aspects of treatment alongside dialysis may have had an impact including better use of medication (erythropoiesis-stimulating agents, antihypertensive drugs and phosphorus chelators) and non-pharmacologic treatment (e.g. improved nutritional care and better prophylaxis of infections). Before 2000, PD was characterized by relatively high peritonitis and exit-site infection rates. Updated recommendations on PD-related infection, the launch of ‘flush before fill’ systems and mupirocin prophylaxis, may have contributed to marked decreases in these complications and to improved PD technique survival [16–19]. After 2000, technique survival may have improved due to the prevention of overhydration [20]. Initially, it was suggested that higher PD solute removal was associated with better patient survival [21], but more recently, it appeared to be the presence and magnitude of residual renal function [22, 23]. So-called biocompatible dialysis solutions with fewer glucose degradation products and a higher pH than conventional solutions were introduced in 2002. These solutions are suggested to be associated with a reduction in peritonitis rates [24, 25] and less peritoneal damage compared with conventional solutions [26]. Together with an increased experience with PD [27, 28], these factors may all have contributed to an improved patient and technique survival on PD.
For HD treatment, efforts have been made to expand the improvement in therapy beyond a previous focus on small solute removal, e.g. the evaluation of non-traditional, intensified dialysis schedules including nocturnal and daily dialysis. Several recent studies have shown that longer treatment times with slower ultrafiltration rate and more consistent attainment of ‘dry weight’ are associated with fewer hospitalizations and improved patient survival when compared with conventional HD regimens [29, 30]. In addition, more attention has been paid to the individualization of dialysate prescriptions with regard to potassium and bicarbonate concentrations. Adjustment of the dialysate prescription may be beneficial in minimizing the risk of sudden cardiac death due to rapid short-term electrolyte and fluid shifts [31]. Also the introduction of new procedures such as haemodiafiltration may have contributed significantly to the improvement in clinical outcomes on HD [32, 33]. One should, however, keep in mind that only a relatively small number of patients was treated with these newer techniques and its influence on our results was probably small.
The decrease in PD prevalence could not be explained by a lower patient or technique survival on PD. Another factor that may affect the prevalence of dialysis is the number of dialysis patients receiving a kidney transplant. However, for patients on HD, we found a lower probability of receiving a kidney transplant over time, while the proportion remained stable in patients treated with PD. This indicates that changes in transplant rates have not contributed to the decline in PD and HD prevalence over time. Therefore, the most important explanation is likely the decrease in PD incidence since 2000 and HD incidence since 2009.
Besides a lower incidence of RRT for ESRD in general, the incidence rate of both dialysis modalities may have been affected by the increase in transplants on Day 91 since 1993. This rise in the number of transplants in the first 90 days of RRT indicates that the incidence of pre-emptive transplantation strongly increased. As more patients received a pre-emptive kidney transplant, fewer patients started RRT on dialysis and particularly fewer of them on PD [34, 35]. Furthermore, over the study period, the incident dialysis population showed a substantial increase in age and in the proportion of patients with diabetes mellitus as PRD. Especially, elderly and diabetic patients have a lower chance to receive PD as an initial treatment modality [36] and this trend therefore could partly explain the fall in PD incidence.
The improvements in patient survival in patients initiating dialysis on PD versus HD raises the question of whether PD is an underutilized dialysis modality. Karopadi et al. [37] furthermore showed that overall healthcare expenditure can be reduced by a higher uptake of PD. It is therefore surprising that further improving treatment outcomes and lower costs have been insufficient to tip the balance of modality choice more in favour of PD. For patients without medical or social contraindications for one of the dialysis modalities, PD has some important advantages, but the increasing age and likely concomitant increase in the proportion of patients with comorbidities may have resulted in more patients having perceived medical or social contraindications for PD. While we cannot be certain what the role of patient choice in these trends is, it has been suggested that physician attitude is one of the strongest independent predictors of PD use [38–40].
Strengths of this study include the large sample size, the long follow-up period and the large representation of Europe. Moreover, by applying state-of-the-art methods, we were able to substantially control the effects of confounding by indication. With propensity score matching, we attempted to balance our study population with respect to the measured confounding factors. However, the unmeasured confounders, such as the level of glomerular filtration rate, the presence and severity of comorbidities at the start of dialysis, patient preference and facility- and nephrologist-related factors, could not be taken into account. A viable method to correct for unmeasured confounding factors is the instrumental variable method. We explored this method by using the instrumental variable ‘case-mix-adjusted centre percentage of PD’. The results were not materially different from the results as presented, but we were unable to verify whether the absence of a survival difference results from the broader CIs that are inherent to the instrumental variable method or whether potential instrument-outcome confounders exist that violate the empirically untestable statistical assumptions for this method [41, 42]. Finally, we only explored the differences between all PD and HD patients. Although the proportion of patients with specific types of dialysis treatment is rather low, results might be different for patients receiving specific types of treatments such as nurse-assisted PD or home HD.
In conclusion, we observed a significant decline in PD use and a stabilization in HD prevalence between 1993 and 2012 in 14 renal registries from 11 European countries. The probability of receiving a kidney transplant while on dialysis did not increase over time, so the sole reason for the decreased dialysis use was the lower incidence rate. Overall, initiating RRT on PD treatment was associated with favourable survival outcomes when compared with starting on HD treatment. In the absence of medical or social contraindications, PD can offer some important benefits, including patients’ autonomy and lower costs of the treatment in general. Nevertheless, despite the survival benefits for PD over HD in most patient groups, this study shows that PD is often not preferred as the first dialysis modality. With the steadily accumulating evidence in favour of PD as a first dialysis modality choice, future studies and initiatives need to focus on the underlying clinical and social factors to explain this phenomenon and to identify solutions that may turn the tide.
CONFLICT OF INTEREST STATEMENT
None declared. The results as presented in this paper have not been published previously in whole or part, except in abstract format.
.)
ACKNOWLEDGEMENTS
We would like to thank the patients and the staff of dialysis and transplant units for contributing the data via their national and regional renal registries. We would also like to thank the following national registries for the contribution of these data: Danish Nephrology Registry (DNS) (J.G. Heaf); Greek Renal Registry (G.A. Ioannidis); the regional registry of Basque country (UNIPAR) (Á. Magaz, J. Aranzabal, M. Rodrigo and I. Moina); the other ERA-EDTA Registry Committee members for their advice in the analysis and the drafting of this article: A. Wiecek, D. Fouque, J.W. Groothoff, I. Rychlik and F. Schaefer, and A. Kramer and M. Pippias in the AMC Registry office for data collection and management. The ERA-EDTA Registry is funded by the European Renal Association - European Dialysis and Transplant Association. This article was written by M.W.M.v.d.L., K.J.J. and M.N. on behalf of the ERA-EDTA Registry that is an official body of the ERA-EDTA.


Comments