


Abstract
There is a variation in dialysis withdrawal rates, but reasons for this variation across European countries are largely unknown. We therefore surveyed nephrologists' perceptions of factors concerning dialysis withdrawal and palliative care and explored relationships between these perceptions and reports of whether withdrawal actually occurred in practice.
We developed a 33-item electronic survey, disseminated via an email blast to all European Renal Association–European Dialysis and Transplant Association (ERA-EDTA) members. In our data analyses, we distinguished those respondents who reported occurrence from those reporting no dialysis withdrawal in their unit. With multilevel logistic regression, we investigated the association between respondents' characteristics and perceptions and whether they reported occurrence of dialysis withdrawal or not.
Five hundred and twenty-eight nephrologists from 45 countries completed the questionnaire; 42% reported occurrence of withdrawal in their unit in the past year, and 56% perceived that stopping life-prolonging treatment in terminally ill patients was allowed. Few respondents reported presence in their unit of protocols on withdrawal decision making (7%) or palliative care (10%) or the common involvement of a geriatrician in withdrawal decisions (10%). The majority stated that palliative care had not been part of their core curriculum (74%) and that they had not recently attended continuous medical education sessions on this topic (73%). Respondents from Eastern and Southern Europe had a 42 and 40% lower probability, respectively, of reporting withdrawal compared with those from North European countries. Working in a public centre [odds ratio (OR), 2.41; 95% confidence interval (CI), 1.36–4.25] and respondents' perception that stopping life-prolonging treatment in terminally ill patients was allowed (OR, 1.96; 95% CI, 1.23–3.12), that withdrawal decisions were commonly shared between doctor and patient (OR, 1.97; 95% CI, 1.26–3.08) and that palliative care was reimbursed (OR, 1.81; 95% CI, 1.16–2.83) increased the odds of reporting occurrence of withdrawal.
Reports of dialysis withdrawal occurrence varied between European countries. Occurrence reports were more likely if respondents worked in a public centre, if stopping life-prolonging treatments was perceived as allowed, if withdrawal decisions were considered shared between doctors and patients and if reimbursement of palliative care was believed to be in place. There is room for improvement regarding protocols on withdrawal and palliative care processes and regarding nephrologists' training and education on end-of-life care.
INTRODUCTION
There is an ongoing debate and increasing room for doubt about the benefits of starting or continuing dialysis in many groups of patients. For the frail elderly, the most rapidly growing subgroup of patients starting renal replacement therapy (RRT), there is often an accelerated decrease in the quality of life and independence after initiation of dialysis [1]. One in five patients on dialysis are depressed, and one-third have different degrees of cognitive impairment [2]. Furthermore, it remains unclear whether RRT prolongs life in this elderly patient population [2]. Results from a Canadian survey showed that nearly two out of three patients declared they regretted having started RRT [3]. Over the last decade, the incidence of withdrawals has been increasing [4, 5], as has the interest for issues related to withdrawal decisions.
Reports on incidence of dialysis withdrawal show considerable variation between centres [6]. This variation may partly stem from differences in patient case mix [5, 7], definitions of withdrawal or palliative care [8–10], attitudes of clinicians and patients to end-of-life care planning and choosing not to have dialysis (conservative care) [6, 11, 12], training and education of nephrologists and patients on end-of-life care [13] or differences in how palliative care is organized [9, 10]. Furthermore, from an international perspective, withdrawal of dialysis and end-of-life practices may differ between high and low income countries. Sociocultural and legal–ethical factors also play a role in the management of patients after withdrawal from RRT [10].
The reasons for variation in withdrawal rates across Europe are currently poorly understood. The European Renal Best Practice (ERBP) group has therefore undertaken a survey in an international sample of nephrologists on their perceptions of factors concerning dialysis withdrawal and to explore the relationship between these perceptions and reports of whether withdrawal occurred in their practice.
METHODS
We developed a 33-item English electronic survey in SurveyMonkey® (Supplementary Data 1) to explore nephrologists' perceptions on withdrawal of haemodialysis and palliative care after withdrawal. Within the survey, withdrawal was defined as ‘the deliberate cessation of dialysis treatment even though dialysis is technically still possible’ [8] and palliative care as ‘the care provided to patients with end-stage renal disease after dialysis has been withdrawn’. It concerns the ‘set of treatments that aim to maximize the comfort and quality of life of these patients during the last stages of their life, even if this would hasten death’.
Survey items were derived by two authors (M.W.M.v.d.L. and S.N.v.d.V.) from guidelines and review articles on palliative care and dialysis withdrawal [14–18], and referred to the perception of the respondent on legal–ethical issues around end-of-life care, the decision-making process and patient views around dialysis withdrawal, and on the organization and reimbursement of palliative care, palliative care training and education. This preliminary list was then reviewed and complemented by the other authors to the final version. The final questionnaire was piloted by a panel of six nephrologists and geriatricians for clarity and completeness in the SurveyMonkey format.
We also asked respondents to estimate the percentage of haemodialysis patients under their direct care who had actually withdrawn from treatment (<1, 1–5, 6–10 and >10%) in the last 12 months.
Data collection and analysis
We disseminated the questionnaire via an email blast to all members of the European Renal Association–European Dialysis and Transplant Association (ERA-EDTA) and sent reminders after 3 and 6 weeks. We collected data with SurveyMonkey® in October and November 2013.
Lambie et al. [6] used a 1% cut-off to distinguish clinicians who have an open attitude towards withdrawal from those who are more aversive. Accordingly, we classified those who estimated the percentage of withdrawals in haemodialysis patients under their direct care to be <1% in the last 12 months as ‘reporting no withdrawals’; all others were classified as ‘reporting occurrence of withdrawals’. Using descriptive statistics as appropriate, we summarized the data separately for these two groups. To investigate the association between respondents' characteristics and perceptions (independent variables), and whether they reported occurrence of withdrawal (outcome of interest), we constructed for each independent variable an unadjusted multilevel logistic regression model as well as a model in which we adjusted for every other independent variable that met the criteria for confounding [19]. Clustering of responses within countries was addressed by adding country-level random intercepts to all models. In the primary analyses, we used a Type I error risk (α) of 5% to assess statistical significance, while in a sensitivity analysis, we applied a Bonferroni correction to account for multiple testing.
Since we expected the legal–ethical context of countries to influence respondents' perceptions of withdrawal, we additionally summarized responses regarding laws and regulations at the country level, including only countries with at least 10 respondents. For these countries, we performed a univariate linear regression analysis to explore the association between geographical region and the percentage of respondents reporting withdrawal occurrence. Countries were assigned to a European region (north, south, east and west) following the classification of countries from the 2012 Revision of the World Population Prospects by the United Nations [20]. For this article, Europe was defined as the capture area of ERA-EDTA.
All analyses were performed in SPSS version 22.
RESULTS
In total, 528 nephrologists from 45 countries completed the questionnaire; we were not able to calculate a response rate due to the fact that survey distribution was done by blast email. The majority of respondents were male (64%), had over 10 years of clinical experience (77%), worked in a public centre (76%) and had >50 haemodialysis patients under their direct care (57%). Of all respondents, 220 (42%) reported occurrence of withdrawal in the past 12 months. Table 1 presents respondents' characteristics and perceptions, distinguishing those reporting occurrence of withdrawal from those who reported no withdrawals.
Respondents' characteristics and perceptions, presented separately for those reporting occurrence of withdrawal versus reporting no withdrawals, taking into account eventual clustering of answers on country levela
| Occurrence of withdrawals (n = 220) | No withdrawals (n = 308) | |
|---|---|---|
| Characteristics | ||
| Male gender | 149 (68) | 187 (61) |
| Years of clinical experience | ||
| <5 | 21 (10) | 26 (8) |
| 5–10 | 29 (13) | 45 (15) |
| 10–20 | 76 (35) | 86 (28) |
| >20 | 94(43) | 151 (49) |
| Number of HD patients under respondent's direct care | ||
| <25 | 54 (25) | 74 (24) |
| 25–50 | 42 (19) | 56 (18) |
| >50 | 124 (56) | 178 (58) |
| Working in a public centre | 181 (82) | 218 (71) |
| Perceptions | ||
| Laws and regulations | ||
| Stopping life-prolonging treatment is allowedb | 159 (72) | 136 (44) |
| Regulation of the right for palliative care | ||
| Explicit law | 71 (32) | 52 (17) |
| No explicit law, but official regulation | 26 (12) | 23 (8) |
| No official regulation, but permissive attitude | 91 (41) | 154 (50) |
| None of the above | 32 (15) | 79 (26) |
| Withdrawal decision-making process | ||
| Presence of local protocol on withdrawal decision making | 23 (10) | 14 (5) |
| Geriatrician consulted in ≥25% of withdrawal decisions | 31 (15) | 20 (6) |
| Who makes the decision | ||
| Doctor alone | 36 (16) | 44 (14) |
| Patient/family alone | 15 (7) | 86 (28) |
| Shared decision between doctor and patient/family | 169 (77) | 170 (55) |
| Would withdraw even if patient's decision is not supported by family | 102 (46) | 124 (40) |
| Organization of palliative care after withdrawal | ||
| Presence of local protocol on organization of palliative care | 34 (15) | 21 (7) |
| Palliative care organizations | ||
| Government or private for-profit organizations | 99 (45) | 128 (42) |
| Private not-for-profit organizations and volunteers | 86 (39) | 108 (35) |
| Not organized or do not know | 35 (16) | 72 (23) |
| Palliative care is fully or partly reimbursed | 153 (70) | 152 (49) |
| Palliative care training and education | ||
| Presence of dedicated specialist training on palliative care | 129 (59) | 123 (40) |
| Palliative care as explicit topic within nephrology curriculum | 43 (20) | 24 (8) |
| Attending CME sessions on palliative care in last 3 years | 79 (36) | 62 (20) |
Values are numbers (%). CME, continuous medical education; HD, haemodialysis.
aThose who estimated the percentage of withdrawals in haemodialysis patients under their direct care to be <1% in the last 12 months were classified as ‘reporting no withdrawals’, and all others as ‘reporting occurrence of withdrawals’.
bRefers to perception that stopping life-prolonging treatment in terminally ill patients is formally or informally allowed.
Laws and regulations
Overall, 295 (56%) respondents perceived that stopping life-prolonging treatment in terminally ill patients was formally or informally allowed in their country, and 172 (33%) reported to be aware of an explicit law or official regulation regarding the right for palliative care.
Table 2 shows that there was considerable variation between countries in the percentage of respondents reporting withdrawal occurrence. Countries with a high percentage of respondents reporting occurrence of withdrawal had a higher percentage of reporting that stopping life-prolonging treatment was allowed (Figure 1) and that there was a national law or regulation available (Figure 2A). At the regional level, almost half of respondents from countries in Northern and Western Europe reported the availability of a law or regulation on palliative care, while this was 25 and 24% in Southern and Eastern Europe, respectively (Figure 2B).
Country-level resultsa for items related to legal–ethical context, ordered by the percentage of respondents reporting withdrawal occurrence
| Country | Region | Number of respondents | Occurrence of withdrawal | Stopping life-prolonging treatment is allowedb | National law or regulation of right for palliative care | |||
|---|---|---|---|---|---|---|---|---|
| Explicit law | Official regulation | No regulation, but permissive attitude | No regulation, no permissive attitude | |||||
| Belgium | West | 19 | 79 | 95 | 53 | 5 | 42 | 0 |
| UK | North | 46 | 72 | 80 | 17 | 11 | 65 | 7 |
| France | West | 34 | 65 | 65 | 59 | 3 | 29 | 9 |
| The Netherlands | West | 14 | 64 | 100 | 29 | 14 | 57 | 0 |
| Austria | West | 13 | 62 | 69 | 39 | 15 | 39 | 8 |
| Sweden | North | 15 | 60 | 93 | 40 | 13 | 40 | 7 |
| Switzerland | West | 13 | 54 | 100 | 31 | 15 | 54 | 0 |
| Spain | South | 48 | 50 | 73 | 38 | 21 | 31 | 10 |
| Germany | West | 37 | 49 | 57 | 24 | 22 | 49 | 5 |
| Czech Republic | East | 12 | 33 | 33 | 17 | 17 | 42 | 25 |
| Portugal | South | 14 | 29 | 71 | 43 | 21 | 29 | 7 |
| Romania | East | 18 | 28 | 33 | 11 | 0 | 56 | 33 |
| Egypt | South | 15 | 27 | 20 | 0 | 0 | 53 | 47 |
| Russia | East | 11 | 27 | 18 | 9 | 18 | 9 | 64 |
| Greece | South | 26 | 23 | 8 | 12 | 0 | 39 | 50 |
| Poland | East | 17 | 18 | 53 | 24 | 0 | 59 | 18 |
| Italy | South | 77 | 13 | 40 | 7 | 3 | 53 | 38 |
| Croatia | South | 11 | 0 | 27 | 0 | 0 | 55 | 45 |
Values are numbers (%).
aResults displayed for countries with at least 10 respondents.
bRefers to respondents' perception that life-prolonging treatment in terminally ill patients is formally or informally allowed in their country.
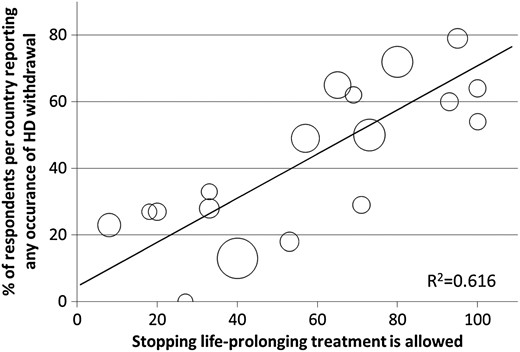
Bubble plot presenting the association between percentage of respondents in a country reporting occurrence of withdrawal (y-axis) and reporting that stopping life-prolonging treatment in terminally ill patients is—formally or informally—allowed (x-axis). Each bubble represents a country; the bigger the bubble, the more respondents in a country. The R2 value implies that 62% of the variance in reported occurrence of withdrawal in our data set is explained by reports on stopping life-prolonging treatment being perceived as allowed.
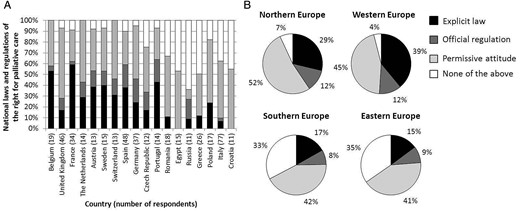
National laws and regulations of the right for palliative care; figures display results for countries with ≥10 respondents. (A) Percentage of respondents per country reporting presence of a certain type of regulation. Countries on the x-axis are ordered based on the percentage of reports of withdrawal occurrence, ranging from 79% in Belgium to 0% in Croatia. (B) Percentage of respondents per region reporting presence of a certain type of regulation.
Our univariate country-level linear regression analysis showed that—compared with countries in Northern Europe—the probability of reporting occurrence of withdrawal in Southern and Eastern Europe was 42 and 40% lower, respectively (P < 0.01), but was similar in countries in Western Europe (4% lower; P = 0.71).
Dialysis withdrawal
Table 1 displays that the majority of respondents (64%) perceived the withdrawal decision to be commonly shared between doctor and patient/family, but 43% would withdraw if the family did not support a patient's decision to withdraw. Overall, local protocols (7%) and consultation of a geriatrician (10%) were rarely reported as being in place.
With regard to perceived patient views on dialysis withdrawal, the majority of respondents believed that the imbalance between treatment burden and expected survival benefit was the main reason for patients to withdraw (79%) or because they wanted to relieve the burden for their family (23%). The most frequently reported perceived reasons by the respondents on why patients who were considering to withdraw would still continue their treatment were fearing a lack of adequate further medical support (35%), lack of social support at home (27%) and lack of suitable palliative care facilities (27%). Furthermore, respondents indicated that they expected that more patients would opt for withdrawal if better logistical services around withdrawal and palliative care were available (43%), if nephrologists had more knowledge on palliative care (33%) or if more palliative care specialists would be available (34%).
Palliative care
Palliative care after dialysis withdrawal was most often reported to be fully or partly reimbursed (58%) and organized by government or private for-profit organizations (43%); reports of availability of local protocols around organization of palliative care were uncommon (9%) (Table 1). Of all survey participants, 41% (n = 214) indicated that the majority of patients were sent home after withdrawal, with 31% (n = 66) of them reporting that most patients were first admitted to the hospital to prepare them for the new situation at home. Others reported referral destinations for withdrawn patients were general hospices (16%) and specialist palliative care hospices (17%).
Table 1 shows that the majority of nephrologists stated that palliative care was an acknowledged medical specialty in their country (48%), that it had not been part of their core curriculum (74%) and that they had not recently attended continuous medical education (CME) sessions on palliative care (73%) because these were not organized or because they deemed other sessions more relevant.
Respondents' characteristics and perceptions associated with reports of withdrawal occurrence
Table 3 shows the results of the multilevel analyses of the association between respondents' characteristics and perceptions and their reports of withdrawal occurrence. The odds of nephrologists working in public centres to report occurrence of withdrawal were more than twice as high compared with those working in a private centre [odds ratio (OR), 2.41; 95% confidence interval (CI), 1.36–4.25]. Perceiving that stopping life-prolonging treatment in terminally ill patients was allowed (OR, 1.96; 95% CI, 1.23–3.12) and that withdrawal decisions were commonly shared between doctor and patient (OR, 1.97; 95% CI, 1.26–3.08) almost doubled respondents' odds of reporting withdrawal occurrence; this was also true for reports of that palliative care was fully or partly reimbursed (OR, 1.81; 95% CI, 1.16–2.83). Furthermore, we found a statistically significant association between reporting withdrawal occurrence and reporting recent attendance of CME sessions on palliative care (OR, 1.68; 95% CI, 1.07–2.65) as well as between reporting occurrence and reporting that palliative care was an explicit topic within the nephrology curriculum (OR, 1.93, 95% CI, 1.02–3.64). However, the latter association did not reach statistical significance in our sensitivity analysis, whereas all other adjusted analyses showed similar results.
Results of the unadjusted and adjusted analyses of the association between respondent characteristics and perceptions, and reporting occurrence of withdrawal
| Unadjusted analysis | Adjusted analysis | ||
|---|---|---|---|
| OR (95% CI) | Adjusted fora | OR (95% CI) | |
| Respondent characteristics | |||
| Male gender | 1.45 (0.96–2.19) | 1 | 1.49 (0.93–2.39) |
| Years of clinical experience | |||
| <5 | [reference category] | 2 | |
| 5–10 | 0.62 (0.25–1.57) | 0.63 (0.25–1.63) | |
| >10 | 0.81 (0.36–1.82) | 0.86 (0.38–1.98) | |
| 0.62 (0.28–1.39) | 0.59 (0.26–1.35) | ||
| Number of HD patients under respondent's direct care | |||
| <25 | [reference category] | ||
| 25–50 | 1.19 (0.66–2.15) | 1 | 1.28 (0.65 –2.51) |
| >50 | 1.23 (0.76–2.00) | 1 | 1.47 (0.83–2.58) |
| Working in a public centre | 2.42 (1.45–4.03) | 2 | 2.41 (1.36–4.25) |
| Respondent perceptions | |||
| Laws and regulations | |||
| Regulation of the right for palliative care | |||
| Explicit law | 1.50 (0.80–2.82) | 3 | 1.37 (0.71–2.63) |
| No explicit law, but official regulation | 1.25 (0.57–2.74) | 3 | 1.09 (0.49–2.43) |
| No official regulation, but permissive attitude | 0.86 (0.50–1.49) | 3 | 0.76 (0.43–1.33) |
| None of the above | [reference category] | ||
| Stopping life-prolonging treatment is allowedb | 2.30 (1.50–3.52) | 3, 4 | 1.96 (1.23–3.12) |
| Withdrawal decision-making process | |||
| Presence of local protocol on withdrawal decision making | 1.74 (0.82–3.69) | 3, 5 | 1.50 (0.69–3.28) |
| Geriatrician consulted in ≥25% of withdrawal decisions | 2.00 (1.01–3.96) | 3, 5 | 1.70 (0.84–3.43) |
| Withdrawal decision shared between doctor and patient/family | 1.98 (1.29–3.05) | 3, 5 | 1.97 (1.26–3.08) |
| Would withdraw even if patient's decision is not supported by family | 1.36 (0.92–2.02) | 3, 5 | 1.31 (0.88–1.97) |
| Organization of palliative care after withdrawal | |||
| Presence of local protocol on organization of palliative care | 1.30 (0.67–2.52) | 3, 5 | 1.14 (0.57–2.28) |
| Palliative care organizations | 3, 5 | ||
| Not organized or do not know | [reference category] | ||
| Government or private for-profit organizations | 1.57 (0.91–2.71) | 3, 5 | 1.62 (0.92–2.85) |
| Private not-for-profit organizations and volunteers | 1.69 (0.97–2.98) | 3, 5 | 1.74 (0.97–3.13) |
| Palliative care is fully or partly reimbursed | 1.87 (1.22–2.88) | 3, 5 | 1.81 (1.16–2.83) |
| Palliative care training and education | |||
| Presence of dedicated specialist training on palliative care | 1.48 (0.97–2.26) | 3, 5 | 1.49 (0.96–2.32) |
| Palliative care as explicit topic within nephrology curriculum | 1.98 (1.09–3.61) | 3, 5 | 1.93 (1.02–3.64)c |
| Attending CME sessions on palliative care in last 3 years | 1.73 (1.11–2.70) | 3 | 1.68 (1.07–2.65) |
CI, confidence interval; CME, continuous medical education; HD, haemodialysis.
aNumbers in this column refer to the following variables: 1, all other respondent characteristics; 2, all other respondent characteristics except ‘Number of HD patients under respondent's direct care’; 3, all respondent characteristics; 4, all other respondent perceptions; 5, regulation of the right for palliative care.
bRefers to perception that stopping life-prolonging treatment in terminally ill patients is formally or informally allowed.
cIn our sensitivity analysis, this association did not reach statistical significance after applying a Bonferroni correction, with a 97% CI of 0.95–3.89.
DISCUSSION
Summary of results
The results of this survey indicate that reports of haemodialysis withdrawal occurrence and perceptions of factors related to withdrawal of patients on RRT vary considerably between countries and regions in Europe. Few respondents reported availability of local protocols around withdrawal and palliative care. Respondents who perceived that stopping life-prolonging treatments was allowed, that withdrawal decisions were shared between doctor and patient or that palliative care was reimbursed more often reported that withdrawals had occurred in their practice in the last year. Working in a public centre and having attended CME sessions on palliative care were also factors associated with increased reports of withdrawal occurrence.
We observed an association between geographical region and reports of withdrawal occurrence, with a higher percentage of respondents reporting withdrawal in Northern Europe, compared with Southern and Eastern Europe. Much of the literature on withdrawal and end-of-life care comes from the USA and the UK, and only a few publications include comparisons between countries [16]. This makes it difficult to get an insight into the impact of cultural and regional differences on end-of-life management and decision making. The Anglo-Saxon culture emphasizes patient autonomy and aspects of cost–utility, but in many other cultures, not doing as much as possible for a loved one is considered dishonourable. This would suggest that ethnicity, regional culture, family structure and spiritual beliefs may influence the uptake of and attitude towards end-of-life care [21, 22]. For example, Thomas et al. [23] reported a lower likelihood of withdrawal and a lower referral rate to hospice care for ethnic minorities in the USA, though it was unclear whether this reflected differences in quality of care or practice patterns according to patient preferences and cultural attitudes.
In addition, cultural beliefs and attitudes can change over time under the influence of better understanding of what a treatment actually can or cannot achieve [24, 25]. In discussions with patients and their relatives, physicians should therefore explain that they believe the treatment does not add qualitative life years and that this fact steers their concern about continuing it [26]. However, many physicians may feel uncomfortable talking about withdrawal with patients [27]. They might be uncertain of the patient's prognosis or—as identified in our study—there may be a lack of local protocols and care plans around end-of-life decisions. Importantly, aversion towards and lack of guidance on having end-of-life decisions with patients have been associated with more aggressive treatment [28, 29]. Recently, some sensitive and specific prognostic scores have been developed for short-term prognostication in patients on haemodialysis [30]. Repetitive assessments of these scores can be a cue to start changing from a ‘procrastination’ approach to a more palliative approach of the patient [31]. Having such a valid estimation of the prognosis of the patient can potentially reduce the discomfort of the treating physician to discuss withdrawal of therapy with the patient and his/her relatives. In addition to these prognostic tools, evaluating the patient's comorbidity profile and functional status (e.g. using the Charlson comorbidity index and Karnofsky scale, respectively) and asking the surprise question (Would I be surprised if this patient died within the next year?) can all be of use in predicting the patient's prognosis [32, 33]. Ideally, prognosis and functional outcome discussions should become a normal facet of routine renal practice.
The large majority of nephrologists participating in our survey had not recently attended any CME sessions on palliative care, mainly because they perceive that such sessions were not organized. This is in line with previous research pointing out the suboptimal preparation of nephrologists for palliative care and for communication of end-of-life issues with the patient and the family [34, 35]. Schell et al. [35] reported that less than one out of three nephrology fellows was trained in the management of patients with a poor prognosis, whereas the majority agreed that having these skills would be necessary to improve their approach of and communication with these patients. Combs et al. [13] recently reported that the quality and quantity of palliative and end-of-life care training had not improved in the last decade. Based on these and our findings, particularly that education is related to positive attitudes towards withdrawal, we suggest that it is important to invest in improving knowledge of nephrologists regarding available palliative and end-of-life care options. Skills to discuss and organize end-of-life should therefore be recognized as an essential component of continuing medical education for all practicing nephrologists. Educational bodies, including the European and national nephrology societies, should make sure that these topics are included in the curriculum for nephrology trainees and provide CME sessions on this issue.
Whereas education is an essential prerequisite, it is also evident that end-of-life conversations take time to prepare and perform properly. This time might not always be available to busy clinicians. We will therefore also need a switch in thinking about healthcare, putting more emphasis on caring rather than on curing [36]. To this end, there may be several lessons to be learned from the oncology field, where palliative care after withdrawal from curative treatment is already integrated in the current practice. Whereas end-of-life discussions are associated with lower healthcare expenditure in the oncology setting [37], economic reasons should not be used as the main argument to support an open atmosphere to discuss withdrawal of therapy in patients with poor prognosis and quality of life: the major argument is that it improves satisfaction and quality of life in the remaining time of the patient and also the grieving and bereavement process of the relatives [38].
There was an association between working in a public centre and occurrence of withdrawal. Due to its design, our survey does not allow to make a causal relation. This association can be best further explored by first analysing whether this difference is due to differences in patient mix (observational registry data). If such a difference in case mix exist, it should be explored by qualitative research whether this attributable to physician preference (cherry picking), to patient preferences or a combination of both.
Strengths and limitations
Country-level factors, such as legal–ethical context, appeared to be associated with withdrawal occurrence as reported by individual nephrologists. Asking for respondents' perceptions of legal–ethical aspects, instead of collecting information on factual legislations in countries, allowed us to capture a better reflection of attitudes towards withdrawal in daily practice. Access to and provision of dialysis are somewhat unequal throughout Europe [39, 40], and therefore, attitudes towards withdrawal as reported in our survey could potentially be influenced by financial and logistical issues. However, the prevalence of withdrawal seems to be highest in countries with the least financial restrictions and the highest prevalence of RRT. This observation is rather in line with the idea that a higher take on rate, and thus inclusion of more frail patients, results in higher withdrawal rates. It does not support the notion that withdrawal is induced by financial restrictions, although it cannot be excluded that in such cases, withholding might occur. Also, having respondents from 45 countries from the European continent participating in the study increased the generalizability of our findings to the broader European renal community.
The survey focused on self-reported attitudes, beliefs and perceptions, which are susceptible to reporting bias. However, it is unlikely that respondents who feel so much peer pressure that they do not even report withdrawal in an anonymous survey would actually perform it in practice. Also, nephrologists with a strong interest in end-of-life care may have been more eager to respond, potentially resulting in selection bias. We did not use actual case vignettes, which would have allowed to evaluate the impact of patient age, quality of life and comorbidity on the attitude of the respondent. Lastly, the occurrence of withdrawal was estimated by respondents and did not allow us to draw conclusions on actual withdrawal rates.
CONCLUSION
Reports of occurrence of withdrawal from dialysis are not uncommon but vary between European countries and regions. Occurrence was more likely to be reported if stopping life-sustaining treatments was perceived as being allowed, if withdrawal decisions were seen as shared decisions between doctors and patients and if reporting that palliative care was reimbursed. Also, working in a public centre and having attended CME sessions on palliative care were associated with increased reports of withdrawal occurrence. There is substantial room for improvement regarding the availability of protocols on the withdrawal and palliative care process and an urgent need for improving nephrologists' training and education in this field.
SUPPLEMENTARY DATA
Supplementary data are available online at http://ndt.oxfordjournals.org.
CONFLICT OF INTEREST STATEMENT
None declared.
ACKNOWLEDGEMENTS
This article was written by W.v.B. on behalf of European Renal Best Practice (ERBP) and co-authored by M.W.M.v.d.L. and K.J.J. on behalf of the European Renal Association–European Dialysis and Transplant Association (ERA-EDTA) Registry, both which are official bodies of the ERA-EDTA. S.N.v.d.V. is an ERBP research fellow funded by the ERA-EDTA.
REFERENCES
Author notes
*Both authors equally contributed to the manuscript.


Comments