


Abstract
The ‘integrated home dialysis’ model involving initiation of peritoneal dialysis (PD) first followed by home haemodialysis (HHD) has previously been proposed as an optimal form of dialysis that maximizes the advantages of both modalities. While this model has great potential, its clinical outcomes, especially compared with direct HHD initiation, remain uncertain.
All incident home dialysis patients from the Australia and New Zealand Dialysis and Transplant (ANZDATA) registry between 2000 and 2012 were included. Propensity score matching was performed to evaluate patients initially treated with PD followed by HHD (‘PD + HHD’), PD without subsequent transition to HHD (‘PD only’) and HHD without subsequent transition to PD (‘HHD only’). The composite primary outcome was death and home dialysis technique failure (defined as transfer to facility haemodialysis for 90 days). Groups were compared using a Cox proportional hazards model.
The 2:1 matched cohort included 84 patients in the ‘PD + HHD’ group, 168 patients in the ‘HHD only’ group and 168 patients in the ‘PD only’ group. Compared with the ‘PD + HHD’ group, death and home dialysis technique failure was similar for patients treated with ‘HHD only’ [hazard ratio (HR) 0.92, 95% confidence interval (CI) 0.52–1.62; P = 0.77] and higher for those treated with ‘PD only’ (HR 3.22, 95% CI 1.97–5.25; P < 0.001).
Patients treated with PD first followed by HHD had a risk of death and home dialysis technique failure that was comparable to those treated with HHD as the only home dialysis modality and inferior to those treated with PD as the only home dialysis modality. These results support the ‘integrated home dialysis model’ in patients who initiate dialysis with PD.
INTRODUCTION
Selection of the optimal dialysis modality, based on patients' needs and economic considerations, is central to good nephrology practice. Over the past 15 years, the ‘integrated dialysis’ model [or peritoneal dialysis (PD)-first model] has been advocated by a number of groups as a strategy for optimizing dialysis care [1–7]. This model proposes initiation of dialysis with PD followed by transition to haemodialysis (HD) after PD completion, thereby capitalizing on the economic and clinical advantages of PD, especially during the first years after dialysis initiation [8–12]. Some potential advantages of a PD-first model of care include preservation of residual kidney function [13, 14], protection of potential vascular access and reduction in bacteraemia risk [15, 16], improved ability to provide incremental dialysis [17, 18], maintenance of lifestyle with a more flexible dialysis schedule [19, 20], reduced hepatitis virus transmission [21] and possibly an early survival advantage in the first few years of dialysis [22–27]. Following completion of PD therapy, most patients transfer to facility HD [28, 29].
More recently, an ‘integrated home dialysis’ model, proposing the initiation of dialysis treatment with PD with subsequent transition to home haemodialysis (HHD; when possible) at the time of PD completion has been advocated [30]. This new dialysis paradigm offers the benefit of maximizing home-based dialysis therapy while still capitalizing on the putative early advantages of PD and the potential survival advantages afforded by HHD [23]. However, the ‘integrated home dialysis’ model does involve more intensive training in two distinct forms of home dialysis and its clinical outcomes compared with other forms of home dialysis (PD only or HHD only) have not been formally evaluated.
The aim of this study was to evaluate patient and technique survival in patients treated with the ‘integrated home dialysis’ model compared with those treated with PD only or HHD only prior to other forms of renal replacement therapy.
MATERIALS AND METHODS
Study design and population
All Australian and New Zealand patients treated with PD or HHD on Day 90 after renal replacement therapy (RRT) initiation between 1 January 2000 and 31 December 2012 were included in this observational cohort study. Data were accessed through the Australia and New Zealand Dialysis and Transplant (ANZDATA) registry, which includes prospectively collected data from all dialysis centres across these two countries. Patients with <90 days of RRT and those younger than 18 years at the initiation of RRT were excluded.
Exposure definitions
The study cohort was divided into four groups based on dialysis modality on Day 90 after RRT initiation and direct transfer (or not) to the other home dialysis modality (defined as transfer within <90 days of the initial home modality completion): (i) PD on Day 90 after RRT initiation without direct transfer to HHD after PD completion (‘PD only’), (ii) HHD on Day 90 after RRT initiation without direct transfer to PD after HHD completion (‘HHD only’), (iii) PD on Day 90 after RRT initiation with direct transfer to HHD after PD completion (‘PD + HHD’) and (iv) HHD on Day 90 after RRT initiation with direct transfer to PD after HHD completion (‘HHD + PD’). PD and HHD completion were defined by at least 90 days of another dialysis modality (facility haemodialysis or the other home dialysis modality). It was pre-specified to exclude patients in the last group (‘HHD + PD’) from the analyses, because this group was expected to contain a very small number of patients (Figure 1). Patients treated with PD on Day 90 who directly transferred to HHD after PD failure and eventually directly switched back to PD (PD − HHD − PD pattern) were included in the ‘PD + HHD’ group and followed until the end of the total home dialysis period.

Study design.
Outcomes assessment
The primary outcome of this study was the composite of patient and home dialysis technique survival. Patients were followed until death or home dialysis technique failure, defined as 90 days or more of facility haemodialysis. All data were censored at the time of transplantation, recovery of kidney function, loss to follow-up or the end of the study (1 December 2012), whichever came first. Any events (death or censoring event) occurring <90 days after a switch from home dialysis to facility haemodialysis were counted as occurring during home dialysis.
Patient survival on home dialysis treatment was evaluated as a secondary outcome and in that case data were censored at the time of technique failure or any of the above-described censoring events.
Covariates assessment
Baseline characteristics were evaluated at the time of RRT initiation and include age, gender, race (Caucasian, Asian and Indigenous/others), primary kidney disease (diabetes, glomerulonephritis, hypertensive, reflux, polycystic, other), suspected or proven comorbidities (cerebrovascular, peripheral vascular, pulmonary and coronary disease), diabetes (type 1 and 2), active cigarette smoking, categories of body mass index (BMI; <20, 20–24.9, 25–29.9 and ≥30 kg/m2), late nephrology referral (<3 months before RRT start), era (2000–2005, 2006–2012), estimated glomerular filtration rate (eGFR) [31] and region. Less than 1% of patients had missing covariate data and were excluded from the analyses.
Statistical analysis
Baseline characteristics were reported as count with percentage for categorical variables and median with interquartile range for continuous non-normally distributed variables. Differences between non-matched groups were compared by Chi-squared tests for categorical data and Kruskal–Wallis tests for non-normally distributed continuous data. Matched groups were compared using conditional logistic regression for categorical data and Friedman test for non-normally distributed continuous data.
Propensity score matching
Propensity score matching (PSM) was used to create comparable dialysis groups for evaluation of time-to-event outcomes. First, the probability of patients belonging to a particular home dialysis treatment group (PD only, HHD only or PD + HHD) was predicted by a multinomial logistic regression including all covariates listed in Table 1 with region further subcategorized into Australian state of residence and New Zealand. Two-way interactions involving age, race, diabetes mellitus, BMI and primary kidney disease with other covariates were evaluated with a likelihood ratio test and included in the final multivariable multinomial logistic regression model when significant (P < 0.05). The PS model had a McFadden R-square of 0.22 (good fit) [32] and its distribution was balanced across the three groups (Supplementary data, Figure S1). Patients were further stratified in two age groups (<50 years and ≥50 years) and then underwent a propensity score (PS) 1:2 nearest-neighbour matching whereby each ‘PD + HHD’ patient was matched to two ‘PD only’ and two ‘HHD only’ patients belonging to the same age strata. Furthermore, in order to mitigate risk of immortal time bias in the ‘PD + HHD’ group, only patients from the ‘PD only’ and ‘HHD only’ groups with home dialysis durations greater than the time each ‘PD + HHD’ patient spent on PD (plus time on temporary facility HD, if applicable) before starting HHD were selected in the matched cohort [33].
Baseline characteristic—global cohort
| Characteristic | PD + HHD (93) | PD (10 617) | HHD (685) | P |
|---|---|---|---|---|
| Age | 50 (42–57) | 62 (50–71) | 46 (40–54) | <0.001 |
| Sex male | 71 (76) | 6011 (57) | 516 (75) | <0.001 |
| Race | <0.001 | |||
| Caucasian | 60 (65) | 7329 (69) | 572 (84) | |
| Asian | 19 (20) | 1217 (11) | 46 (7) | |
| Indigenous | 11 (12) | 1957 (18) | 62 (9) | |
| Other | 3 (3) | 114 (1) | 5 (1) | |
| Primary kidney disease | <0.001 | |||
| Glomerulonephritis | 50 (54) | 2612 (25) | 263 (38) | |
| Diabetes | 10 (11) | 3729 (35) | 123 (18) | |
| Hypertension | 2 (2) | 1524 (14) | 45 (7) | |
| Polycystic | 9 (10) | 584 (6) | 130 (19) | |
| Reflux | 5 (5) | 333 (3) | 38 (6) | |
| Other | 17 (18) | 1835 (17) | 86 (13) | |
| Cigarette (active at entry) | 9 (10) | 1449 (14) | 80 (12) | 0.19 |
| Comorbidities | ||||
| Pulmonary disease | 10 (11) | 1596 (15) | 52 (8) | <0.001 |
| Coronary disease | 9 (10) | 4051 (38) | 117 (17) | <0.001 |
| Peripheral vascular disease | 6 (6) | 2579 (24) | 57 (8) | <0.001 |
| Cerebrovascular disease | 4 (4) | 1590 (15) | 30 (4) | <0.001 |
| Diabetes | 17 (28) | 4631 (44) | 156 (23) | <0.001 |
| BMI | <0.001 | |||
| <20 kg/m2 | 2 (2) | 821 (8) | 33 (5) | |
| 20–24.9 kg/m2 | 27 (29) | 3424 (32) | 168 (25) | |
| 25–29.9 kg/m2 | 31 (33) | 3681 (34) | 242 (36) | |
| 30 kg/m2 and over | 33 (35) | 2649 (25) | 238 (35) | |
| Late nephrology referral | 15 (16) | 2113 (20) | 43 (6) | <0.001 |
| Era | 0.10 | |||
| 2000–2005 | 40 (43) | 4825 (45) | 283 (41) | |
| 2006–2012 | 53 (57) | 5792 (55) | 402 (59) | |
| Region NZ | 14 (15) | 2606 (25) | 132 (19) | 0.001 |
Data are presented as number (percentage) or median (interquartile range).
BMI, body mass index; NZ, New Zealand.
Survival analysis
For all time-to-event analyses, time zero was defined as the time when HHD was initiated for patients in the ‘PD + HHD’ group and matching time for the other groups. Survival times for the primary and secondary outcomes were analysed with the Kaplan–Meier product limit method. To account for the matched design of the study, unadjusted Cox proportional hazards models with cluster robust standard errors were used to compare survival across groups. The proportional hazards assumption was assessed visually with log-minus-log plots, observed (Kaplan–Meier) and predicted (Cox) graphs, and Schoenfeld residuals.
Sensitivity analysis
Several sensitivity analyses were performed. First, in order to address potential residual imbalances in covariates after PS matching, multivariable analyses adjusting for covariates with a P-value <0.20 in the post-match comparison (sex, coronary disease, BMI, country) were performed. Second, the primary and secondary outcomes survival analyses were repeated in second PSM models with a more permissive (<180 days) duration of facility HD between PD completion and HHD initiation. Third, a competing risk model with transplantation defined as the competing event was performed. Finally, the primary and secondary outcomes were assessed in the global cohort with a multivariable model including home dialysis modality as a time-varying covariate. Other pre-specified covariates included age, race, gender, diabetes, primary kidney disease and late referral.
All statistical analyses were performed using Stata IC software (version 12.1 StataCorp, College Station, TX, USA). A two-tailed P-value <0.05 was considered statistically significant.
RESULTS
Overall, 11 416 incident home dialysis patients were evaluated in this study. Among them, 10 617 patients were included in the ‘PD only’ group (patients with PD on Day 90 after RRT initiation and not directly transferred to HHD at the time of PD completion), 685 patients were included in the ‘HHD only’ group (patients with HHD on Day 90 after RRT initiation and not directly transferred to PD at time of HHD completion) and 93 patients were included in the ‘PD + HHD’ group (patients with PD on Day 90 after RRT initiation and transferred to HHD <90 days after PD completion, including one patient with a ‘PD - HHD - PD’ pattern). Inadequate dialysis (clearance or ultrafiltration-related) was the main cause of PD technique failure among the ‘PD + HHD’ group (54 patients [58%]), followed by infection (16 patients [17%]) and mechanical complications (9 patients [10%]). Twenty-one patients initially treated with HHD and then transferred to PD were excluded from the analyses, as pre-specified owing to the anticipated small number. Baseline characteristics for the overall cohort are presented in Table 1. Patients in both the PD + HHD and HHD groups were more likely to be young, male and in the higher BMI categories with fewer comorbidities than patients in the PD group.
Matched cohort analyses
The primary and secondary outcomes were compared on matched samples incorporating survival time since RRT initiation in order to mitigate a potential immortal bias among patients in the ‘PD + HHD’ group. Indeed, these patients had a mean chronic dialysis vintage of 2.3 (1.3–3.6) years before transfer to HHD. The matched cohort included 84 patients treated with ‘PD + HHD’, 168 patients treated with ‘PD only’ and 168 patients treated with ‘HHD only’. Baseline characteristics of matched patients are presented in Table 2. Overall, groups were similar after the matching process.
Baseline characteristics of matched cohort
| Characteristic | PD + HHD (84) | PD (168) | HHD (168) | P |
|---|---|---|---|---|
| Age | 47 (41–57) | 47 (37–60) | 47.5 (42–55) | 0.70 |
| Sex male | 67 (80) | 115 (68) | 116 (69) | 0.11 |
| Indigenous | 9 (11) | 19 (11) | 11 (7) | 0.29 |
| Glomerulonephritis | 44 (52) | 75 (45) | 69 (41) | 0.21 |
| Cigarette (active at entry) | 9 (11) | 27 (16) | 24 (13) | 0.51 |
| Comorbidities | ||||
| Pulmonary disease | 10 (12) | 17 (10) | 14 (8) | 0.65 |
| Coronary disease | 8 (10) | 28 (17) | 33 (20) | 0.12 |
| Peripheral vascular disease | 5 (6) | 15 (9) | 16 (10) | 0.60 |
| Cerebrovascular disease | 4 (5) | 7 (4) | 6 (4) | 0.90 |
| Diabetes | 16 (20) | 32 (19) | 33 (20) | 0.99 |
| BMI ≥25 kg/m2 | 61 (73) | 101 (60) | 111 (66) | 0.13 |
| Late nephrology referral | 9 (11) | 18 (11) | 10 (6) | 0.22 |
| eGFR | 7.5 (6.1–9.5) | 7.0 (6.7–9.7) | 7.2 (5.8–9.4) | 0.93 |
| Era 2000–2005 | 36 (43) | 82 (49) | 85 (51) | 0.50 |
| Region NZ | 13 (15) | 42 (25) | 22 (13) | 0.02 |
Data are presented as number (percentage) or median (interquartile range).
BMI, body mass index; NZ, New Zealand; eGFR, estimated glomerular filtration rate (modification of diet in renal disease formula).
Patient and home dialysis technique survival
A total of 140 events (51 deaths) were observed in the matched cohort primary analysis; 15 events (seven deaths) in patients treated with ‘PD + HHD’, 34 events (13 deaths) in those treated with ‘HHD only’ and 91 events (31 deaths) in patients treated with ‘PD only’. Patient and technique survival was different in the three groups with respective 1-, 2- and 5-year survival rates of 94, 86 and 55% in the ‘PD + HHD’ group, 95, 87 and 66% in the ‘HHD only’ group and 81, 59 and 20% in the ‘PD only’ group (Figure 2). As previously mentioned, time zero for survival analysis was based on the time when the matched ‘PD + HHD’ patient started HHD and matching time for the ‘PD only’ and ‘HHD only’ groups. Compared with patients in the ‘PD + HHD’ group, the risk of death or home dialysis technique failure was similar for patients treated with ‘HHD only’ [hazard ratio (HR) 0.92 (95% confidence interval (CI) 0.52–1.62; P = 0.77] but higher for those treated with ‘PD only’ (HR 3.22, 95% CI 1.97–5.25; P < 0.001).
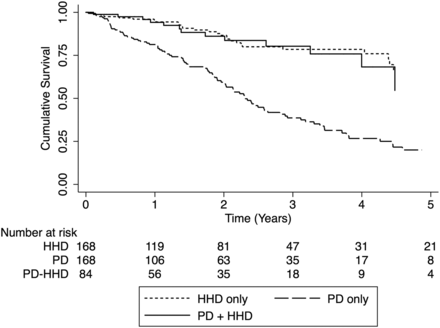
Patient and home dialysis technique survival. Survival from start of HHD (PD + HHD cohort) or time of matching (matched PD and HHD cohorts). HR: 0.92, 95% CI 0.52–1.62; P = 0.77, ‘HHD only’. HR: 3.22, 95% CI 1.97–5.25; P < 0.001, ‘PD only’.
Patient survival on home dialysis
Survival on home dialysis, censored for technique failure, was also different in the three matched groups. Compared with patients treated with ‘PD + HHD’, mortality on home dialysis was similar among patients treated with ‘HHD only’ (HR 0.77, 95% CI 0.34–1.72; P = 0.52) but higher among those treated with ‘PD only’ (HR 2.44, 95% CI 1.19–4.99; P = 0.01; Figure 3).
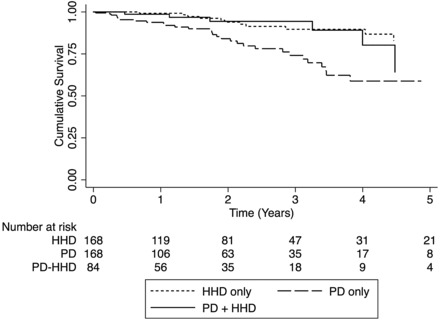
Patient survival on home dialysis. Survival from start of HHD (PD + HHD cohort) or time of matching (matched PD and HHD cohorts). HR: 0.77, 95% CI 0.34–1.72; P = 0.52, ‘HHD only’. HR: 2.44, 05% CI 1.19–4.98; P = 0.01, ‘PD only’.
Sensitivity analysis
In order to account for potential residual imbalance between the groups after PSM, multivariable-adjusted sensitivity analyses were performed (in the PSM cohort), including all covariates with a P-value ≤0.20 in the post-match comparison. The results of these analyses, adjusted for sex, coronary disease, BMI and country of RRT initiation, were consistent with those of the main models (Supplementary data, Table S2).
The evaluation of the study primary outcome (patient and home dialysis technique survival) with transplantation as a competing outcome in competing risk regression model provided similar results to those obtained in the main Cox proportional hazards model (HHD only HR 0.98, 95% CI 0.54–1.78, P = 0.94; PD only HR 3.88, 95% CI 2.26–6.65, P < 0.001). Furthermore, transplantation occurrence was similar in the HHD group (HR 1.12, 95% CI 0.77–1.63; P = 0.57), but less likely in the PD only group (HR 0.37, 95% CI 0.23–0.60; P < 0.001). The assessment of mortality risk on home dialysis in the competing risk model yielded comparable results to those of the main model (Table 3). Competing risk regression cumulative subhazard curves are presented in Supplementary data, Figures S2 and S3.
Adjusted hazard ratio for primary and secondary outcomes in main and sensitivity models
| Modelsa | HHD only | PD only | ||||
|---|---|---|---|---|---|---|
| HR | 95% CI | P | HR | 95% CI | P | |
| Death and technique failure | ||||||
| Main modelb | 0.92 | 0.52–1.62 | 0.77 | 3.22 | 1.97–5.25 | <0.001 |
| Competing risk modelc | 0.98 | 0.54–1.78 | 0.94 | 3.88 | 2.26–6.65 | <0.001 |
| 180-day transitionb | 1.38 | 0.53–2.24 | 0.19 | 4.42 | 2.83–6.9 | <0.001 |
| Death on home dialysis | ||||||
| Main modelb | 0.77 | 0.34–1.72 | 0.52 | 2.44 | 1.19–4.99 | 0.01 |
| Competing risk modelc | 0.79 | 0.32–1.94 | 0.61 | 2.86 | 1.30–6.34 | 0.01 |
| 180-day transitionb | 1.33 | 0.64–2.79 | 0.45 | 4.96 | 2.03–8.14 | <0.001 |
Main and competing risk models, n = 84/168/168.
180-day transition model, n = 124/248/248.
aReference group: ‘PD + HHD’.
bCox proportional hazards with robust standard error.
cTransplantation as competing event.
The study primary and secondary outcomes were evaluated in models allowing for longer duration of facility HD between the times of PD discontinuation and HHD initiation. Overall, allowing for a <180-day transition (rather than a <90-day transition in our main model) gave similar results to those obtained in the main model (Table 3). Baseline characteristics of matched patients and survival curves from this sensitivity model are presented in Supplementary data, Table S1 and Figures S4 and S5.
Finally, evaluation of the entire cohort in a multivariable model incorporating home dialysis modality as a time-varying covariate led to comparable associations with an increase in death and technique failure among patients starting dialysis with PD (HR 3.45, 95% CI 2.92–4.08, P < 0.001), compared with HHD and a subsequent reduction of the risk at time of transfer from PD to HHD (HR 0.32, 95% CI 0.20–0.52, P < 0.001).
DISCUSSION
In this matched cohort study, incident RRT patients initially treated with PD followed by HHD had patient and home dialysis technique survival that was comparable to those treated with HHD as the only home dialysis modality and superior to those treated with PD as the only home dialysis modality. Similar results were obtained when only patient survival was evaluated.
Very little data have been published to date regarding patients treated successively with PD and HHD. The feasibility of a ‘PD-to-HHD’ transition was reported by Canadian and Japanese groups in small observational studies [28, 34, 35]. To the best of our knowledge, only one Canadian study specifically evaluated outcomes of patients treated with HHD after PD therapy. This investigation showed similar risk of death or technique failure in patients with and without previous PD (HR 1.15, 95% CI 0.51–2.59, P = 0.60) [30]. However, the results were limited by the inclusion of patients treated with PD at any given time before HHD initiation, the prevalent nature of the dialysis cohort and differences in transplantation history between patients with and without PD exposure. Furthermore, patients with PD exposure before HHD start had a much longer dialysis vintage than PD-naïve patients, leading to a potential immortal time bias.
In this study, the risk of immortal time bias was mitigated by the matching process taking the survival period between RRT initiation and matching time into account [33]. Furthermore, only incident patients with home dialysis on Day 90 after RRT initiation were included. Moreover, patients included in the ‘PD-HHD’ group were all initiated on home dialysis <90 days after PD completion, further limiting potential for immortal time bias.
Direct transition to HHD after PD completion (in <90 days) might require considerable planning and organization of the transfer prior to PD discontinuation, which could limit the generalization of the study results to PD patients experiencing sudden technique failure (for example, owing to severe acute peritonitis). Nonetheless, similar results were obtained in this study when the time between PD completion and HHD initiation was extended to up to 180 days, which should have been long enough to include most patients with unplanned transition to HHD after acute PD failure. It is, however, important to recognize that these data only include patients who were successfully transferred to HHD. It is possible that a larger number of patients might have been suitable HHD candidates, had they not lost interest in HHD after a prolonged facility HD period [36].
The initiation of dialysis with PD followed by HHD has been proposed as a strategy for providing optimal dialysis care that combines these complementary dialysis modalities in a way that maximizes their advantages and mitigates their disadvantages [4, 28, 30]. On the one hand, initiating patients on PD while they still have residual kidney function has been associated with better preservation of residual kidney function [13, 14], protection of potential vascular access and reduction in bacteraemia risk [15, 16], improved ability to provide incremental dialysis [17, 18], maintenance of lifestyle with a more flexible dialysis schedule [19, 20], reduced hepatitis virus transmission [21] and enhanced cost-effectiveness [8–10, 12]. On the other hand, long-term PD therapy is limited by high rates of technique failure, mostly related to infectious complications, but also to mechanical issues and changes in peritoneal membrane structure and function over time leading to impaired ultrafiltration and/or small solute clearance capacity [37–40]. In contrast, HHD has been associated with excellent long-term survival, with a 5-year patient and technique survival around 70–80% in recent observational studies [41–43]. HHD, however, requires a longer and more intensive training period compared with PD, which can be a limitation to its uptake. Vascular access complications and faster decline of residual kidney function may also be a concern in patients treated with HHD [44–46]. Hence, the combination of PD first with a timely transfer to HHD might allow the greatest benefits from the two modalities and extend overall home dialysis treatment. This study supports the benefits of an integrated home dialysis approach for patients commencing PD first. Although integrated home dialysis was not superior to an HHD first strategy with respect to the outcomes of patient survival and home dialysis technique survival in this study, further evaluation of other outcomes, such as dialysis access, infectious complications, residual renal function and health economic outcomes are warranted before drawing conclusions regarding the relative merits of these two home dialysis approaches.
This study has several strengths. The global cohort included all patients from Australia and New Zealand treated with home dialysis on Day 90 after RRT initiation. These two countries have among the highest home dialysis prevalence rates in the world and are renowned for their expertise in home dialysis. The study design based on propensity score-matched cohorts and including survival time since RRT initiation made it possible to address the complicated question of modality switch while limiting potential immortal time bias. Furthermore, the primary outcome was tested with different sensitivity models, which all generated similar results.
Several limitations should also be considered while interpreting these results. First and foremost is the potential for indication bias and residual confounding, given that, prior to matching, patients in the PD + HHD and HHD only groups were younger and healthier than those in the PD only groups. While the matching process was performed in an attempt to limit potential bias, it may not have accounted for all differences in characteristics between the groups. Indeed, factors, such as psychological and socioeconomic characteristics, social support and physician-related preferences, that were not recorded in the ANZDATA registry may have varied significantly between the study groups. Furthermore, variation in the burden of comorbidity during home dialysis therapy (but before matching time) could not be taken into account. Importantly, the registry nature of the study did not allow the inclusion of patients who intended to transit to HHD after PD completion, but were unable to do so, either because of medical complications, change of mind or death. Despite the matching process taking into account survival time since RRT initiation, patients in the study could still be considered ‘survivors’, and the study results could, therefore, have been potentially subjected to immortal time bias. It was also impossible to identify PD patients who were offered HHD at the time of PD technique failure but chose not to pursue this option, which would have represented an important comparator group. Finally, owing to the strict definition of direct transition to HHD (<90 days of facility HD after PD completion), only a small proportion of the global home dialysis cohort was included in the ‘PD-HHD’ transition group, which could have limited the generalizability of the study.
In conclusion, this study showed that initial treatment with PD followed by transition to HHD was associated with comparable clinical outcomes (both patient and home dialysis technique survival and patient survival only) to initial treatment with HHD. Both these home dialysis approaches were associated with a lower risk of patient death and home dialysis technique failure to treatment with PD as the only home dialysis modality. These findings support the ‘integrated home dialysis model’ where PD is offered as the initial dialysis modality. Future prospective studies are warranted to evaluate the impact of the ‘integrated home dialysis model’ on a broad range of outcomes (e.g. dialysis access, infectious complications, residual renal function, technique survival, patient survival, resource utilization and health economic outcomes), assess its implication for a larger population, identify the optimal timing of transition from PD to HHD and potentially increase global home dialysis therapy.
FUNDING
This study was supported by a Baxter Healthcare Clinical Evidence Council (CEC) research grant.
CONFLICT OF INTEREST STATEMENT
A.C.N.-F. is supported by a Baxter Healthcare Clinical Evidence Council (CEC) research grant and is a current recipient of a Fonds de la recherche du Québec en Santé scholarship. C.T.C. holds R Fraser Elliott Chair in Home Dialysis. Y.C. has previously received research grants from Fresenius Medical Care, and travel grants from Genzyme. D.W.J is a current recipient of a Queensland Government Health Research Fellowship and received consultancy fees, research grants, speakers' honoraria and travel sponsorships from Baxter and Fresenius Medical Care. N.B. has previously received research funds from Roche, travel grants from Roche, Amgen and Jansen Cilag, and speaking honoraria from Roche. C.H., E.P., P.A.C., K.R.P. and M.L. have no financial disclosure.
(.)
ACKNOWLEDGEMENTS
The authors gratefully acknowledge the substantial contribution of the entire Australia and New Zealand nephology community (physicians, surgeons, database managers, nurses, renal operators and patients) in providing information for and maintaining the ANZATA registry database.
REFERENCES


Comments