


Abstract
Hyperfiltration (HF) has been linked to the development of diabetic kidney disease (DKD), but the causative or predictive role of HF in the pathogenesis of DKD still remains unclear. To date, there have been no studies of HF in Indigenous Australians, a population with high rates of both diabetes and end-stage kidney disease. We aimed to compare the characteristics and frequency of HF in Indigenous Australians with and without type 2 diabetes.
Indigenous Australian participants, recruited across five pre-defined strata of health, diabetes status and kidney function, had a reference glomerular filtration rate (GFR) measured using plasma disappearance of iohexol [measured GFR(mGFR)] over 4 h. HF was defined in various ways: (i) mGFR > 144 mL/min/1.73 m2, which is mGFR > 1.96 × SD above the mean of the mGFR in non-diabetic participants with normal albuminuria and normal renal function (mGFR > 90 mL/min/1.73 m2); (ii) age-corrected mGFR (>144 mL/min/1.73 m2) to account for the effect of ageing on GFR in subjects over 40 years of age with cut-off 1 mL/min/1.73 m2 lower for every year; (iii) mGFR > 144 mL/min, without correction for body surface area or age, as well as (iv) mGFR > 125 mL/min/1.73 m2, without adjustment for age.
A total of 383 Indigenous participants, 125 with and 258 without diabetes, with mGFR > 90 mL/min/1.73 m2 were studied. The proportion of participants with HF was 7% using mGFR > 144 mL/min/1.73 m2, 11% using the age-adjusted definition, 19% using mGFR > 144 mL/min and 27% using mGFR > 125 mL/min/1.73 m2. Diabetes was more common in participants with HF (40–74%) compared with normofiltering participants (28–31%), regardless of the definition of HF.
HF exists in Indigenous Australians with and without diabetes. A greater proportion of participants had diabetes in HF group compared with normofiltration group. Long-term follow-up of this cohort is necessary to determine if HF plays a role in the development of DKD and non-DKD.
INTRODUCTION
Controversy exists regarding whether or not hyperfiltration (HF) is a maladaptive response that may contribute to the development of diabetic kidney disease (DKD) [1, 2]. Early studies in people with type 1 diabetes have suggested that marked glomerular HF may contribute to late glomerular damage in diabetic nephropathy [3]. Some [3–7] but not all [8, 9] studies in patients with type 1 diabetes have found that glomerular HF predicts the development of microalbuminuria. In patients with type 2 diabetes, the effect of HF on future decline in renal function remains unclear [10–13]. To date, no study has demonstrated that the state of HF predisposes to reaching chronic kidney disease stage 3 [glomerular filtration rate (GFR) < 60 mL/min/1.73 m2] compared with normofiltering persons [13, 14].
The pathophysiology of HF is incompletely understood [15]. HF at a whole kidney and/or at a glomerular level occurs not only in diabetes but in solitary or remnant kidneys, in obesity [16] and in various forms of acquired renal disease [15, 17] as well as in pre-diabetes [18]. Reduced nephron number has been reported in Indigenous Australians, which may further predispose to HF [19], although single glomerular HF is generally thought to occur as a compensatory mechanism in response to decreased renal function. Biopsy studies have shown that glomerulomegaly is common in Indigenous Australians with diabetes [20].
As well as having some of the highest rates of kidney disease in the world, Indigenous Australians commonly have other forms of kidney disease, in addition to DKD [20]. Although comprehensive population-based data for the national burden of chronic kidney disease among Indigenous Australians are not available [21], the rate of end-stage kidney disease for Indigenous Australians is more than six times as high as that for non-Indigenous Australians [22]. Despite this, there are no detailed studies of the occurrence and significance of HF in Indigenous Australians.
Currently, there is no consensus on a measured GFR (mGFR) cut-off that represents the state of HF [15]. In some studies, HF is defined as a GFR of >2 standard deviations above the mean of the ‘normal’ population. With a few exceptions [1], most studies have defined HF independently of age and have used cut-offs ranging from 125 to 140 mL/min/1.73 m2 [23]. The validity of using GFR normalized for body surface area (BSA) has also been questioned [24]; however, given that there is heterogeneity in the body habitus of Indigenous Australians with and without diabetes, using normalized GFR may be of particular relevance in this population.
The purpose of this cross-sectional study was therefore to compare the characteristics and frequency of HF in Indigenous Australians with and without type 2 diabetes.
MATERIALS AND METHODS
Indigenous Australians from different regions of Australia (Central Australia, Northern Territory, Queensland, Western Australia) were recruited to participate in this observational study. Detailed methods of the ‘eGFR study’ have previously been described [25]. Indigenous Australian participants were recruited across five pre-defined strata of health, diabetes status and kidney function between 2007 and 2011.
An Indigenous Australian was defined as a person who fulfilled the criteria according to the Australian National Census [26]. Participants who received dialysis, women who were pregnant or breastfeeding and those who had a history of allergy or adverse reaction to iodine-based contrast media were excluded from the study. Participants with chronic kidney disease or diabetes were recruited from primary care facilities and hospital specialist clinics.
The Human Research Ethics Committees (HRECs) of the joint Menzies School of Health Research—Northern Territory Department of Health HREC, including approval by the Aboriginal sub-committee; Central Australian HREC; Western Australian Aboriginal Health Information and Ethics Committee; Royal Perth Hospital Ethics Committee and Cairns and Hinterland Heath Services District HREC approved the study.
Measurement of reference GFR (mGFR)
Using iohexol clearance, GFR was measured in all participants. Non-isotopic iohexol was injected (5.445 mL including 0.445 mL of priming volume in the tubing of the butterfly cannula, 300 mg/mL ‘Omnipaque’) into an antecubital vein and flushed with 10 mL of normal saline. Venous blood samples were collected for measurement of iohexol at 120, 180 and 240 min post injection. Blood samples were refrigerated and centrifuged within 4 h and aliquoted for transportation on ice (or dry ice or liquid nitrogen ‘Biological Shipper’, CryoPak Series, Taylor-Wharton, AL, USA) in remote locations, for storage at −80°C freezer [25].
Iohexol was transported and measured by Austin Health, Melbourne, Australia using a validated high-performance liquid chromatography (HPLC) assay modified from Niculescu-Duvaz et al. [25, 27].
Definitions of HF
Several definitions of HF were used in the current study:
HF Definition 1 (mGFR 144 mL/min with BSA normalization): mGFR > 1.96 × SD above the mean of mGFR in non-diabetic participants with normal albuminuria and with normal renal function (i.e. mGFR > 90 mL/min/1.73 m2). This definition is equivalent to mGFR > 144 mL/min/1.73 m2. Participants were defined as normofiltering if mGFR is in the range of 90–144 mL/min/1.73 m2.
HF Definition 2 (mGFR 144 mL/min with BSA normalization and age adjustment): similar to Definition 1, except participants over the age of 40 were classified as hyperfiltering if mGFR > 144 – (age-40), i.e. the cut-off reduced progressively by 1 mL/min/1.73 m2 for every year after the age of 40. This is in accordance with a previous study that adjusted their definition according to the age-related decline of GFR in the normal US population as documented in the third National Health and Nutrition Examination Survey [1, 29].
HF Definition 3 (mGFR 144 mL/min without BSA normalization or age adjustment): HF = mGFR > 144 mL/min with normofiltering participants having mGFR 90–144 mL/min.
HF Definition 4 (mGFR = 125 mL/min with BSA normalization but no age adjustment): HF = mGFR > 125 mL/min/1.73 m2 with normofiltering participants having mGFR 90–125 mL/min/1.73 m2.
Measurement of enzymatic creatinine
Creatinine was measured at a central laboratory using the Roche enzymatic assay with traceability to isotope dilution mass spectrometry (Roche Diagnostics Australia, Castle Hill, NSW Australia) using samples collected 120 min following iohexol injection.
Measurement of baseline characteristics
Non-fasting lipids, HbA1c (120 min post iohexol) and a spot urine albumin:creatinine ratio (ACR) were measured by local pathology services [25].
Diabetes was defined as a self-reported diagnosis of diabetes or HbA1c ≥ 6.5% (48 mmol/mol) [30]. Microalbuminuria was defined as urine ACR ≥ 2.5 and ≤25 mg/mmol in men and ≥3.5 and ≤25 mg/mmol in women. Macroalbuminuria was defined as ACR > 25 mg/mmol. Albuminuria was defined as ACR ≥ 2.5 mg/mmol in men and ≥3.5 mg/mmol in women [31].
Statistical methods
For continuous characteristics, the Wilcoxon rank sum tests were used to detect the difference between ‘normofiltering’ and ‘hyperfiltering’ participants. For categorical characteristics, chi-squared tests were used.
RESULTS
In total, 654 Indigenous Australians were recruited to the study. Of these participants, 64 were excluded as they did not have mGFR, 13 were excluded because they were aged <18, 13 were excluded as they did not have measurements of enzymatic creatinine and 1 was excluded because diabetes status was not available.
The frequency distribution of mGFR in the remaining Indigenous Australians with or without diabetes is shown in Figure 1 . Participants with diabetes had a greater spread of mGFR than those without diabetes.

Frequency distribution of iohexol GFR (mGFR, n = 563) in Indigenous Australians with and without diabetes. Only participants with mGFR > 90 mL/min/1.73 m2 were classified as ‘normofiltering’ or ‘hyperfiltering’ according to three of the definitions.
Data from 383 participants (125 with and 258 without diabetes) with mGFR > 90 mL/min/1.73 m2 were used in order to compare those with ‘HF’ to those with ‘normofiltration’ using definitions of HF based on BSA-normalized mGFR (Table 1).
Physical characteristics of ‘normofiltering’ and ‘hyperfiltering’ Indigenous Australians according to Definition 1, where ‘normofiltering’ is defined as mGFR 90–144 mL/min/1.73 m2 and ‘hyperfiltering’ as mGFR > 144 mL/min/1.73 m2
| Normofiltering, N = 356 | Hyperfiltering, N = 27 | P | |
|---|---|---|---|
| Diabetes | 105 (29%) | 20 (74%) | <0.001 |
| HbA1c ([%]) | 5.9 (5.5–6.5) | 6.6 (5.9–8.4) | 0.002 |
| Age (years) | 39 (29–49) | 41 (33–46) | 0.8 |
| Female | 218 (61%) | 18 (67%) | 0.6 |
| Height (cm) | 167 (161–174) | 166 (161–173) | 0.6 |
| Weight (kg) | 82 (69–97) | 91 (80–110) | 0.007 |
| BMI (kg/m2) | 29 (25–34) | 34 (30–39) | <0.001 |
| Waist (cm) | 99 (88–110) | 111 (100–120) | <0.001 |
| Waist:hip ratio | 0.92 (0.85–0.99) | 0.98 (0.96–1.05) | <0.001 |
| Normoalbuminuria | 251 (73%) | 15 (56%) | 0.07 |
| Microalbuminuria | 55 (16%) | 9 (33%) | |
| Macroalbuminuria | 38 (11%) | 3 (11%) | |
| Current smoker | 172 (48%) | 15 (56%) | 0.5 |
| Enzymatic creatinine (umol/L) | 65 (55–77) | 51 (46–62) | <0.001 |
| Systolic blood pressure (mmHg) | 112 (104–124) | 119 (108–129) | 0.05 |
| Diastolic blood pressure (mmHg) | 73 (67–81) | 78 (73–82) | 0.03 |
Data are presented as medians (IQR) or n (%).
The median (interquartile range) BSA was 1.9 (1.7–2.1) m2. Data from 418 participants with mGFR > 90 mL/min were used in order to compare those with ‘HF’ to those with ‘normofiltration’ using definitions of HF based on non-normalized mGFR.
Using Definition 1 (mGFR > 144 mL/min/1.73 m2), only 7% of participants had HF (the rest had normofiltration). The prevalence of HF increased to 11% of participants using Definition 2 (mGFR > 144 mL/min/1.73 m2 with age adjustment), to 19% using Definition 3 (mGFR without BSA normalization or age adjustment) and to 27% using Definition 4 (mGFR > 125 mL/min/1.73 m2 without age adjustment).
There were a greater proportion of participants with diabetes in the hyperfiltering group, whichever definition was used. As shown in Table 2, 40–74% of hyperfiltering participants had diabetes, whereas 28–31% of normofiltering participants had diabetes.
The presence of diabetes in those with and without HF
| Definition of HF | Presence of diabetes in the normofiltering group | Presence of diabetes in the hyperfiltering group | P (normo versus hyper) |
|---|---|---|---|
| mGFR > 144 mL/min/1.73 m2 | 105 (29%) | 20 (74%) | <0.001 |
| mGFR > 144 mL/min/1.73 m2 age adjusted | 96 (28%) | 29 (69%) | <0.001 |
| mGFR > 144 mL/min, without BSA normalization or age adjustment | 106 (31%) | 37 (46%) | 0.02 |
| mGFR > 125 mL/min/1.73 m2 without age adjustment | 83 (30%) | 42 (40%) | 0.06 |
In each of the definitions of HF used, weight, body mass index (BMI), waist circumference and waist:hip ratio were consistently higher and enzymatic creatinine was lower in those with HF, and blood pressure was higher. The relationship between mGFR and BMI in participants with diabetes and without diabetes is demonstrated in Figure 2.
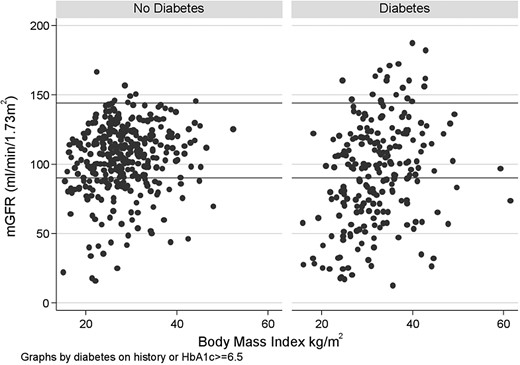
The relationship between mGFR and BMI in participants with diabetes and without diabetes.
In a main effects logistic regression model, we found that the odds ratio for HF using Definition 1 was 5.5 (P < 0.001) for diabetes, and the odds ratio was increased by 1.26 (P = 0.12) per 5 kg/m2 increase in BMI.
DISCUSSION
Given the high rates of kidney disease in Indigenous Australians and the possibility of early renal disease in Indigenous Australians both with and without diabetes, we examined the characteristics and frequency of HF among Indigenous Australians with or without diabetes. The major novel finding in this study was that HF was consistently present both with and without normalizing mGFR by BSA and the age-adjusted definition in Indigenous Australians. In Indigenous Australians with normal renal function, the prevalence of HF ranged from 7 to 27% depending on the definition of HF used. Furthermore, the HF group had more participants with diabetes than the normofiltering group, regardless of the definition used for HF.
The pathophysiological mechanisms which cause HF remain unclear [15]. In experimental models of renal mass reduction, where the afferent glomerular arterioles dilate more than efferent arterioles, raising not only GFR but also intra-glomerular pressure and filtration fraction [15, 32], glomerular HF occurs at the single nephron level and is associated with normal or reduced total GFR [15]. In diabetes mellitus, however, an absolute increase in both renal blood flow and GFR is observed, representing HF at the whole kidney level [15]. In studies of type 1 and type 2 diabetes, filtration fraction is increased indicating increased intra-glomerular hypertension [15, 33, 34]. In the current study, we did not measure renal blood flow and therefore could not assess filtration fraction. Furthermore, recent work suggests that changes in glomerular haemodynamic function in early type 1 diabetes are in a large part related to changes in afferent rather than efferent arterial tone [35].
In diabetes, it is unclear why afferent glomerular vasodilation occurs. However, increased levels of insulin, insulin-like growth factor 1, atrial natriuretic peptide, advanced glycation end products and increased intra-renal nitric oxide signalling may play a role [15]. Previous studies have suggested that an elevated GFR is correlated with poor glycaemic control [15, 36, 37]. Increased proximal tubular sodium reabsorption may be a trigger of HF in the setting of hyperglycaemia [38].
While there were a greater proportion of participants with diabetes in the HF group, there were also a group of patients who did not have diabetes but had HF with a tendency towards a greater frequency of albuminuria than those without diabetes and with normofiltration. Rates of albuminuria in Indigenous Australians with normal renal function, i.e. with a mGFR of >90 mL/min/1.73 m2, appear to be higher than non-Indigenous populations [39]. Furthermore, previous studies have demonstrated significant associations between HF and pre-diabetes or pre-hypertension [18, 40]. Moreover, HF in the non-diabetes group may also be related to obesity as previous studies have demonstrated a relationship between obesity and HF [16]. These findings suggest that there may be a continuum whereby HF +/− albuminuria may occur prior to the development of frank diabetes, preceding the decline in renal function in Indigenous Australians.
A major influence on GFR is the normal ageing process. The age-dependent decline in GFR may mask HF in early stages of diabetic nephropathy [1, 23]. Therefore, definitions of HF are also confounded by the ‘physiological’ decline in renal function that occurs with ageing [1, 23]. Renal blood flow and GFR progressively decline after the third decade, and values in the eighth decade are only one half to two-thirds of those measured in young adults [41]. Furthermore, morphologic studies demonstrate sclerosis of 10–30% of the total glomerular population between the fourth and eighth decades of life [41]. A minority of studies have adjusted for ageing [1]. Premaratne et al. reported a prevalence of HF of 7% when age-unadjusted and 17% when age-adjusted definitions were used [1]. We found that the proportion of those with HF was 7% when age-unadjusted and 11% with the age-adjusted definitions of HF.
In the current study, the participants were asked not to have a protein-based meal prior to their non-fasting blood test, which would have minimized the impact of dietary variations, that may have influenced serum creatinine levels [42]. Creatinine levels can also be affected by drugs, including the commencement of angiotensin-converting enzyme inhibitors; however, no specific medication changes were made before participation in this study [42].
In the current study, we mGFR using iohexol and examined the presence of HF using varying definitions following adjustments for both the BSA and the age of the participants. GFR has been indexed for BSA using the 1.73 m2 factor since 1928 [24, 43]. A historical review of the use of the BSA determination reveals a number of problems, as does the choice of 1.73 m2 as the normal BSA for humans [44]. Some suggest that correction for a standard BSA of 1.73 m2 is essentially arbitrary; however, it should still be retained in order to permit international and historical comparisons [44]. Indexing is intended to remove inter-individual variation attributable to differences in body size [45]. Indexing GFR for BSA has limited consequences on GFR results in a ‘normal’-size population, but its consequences are substantial in other populations such as obese or malnourished patients [24]. Due to the differences in body habitus in Indigenous Australians, compared with Australians of European background [46] with and without diabetes, we examined this in more detail.
In previous studies of Pima Indians, with a mean BMI over 30 kg/m2, when GFR was indexed to BSA, HF was not more prevalent in those with diabetes than in those without diabetes [14, 47]. In contrast, in the current study with a greater number of participants, we found that a greater proportion of Indigenous Australians with HF had diabetes, with and without age and BSA corrections. Given that obesity has been associated with HF [15], it is therefore of interest to note that HF was more frequent in people with diabetes than those without diabetes even without the BSA correction for mGFR. However, BMI was consistently higher in hyperfiltering participants with diabetes compared with hyperfiltering participants without diabetes, regardless of the definition of HF used. In previous studies of obesity, HF was not present when indexed for BSA [15]. A study in obese individuals with renal impairment demonstrated that indexation of mGFR with BSA using ideal body weight gives less bias than mGFR scaled with BSA using real body weight [48].
We have previously assessed whether incorporating a fat-free mass (FFM) estimate or other anthropometric measurements into the prediction equation would significantly improve GFR estimation in Indigenous Australians [49]. In that analysis, we demonstrated that the addition of weight to the established inputs of age, sex and serum creatinine slightly enhanced eGFR equation performance (particularly at low body weight); however, inclusion of body composition, height, or waist or hip circumference gave negligible further benefit [49].
As the onset of hyperglycaemia is short lived prior to the diagnosis of type 1 diabetes, it is easier to study HF in people with type 1 diabetes as the duration of diabetes is defined. An issue regarding the existence of HF in people with type 2 diabetes is related to the fact that the onset of the condition is insidious. Therefore, those with new onset of type 2 diabetes may have HF earlier in the course of their disease, but this may be difficult to detect in the absence of knowledge of diabetes status.
Another difficulty in studying HF in type 2 diabetes is that coexistence of non-DKD is more common and generally patients with type 2 diabetes are more diverse and are older [1]. Recent studies have challenged the concept that most Indigenous renal disease is due to diabetes [20]. A review of 643 renal biopsies in Indigenous Australians revealed the presence of glomerulomegaly and much heterogeneity in renal biopsies [20]. In previous smaller studies of Indigenous Australians and non-Indigenous Australians undergoing forensic autopsy for sudden or unexpected death Northern Territory, Australia, it was shown that Indigenous Australians have ∼30% fewer glomeruli than non-Indigenous Australians [19]. However, the mean glomerular volume was 27% larger in one study [19]. In that study, glomerular number significantly correlated with adult height, inferring a relationship with birth weight, which, on average, is much lower in Aboriginal than non-Aboriginal Australians [19]. However, longitudinal studies have not demonstrated an increased risk of developing diabetes in Aboriginal Australians with low birth weight [50].
Although this is an observational, therefore, association study and cause and effect cannot be defined, compensatory glomerular hypertrophy in people with fewer nephrons, while minimizing loss of total filtering surface area, may be exacerbating nephron loss [19]. Uninephrectomy increases renal blood flow and GFR rates by ∼40% in the remnant kidney and leads to moderate acceleration of glomerular sclerosis [41]. Micropuncture studies have shown that these increases in remnant kidney function are due to renal arteriolar vasodilatation, which causes elevations in the flow and pressures in the capillaries of the remnant glomeruli [41]. High rates of HF in those without diabetes may also be secondary to other factors including low birth weight and multiple infections.
It is controversial whether or not HF in the long term is a maladaptive response in the development and progression to end-stage kidney disease. In a study of 426 participants with type 1 diabetes followed for 15 years, GFR was estimated by serum cystatin C, and HF was defined as exceeding the 97.5th percentile of the sex-specific distribution of similarly aged non-diabetic population (134 for men and 149 for women) [51]. Renal HF was present in 24% of the study group using sex-specific cut-off values for HF but did not increase the risk of developing microalbuminuria [51]. However, GFR was not measured in the study by Ficocello et al. nor in the Finn-Dianne Study. The CKD-EPI formula has a high degree of bias (mGFR-estimated GFR) in people with diabetes above 90 mL/min/1.73 m2. According to the CKD-EPI investigators, the bias of the CKD-EPI equation could be as large as 20 mL/min/1.73 m2 when the estimated GFR is 120 mL/min/1.73 m2 [52].
We recognize the limitations of the current study. It is cross sectional and is not truly population based. Recruitment included those with diabetes or microalbuminuria and eGFR > 90 mL/min/1.73 m2; thus, rates of HF may be higher. Additionally, participants with diabetes may have progressed beyond the HF stage, and ‘normal’ renal function may occur during the progression from HF to reduced renal function. Furthermore, a dichotomous variable for the presence of diabetes (defined by a cut-point of >6.5%) was used, whereas ideally HbA1c measurements used as a continuous variable would have been preferred. Moreover, the association between short stature and renal disease has previously been hypothesized to reflect a decreased number of nephrons [53]. Although we demonstrated a higher rate of HF when we did not correct for BSA, it is important to note that not only obese but also taller persons have a greater BSA [54]. By not correcting for BSA, these taller, not necessarily obese, people are classified together with hyperfiltering obese people. However, tall persons may have more nephrons at birth and therefore may have a higher GFR. This may lead to misclassification, indicated by lower odds of diabetes and microalbuminuria in the ‘HF’ group when Definition 3 is used. Furthermore, the urinary clearance method for determination of GFR is the gold standard, and the plasma clearance method was developed, in part, as a means of simplifying the measurement of the GFR [55]. Calculation of GFR by plasma clearance involves various mathematical assumptions, which depend in part on the tracer used and the number of plasma samples taken [28, 56]. Some studies have demonstrated that the plasma clearance may not replicate the urinary clearance method [57]. However, other studies have demonstrated very similar results obtained when the plasma clearance method is used and compared with the urinary clearance method [57, 58]. Regardless, this bias may be minimized by appropriate corrections such as the Brochner-Mortensen equation as used in this study [59]. One of the limitations of the current study is that the urinary clearance method for determination of GFR was not feasible.
In the current study, we have reported the presence of HF in Indigenous Australians with and without diabetes using several definitions of HF. HF tended to have a greater proportion of participants with diabetes compared with normofiltration, regardless of the definition of HF. Long-term follow-up of this cohort is necessary to determine if HF plays a role in the development of DKD or non-DKD. Further understanding of the mechanisms underlying HF may be important in the development of novel approaches to prevent end-stage kidney disease.
ACKNOWLEDGEMENTS
The eGFR study was funded by the National Health and Medical Research Council of Australia (NHMRC, Project Grant 545202). The views expressed are those of the authors and do not reflect the views of NHMRC. Additional support was obtained from Kidney Health Australia, NHMRC 320860, the Colonial Foundation, Diabetes Australia Research Trust, Rebecca L Cooper Foundation and SeaSwift, Thursday Island. L.M.B. is supported by an Australian NHMRC Early Career Fellowship in Aboriginal and Torres Strait Islander Health Research (605837). E.I.E. is supported by an NHMRC Early Career Fellowship: Health Professional Research Fellowship (part time, 1054312). J.H. is supported by NHMRC Scholarship 490348, Rio Tinto Aboriginal Fund and the Centre of Clinical Research Excellence in Clinical Science of Diabetes, University of Melbourne. P.L. is supported by NHMRC Scholarship 1038529. A.C. holds a NHMRC Principal Research Fellowship 1027204, and W.E.H. holds an NHMRC Australia Fellowship 511081. Funding bodies had no role in the study design; in the collection, analysis or interpretation of data; in the writing of the manuscript or the decision to submit the manuscript for publication.
CONFLICT OF INTEREST STATEMENT
None declared. The results presented in this article have not been published previously in whole or part, except in abstract format.


Comments