


Abstract
Optimal treatment for secondary hyperparathyroidism (SHPT) has not been defined. The IMPACT SHPT (ClinicalTrials.gov identifier: NCT00977080) study assessed whether dose-titrated paricalcitol plus supplemental cinacalcet only for hypercalcaemia is superior to cinacalcet plus low-dose vitamin D in controlling intact parathyroid hormone (iPTH) levels in patients with SHPT on haemodialysis.
In this 28-week, multicentre, open-label Phase 4 study, participants were randomly selected to receive paricalcitol or cinacalcet plus low-dose vitamin D. Randomization and analyses were stratified by mode of paricalcitol administration [intravenous (IV) or oral]. The primary efficacy end point was the proportion of subjects who achieved a mean iPTH value of 150–300 pg/mL during Weeks 21–28.
Of 272 subjects randomized, 268 received one or more dose of study drug; 101 in the IV and 110 in the oral stratum with two or more values during Weeks 21–28 were included in the primary analysis. In the IV stratum, 57.7% of subjects in the paricalcitol versus 32.7% in the cinacalcet group (P = 0.016) achieved the primary end point. In the oral stratum, the corresponding proportions of subjects were 54.4% for paricalcitol and 43.4% for cinacalcet (P = 0.260). Cochran–Mantel–Haenszel analysis, controlling for stratum, revealed overall superiority of paricalcitol (56.0%) over cinacalcet (38.2%; P = 0.010) in achieving iPTH 150–300 pg/mL during Weeks 21–28. Hypercalcaemia occurred in 4 (7.7%) and 0 (0%) of paricalcitol-treated subjects in the IV and oral strata, respectively. Hypocalcaemia occurred in 46.9% and 54.7% of cinacalcet-treated subjects in the IV and oral strata, respectively.
Paricalcitol versus cinacalcet plus low-dose vitamin D provided superior control of iPTH, with low incidence of hypercalcaemia.
Introduction
Secondary hyperparathyroidism (SHPT), a complication of chronic kidney disease (CKD), is characterized by increased serum levels of intact parathyroid hormone (iPTH), which may cause skeletal and cardiovascular complications [1–3]. Uncontrolled SHPT is associated with increased mortality in end-stage kidney disease [4–6] as well as in earlier stages of CKD [7].
Deficiency of calcitriol (1,25-hydroxy vitamin D) caused by impaired renal function, a main factor in the pathogenesis and pathophysiology of SHPT [8], is associated with poor outcomes in haemodialysis patients [9]. Therapy with vitamin D receptor (VDR) activators, including calcitriol or the selective VDR activator paricalcitol [4, 10–12], has been associated with improved survival in patients with CKD on haemodialysis [13–16]. Evidence from epidemiological studies further suggests that the causes for the survival benefit from VDR activator therapy go beyond the control of iPTH and calcium–phosphorus homoeostasis [10, 11, 13]. Consequently, VDR activators, including paricalcitol [17], have become a commonly used therapy in patients with SHPT on dialysis. A potential complication of vitamin D replacement therapy, especially at high doses, is the increased risk of hypercalcaemia. However, paricalcitol, which has a small effect on calcium absorption compared with the non-selective VDR activator calcitriol [18], is associated with a low risk of hypercalcaemia in haemodialysis patients [19, 20] and is also associated with a significantly greater survival benefit than calcitriol in haemodialysis patients [12]; however, these results need to be confirmed in a randomized prospective trial. A number of retrospective studies further suggest that higher dosing, adjusting for iPTH levels and additional risk factors, may maximize the survival benefit associated with paricalcitol [11, 21]. Additional studies are needed to confirm these results.
An alternative approach to the treatment of SHPT in patients on haemodialysis is the use of cinacalcet [17], an allosteric modulator of calcium-sensing receptors that control PTH secretion. Cinacalcet has been shown to lower PTH levels and improve calcium–phosphorus homoeostasis in haemodialysis patients with uncontrolled SHPT [22]. Results of a large observational study of haemodialysis subjects who responded to cinacalcet treatment showed that treatment with cinacalcet was associated with significant reductions in all-cause and cardiovascular mortality rates [23]. The results of two recent clinical studies further suggest that combination therapy with cinacalcet and low-dose vitamin D may provide effective control of iPTH levels in patients with SHPT on dialysis while minimizing the risk of hypercalcaemia [24, 25].
A previous study comparing the effectiveness of flexible-dose vitamin D alone and cinacalcet-based therapy in achieving bone mineral targets recommended by the 2003 National Kidney Foundation Kidney Disease Outcomes Quality Initiative (KDOQI) guidelines in patients with SHPT on dialysis found no significant difference between the two treatments for the primary end point [25]. However, a direct comparison of the effectiveness of paricalcitol- and cinacalcet-based therapy in providing optimal management of SHPT in this patient population was not performed. This study, Improved Management of iPTH with Paricalcitol-centered Therapy versus Cinacalcet Therapy with Low-dose Vitamin D in Hemodialysis Patients with Secondary Hyperparathyroidism (IMPACT SHPT), is an international, multicentre, randomized controlled trial that was designed to determine whether optimal dose titration of paricalcitol, with supplemental cinacalcet for possible hypercalcaemia only, is superior to the combination of cinacalcet and low-dose vitamin D in controlling iPTH in patients with SHPT requiring dialysis [26]. Here, we report the primary results of the study.
Materials and methods
Study design and participants
IMPACT SHPT was a 28-week, multicentre, randomized, open-label Phase 4 study (ClinicalTrials.gov identifier: NCT00977080). Study design, eligibility criteria and patients' baseline characteristics have been described in detail previously [26]. Randomization and analyses were stratified according to the mode of paricalcitol administration [intravenous (IV) at USA and Russian sites (IV stratum); oral at non-USA and non-Russian sites (oral stratum)], as previously described [26]. The mode of paricalcitol administration (IV or oral) was based on regional differences in the clinical practice of VDR activator use. In brief, patients with SHPT on haemodialysis were screened and, if eligible, underwent a 4-week washout period during which they discontinued prior VDR activator and cinacalcet therapy. Following washout, patients were re-evaluated and eligible patients were randomized to paricalcitol or cinacalcet plus low-dose vitamin D treatment. Those randomized to paricalcitol received IV or oral paricalcitol according to stratum, with supplemental cinacalcet administered if serum calcium was ≥10.5 mg/dL (2.61 mmol/L) in two consecutive blood tests in the presence of high iPTH. Patients randomized to cinacalcet received cinacalcet plus IV doxercalciferol 1.0 μg three times weekly (US sites) or cinacalcet plus oral alfacalcidol 0.25 μg/day (non-US sites). The primary efficacy end point was the proportion of subjects in each treatment group who achieved a mean iPTH value of 150–300 pg/mL during Weeks 21–28 (evaluation period) of the treatment period. Secondary analyses determined the proportions of participants who achieved ≥30 or ≥50% reduction from baseline in iPTH (secondary efficacy analysis) and of those who experienced hypocalcaemia [mean calcium < 8.4 mg/dL (2.09 mmol/L)] or hypercalcaemia [mean calcium > 10.5 mg/dL (2.61 mmol/L)] during Weeks 21–28. In addition, bone-specific alkaline phosphatase (BSAP) and alkaline phosphatase (AP) were measured to evaluate the differential treatment effects of paricalcitol and cinacalcet.
The multinational study was conducted at 89 sites in 12 countries in accordance with the protocol, International Conference on Harmonisation guidelines, applicable regulations and guidelines governing clinical study conduct and the ethical principles established in the Declaration of Helsinki. The protocol was approved by an institutional review board or an independent ethics committee at each study site. All participants provided written informed consent before the initiation of study procedures.
Statistical and analytical methods
All efficacy and safety analyses were based on the intent-to-treat population, defined as all randomized subjects who received one or more dose of study drug. All analyses were performed separately for the IV and oral strata. A two-sided significance level of 0.050 was applied for the evaluation of treatment effects. Primary and secondary efficacy analyses and the analysis of hyper- and hypocalcaemia included only subjects with two or more relevant values during the evaluation period (Week 21–28). Proportions of subjects were compared using Fisher's exact test. Cochran–Mantel–Haenszel test was used to evaluate treatment group differences in the proportion of subjects achieving a mean iPTH value of 150–300 pg/mL during Weeks 21–28, controlling for stratum. Changes from baseline to the last observation between treatment groups were evaluated by analysis of covariance. Within group changes from baseline in AP and BSAP were analysed by Wilcoxon signed rank test. Adverse events were summarized by descriptive statistics; differences between treatment groups were analysed by Fisher's exact test.
Analytical assays included IMMULITE® chemiluminescent assay system (Siemens, Deerfield, IL) with a linear range of 3−2500 pg/mL for iPTH and enzymatic hydrolysis of p-nitrophenyl phosphate (Roche Diagnostics, Indianapolis, IN) for AP and immune capture of BSAP with selective high-affinity antibodies (Microvue™ BAP EIA kit; Quidel Corporation, San Diego, CA).
Results
Subjects
Of 746 patients screened, 168 did not meet eligibility criteria at screening and 306 did not meet eligibility criteria after subsequent washout (Figure 1) for reasons that have been described [26].
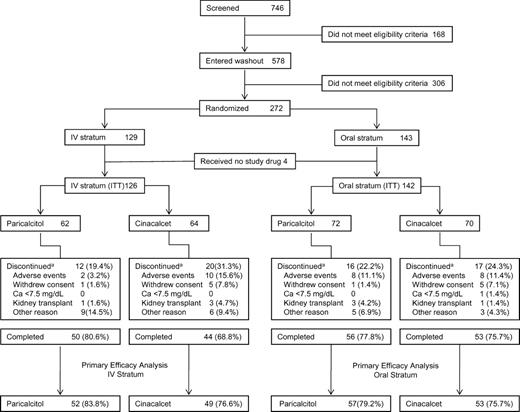
Patient disposition. aSome subjects discontinued for multiple reasons. ITT, intent-to-treat.
Of 272 patients randomized, 268 received one or more dose of study drug and were included in the intent-to-treat population. Of those, 101 in the IV stratum and 110 in the oral stratum had two or more iPTH values in the evaluation period (Weeks 21−28) and thus were included in the primary efficacy analysis (Figure 1). Across the IV and oral strata, discontinuation rates were lowest in the IV paricalcitol group (19.4%) and highest in the cinacalcet group of the IV stratum (31.3%), largely because of the difference in discontinuations due to adverse events (paricalcitol, 3.2% versus cinacalcet, 15.6%; P = 0.030; Figure 1). Age, gender distribution and duration of dialysis were similar across treatment groups and strata (Table 1). Among co-morbidities, Type I diabetes was numerically but not statistically significantly greater in the IV paricalcitol group (9.7%) than in the corresponding cinacalcet group (1.6%) and Type II diabetes was significantly more prevalent with oral paricalcitol (38.9%) than cinacalcet in the oral stratum (12.9%; P < 0.05). In both strata, proportions of subjects with cardiovascular co-morbidities were higher among those assigned to paricalcitol than those assigned to cinacalcet, including a significant difference for left ventricular hypertrophy in the IV stratum (Table 1). Differences in baseline values across strata and treatment groups were also observed for blood pressure and some laboratory parameters (Table 1).
Demographic and baseline characteristics by stratum and treatment group and concomitant medicationsa
| IV stratum | Oral stratum | |||
|---|---|---|---|---|
| Characteristics | Paricalcitol (n = 62) | Cinacalcet (n = 64) | Paricalcitol (n = 72) | Cinacalcet (n = 70) |
| Age, years, mean ± SD | 61.2 ± 12.7 | 59.9 ± 12.0 | 65.7 ± 13.5 | 65.1 ± 12.5 |
| Male, n (%) | 38 (61.3) | 38 (59.4) | 49 (68.1) | 43 (61.4) |
| Diabetes, n (%) | ||||
| Type 1 | 6 (9.7) | 1 (1.6)b | 1 (1.4) | 2 (2.9) |
| Type 2 | 37 (59.7) | 34 (53.1) | 28 (38.9)b | 9 (12.9)b |
| Cardiovascular disease, n (%) | ||||
| Angina | 8 (12.9) | 2 (3.1) | 11 (15.3) | 7 (10.0) |
| Myocardial infarction | 12 (19.4) | 8 (12.5) | 10 (13.9) | 8 (11.4) |
| Coronary artery disease | 25 (40.3) | 19 (29.7) | 11 (15.3) | 6 (8.6) |
| Left ventricular hypertrophy | 12 (19.4)b | 4 (6.3)b | 7 (9.7) | 6 (8.6) |
| Duration of dialysis, years, mean ± SD | 4.0 ± 3.6c | 4.1 ± 4.5c | 3.8 ± 3.4 | 4.0 ± 3.0 |
| Blood pressure, mean ± SD | ||||
| Systolic, mmHg | 140.8 ± 25.3 | 148.6 ± 24.4 | 138.3 ± 20.0 | 134.6 ± 21.9 |
| Diastolic, mmHg | 72.1 ± 12.4b | 77.4 ± 13.7b | 70.5 ± 13.0 | 73.3 ± 14.4 |
| Concomitant medications, n (%) | ||||
| ACE inhibitors | 24 (38.7) | 22 (34.4) | 15 (20.8) | 14 (20.0) |
| Angiotensin II receptor blockers | 11 (17.7) | 12 (18.8) | 12 (16.7) | 11 (15.7) |
| Beta blockers | 44 (71.0) | 39 (60.9) | 30 (41.7) | 26 (37.1) |
| Calcium channel blockers | 30 (48.4) | 29 (45.3) | 22 (30.6) | 24 (34.3) |
| Diuretics | 17 (27.4) | 13 (20.3) | 17 (23.6) | 24 (34.3) |
| Erythropoiesis-stimulating agents | 50 (80.6) | 47 (73.4) | 54 (75.0) | 58 (82.9) |
| Concomitant Phosphate binders, n (%) | ||||
| Calcium containing | 27 (43.5) | 44 (68.8) | 34 (47.2) | 44 (62.9) |
| Non-calcium containing | 40 (64.5) | 43 (67.2) | 52 (72.2) | 38 (54.3) |
| Laboratory values, mean ± SD | ||||
| Serum iPTH, pg/mL | 526.3 ± 153.1 | 521.1 ± 149.2 | 494.8 ± 170.3 | 509.5 ±138.5 |
| Corrected calcium, mg/dL | 9.0 ± 0.6 | 9.0 ± 0.7 | 9.0 ± 0.6 | 9.0 ± 0.7 |
| Phosphorus, mg/dL | 4.9 ± 1.1 | 4.9 ± 1.1 | 4.9 ± 1.1 | 4.4 ± 1.1 |
| AP, IU/L | 111.2 ± 49.4 | 123.8 ± 51.2 | 100.1 ± 38.5 | 105.7 ± 45.3 |
| BSAP, U/L | 36.6 ± 15.8 | 41.3 ± 25.4 | 40.8 ± 20.2 | 47.6 ± 32.5 |
| 25-hydroxy vitamin D, ng/mL | 22.1 ± 13.3 | 23.2 ± 10.9 | 15.6 ± 8.8 | 17.1 ± 8.9 |
| Creatinine, mg/dL | 8.2 ± 2.4 | 8.6 ± 2.5 | 8.9 ± 2.6 | 8.4 ± 2.6 |
| Albumin, g/dL | 4.0 ± 0.3 | 4.0 ± 0.3 | 4.1 ± 0.3 | 4.1 ± 0.3 |
aACE, angiotensin-converting enzyme inhibitors.
bP < 0.05 for group comparison within stratum.
cData available in 61 subjects.
Dosing of study medications
Mean doses of paricalcitol and cinacalcet used during the study generally were higher in the IV than in the oral stratum. On average, subjects treated with oral paricalcitol received dose reductions over the course of the study, resulting in doses (mean ± SD) of 3.5 ± 3.5 μg during the evaluation period (Weeks 21–28). In contrast, doses of IV paricalcitol during the evaluation period were 5.5 ± 3.7 μg. Mean cinacalcet doses were higher in the IV (61.6 ± 44.8 mg) than in the oral stratum (31.8 ± 28.7 mg) during the evaluation period.
Control of iPTH
Mean iPTH values during the study by stratum and treatment group are shown in Figure 2. The primary efficacy analysis showed that in the IV stratum, the proportion of subjects who had iPTH values of 150–300 pg/mL during Weeks 21–28 was significantly greater in the paricalcitol (57.7%) than that in the cinacalcet group (32.7%, P = 0.016; Figure 3A). In the oral stratum, the proportion of subjects who achieved the primary end point was also greater in the paricalcitol (54.4%) than in the cinacalcet group (43.4%), but the difference was not statistically significant (P = 0.260) (Figure 3A). Controlling for stratum, Cochran–Mantel–Haenszel analysis of the primary end point showed that the proportion of subjects treated with paricalcitol who achieved iPTH 150–300 pg/mL during Weeks 21–28 was significantly greater (56.0%) than the corresponding proportion in the cinacalcet arm (38.2%; P = 0.010; Figure 3B). In the IV stratum, significantly greater proportions of subjects in the paricalcitol versus the cinacalcet group achieved ≥30 and ≥50% reductions from baseline in mean iPTH during Weeks 21−28 (P < 0.001; Figure 4). In the IV stratum, mean iPTH reduction from baseline to the last observation during the evaluation period was −244.2 pg/mL with paricalcitol but only −78.4 pg/mL with cinacalcet (Table 2). Overall, 10 subjects treated with paricalcitol (five in each stratum) received cinacalcet for hypercalcaemia during the study period; of those, only eight subjects (three in the IV and all five in the oral stratum) reached the evaluation period and were included in the primary analysis. To assess the potential confounding effect of concomitant cinacalcet use by paricalcitol-treated subjects on the results of the primary analysis, we conducted a sensitivity analysis in which these eight subjects were excluded. The results of the sensitivity analysis were consistent with those of the original unadjusted analysis. The proportion of subjects who achieved the primary end point in the IV stratum was significantly greater in the paricalcitol (59.2%) compared with the cinacalcet group (32.7%, P = 0.015), whereas in the oral stratum, 53.8% and 43.4% of subjects in the paricalcitol and cinacalcet groups, respectively, achieved the primary end point (P = 0.331). Moreover, in the sensitivity analysis, the Cochran–Mantel–Haenszel test controlling for strata still showed that a significantly greater proportion of subjects overall achieved the primary end point in the paricalcitol group (56.4%) compared with the cinacalcet group (38.2%; P = 0.010).
Change from baseline to final measurement in bone mineral disease markers by stratum and treatment group
| IV stratum | Oral stratum | |||
|---|---|---|---|---|
| Change from baseline to last measurement, mean ± SE | Paricalcitol | Cinacalcet | Paricalcitol | Cinacalcet |
| Serum iPTH (pg/mL) | n = 60, −244.2a ± 36.4 | n = 60, −78.4 ± 36.4 | n = 70, −216.3 ± 24.5 | n = 70, −150.3 ± 24.5 |
| AP (IU/L)b | n = 50, −19.1a ± 6.6 | n = 51, 30.5 ± 6.5 | n = 53, −15.7a ± 5.1 | n = 64, 5.4 ± 4.6 |
| BSAP (U/L)b | n = 50, −9.3a ± 3.6 | n = 50, 21.2 ± 3.6 | n = 54, −13.9a ± 2.6 | n = 61, 2.5 ± 2.5 |
| Corrected calcium (mg/dL) | n = 60, 0.5a ± 0.1 | n = 61, −0.7 ± 0.1 | n = 70, 0.3a ± 0.1 | n = 70, −0.7 ± 0.1 |
| Phosphorus (mg/dL) | n = 60, 0.2 ± 0.2 | n = 60, −0.2 ± 0.2 | n = 70, 0.7a ± 0.2 | n = 70, 0.2 ± 0.2 |
| Corrected calcium–phosphorus product (mg2/dL2) | n = 60, 4.1a ± 1.6 | n = 60, −5.0 ± 1.6 | n = 70, 7.9a ± 1.6 | n = 70, −1.8 ± 1.6 |
aP < 0.05 versus cinacalcet within stratum.
bLeast squares mean change from baseline.
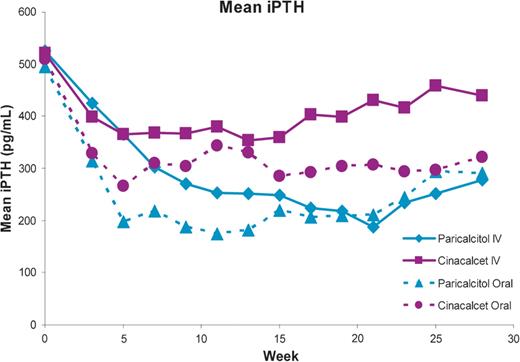
Mean iPTH during treatment by stratum (IV or oral) and treatment group.
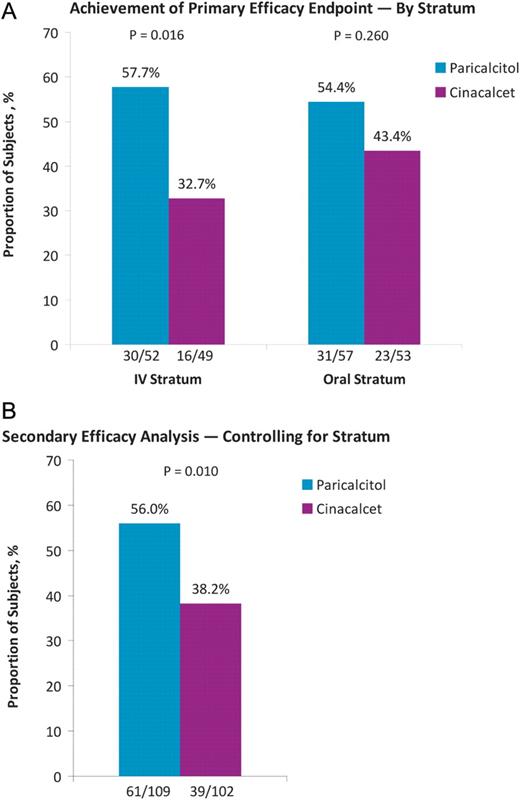
Proportions of subjects who achieved mean iPTH between 150 and 300 pg/mL during treatment weeks 21–28 in each stratum (A) and overall, based on Cochran–Mantel–Haenszel analysis controlling for stratum (B).
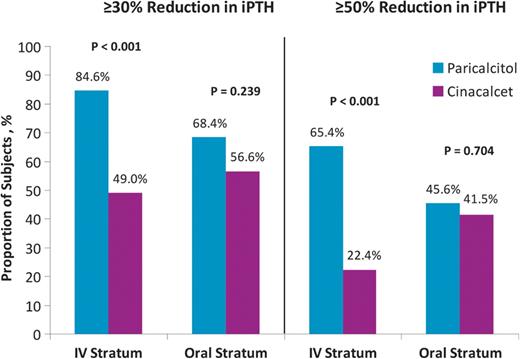
Proportions of subjects with ≥30 and ≥50% reduction from baseline in mean iPTH during Weeks 21–28.
Phosphate binder use
Phosphate binder use increased in both treatment groups in both strata over the duration of the study (Table 3). Overall, the percentage of subjects receiving phosphate binders increased from baseline to Week 28 from 59.7 to 88% in paricalcitol group, 71.9 to 93.3% in cinacalcet group of IV stratum and 66.7 to 87% in paricalcitol group and 60 to 88.2% in cinacalcet group of oral stratum, respectively. In subjects completing Week 28, use of calcium-containing phosphate binders was more common in subjects receiving cinacalcet compared with subjects receiving paricalcitol in both strata. In subjects completing Week 28, use of non-calcium-containing phosphate binders was greater in subjects receiving paricalcitol compared with subjects receiving cinacalcet in both strata (Table 3).
Phosphate binder use
| IV stratum | Oral stratum | |||
|---|---|---|---|---|
| Subjects, n/N (%) | Paricalcitol | Cinacalcet | Paricalcitol | Cinacalcet |
| Total phosphate binder use (calcium or non-calcium containing) | ||||
| Baseline | 37/62 (59.7) | 46/64 (71.9) | 48/72 (66.7) | 42/70 (60.0) |
| Week 15 | 45/53 (84.9) | 50/53 (94.3) | 51/60 (85.0) | 52/59 (88.1) |
| Week 28 | 44/50 (88.0) | 42/45 (93.3) | 47/54 (87.0) | 45/51 (88.2) |
| Phosphate binder use in subjects who completed Week 28 | ||||
| Calcium containing | ||||
| Baseline | 13/50 (26.0) | 20/45 (44.4) | 15/54 (27.8) | 11/51 (21.6) |
| Week 15 | 17/50 (34.0) | 31/45 (68.9) | 20/54 (37.0) | 32/51 (62.7) |
| Week 28 | 18/50 (36.0) | 32/45 (71.1) | 22/54 (40.7) | 31/51 (60.8) |
| Non-calcium containing | ||||
| Baseline | 18/50 (36.0) | 18/45 (40.0) | 25/54 (46.3) | 19/51 (37.3) |
| Week 15 | 29/50 (58.0) | 23/45 (51.1) | 36/54 (66.7) | 26/51 (51.0) |
| Week 28 | 30/50 (60.0) | 22/45 (48.9) | 37/54 (68.5) | 25/51 (49.0) |
Hyper- and hypocalcaemia
In both strata, paricalcitol was associated with an increase from baseline in calcium, whereas cinacalcet reduced calcium levels (Table 2). During the evaluation period, only two paricalcitol-treated subjects (both in the oral stratum) developed hypocalcaemia. In contrast, among cinacalcet-treated subjects, 46.9% in the IV stratum and 54.7% in the oral stratum developed hypocalcaemia (Figure 5). During the evaluation period, only four (7.7%) subjects developed hypercalcaemia with paricalcitol in the IV stratum and no subjects developed hypercalcaemia with paricalcitol in the oral stratum (Figure 5).
![Proportions of subjects with hypocalcaemia [mean calcium < 8.4 mg/dL (2.09 mmol/L)] and hypercalcaemia [mean calcium >10.5 mg/dL (2.63 mmol/L)] during the evaluation period.](https://oup.silverchair-cdn.com/oup/backfile/Content_public/Journal/ndt/27/8/10.1093_ndt_gfs018/3/m_gfs01805.jpeg?Expires=1750302515&Signature=2T1FjUCb0OJCHI06y0JJhDHw-WAvQQovFSEY33lSpcpasQoNl0DSnfsM6NcDLR1qXWCA0Y9RH9jf0LaorB3IS2jVZ0tWqf~MwdvsFCxn8lVB15mbXj6woDbYySEWkpJq2E-KH5buIhLYUtfBeyR5xMeMbeXMw2tm4ag6HvGRTvtiue-XVoqEfRAM8Fc1me-2f~O50ChjrpNDq-6Rt1-y3lRnCroFJwNsyCBuhXHIWd5xX9pbMRmf2ai1BeBTp9E7Hz-TUt74CRt-dzfNmecwdojAD5OeUELFAqGmxNnFRIrqf2DS2fEEFjplXjAFWhB3ZUYoQblHSOyV12U5Pei-Cg__&Key-Pair-Id=APKAIE5G5CRDK6RD3PGA)
Proportions of subjects with hypocalcaemia [mean calcium < 8.4 mg/dL (2.09 mmol/L)] and hypercalcaemia [mean calcium >10.5 mg/dL (2.63 mmol/L)] during the evaluation period.
Bone mineral and metabolic parameters
In both strata, levels of AP and BSAP decreased in the paricalcitol groups and increased in the cinacalcet groups (Table 2). Significant within group changes from baseline in AP and BSAP were observed only for both treatment groups in the IV stratum and for the paricalcitol group in the oral stratum (P < 0.001). The differences in effect on AP and BSAP between the paricalcitol and cinacalcet groups were statistically significant in both strata.
Adverse events
Most adverse event rates, including those for serious events, were not significantly different between paricalcitol and cinacalcet groups. However, in the IV stratum, adverse events leading to treatment discontinuation occurred significantly less often in the paricalcitol compared with the cinacalcet group (Table 4). The most common adverse events in the cinacalcet treatment groups that were related or probably related to study drug in the IV and oral strata, respectively, were hypocalcaemia (14.1 and 25.7%), nausea (7.8 and 5.7%) and vomiting (6.3 and 2.9%). The most common adverse events at least probably related to study drug in the paricalcitol treatment groups in the IV and oral strata, respectively, were hypercalcaemia (8.1 and 16.7%) and hyperphosphataemia (0 and 5.6%). However, major adverse cardiac events were more common in the paricalcitol group than in the cinacalcet group (Table 4).
Overview of treatment-emergent adverse events (AEs)a
| IV stratum | Oral stratum | |||
|---|---|---|---|---|
| Patients, n (%) | Paricalcitol (n = 62) | Cinacalcet (n = 64) | Paricalcitol (n = 72) | Cinacalcet (n = 70) |
| Any AE | 50 (80.6) | 54 (84.6) | 60 (83.3) | 54 (77.1) |
| Any AE at least possibly related | 8 (12.9) | 17 (26.6) | 24 (33.3) | 27 (38.6) |
| Any severe AE | 11 (17.7) | 15 (23.4) | 14 (19.4) | 8 (11.4) |
| Any serious AE | 22 (35.5) | 28 (43.8) | 22 (30.6) | 15 (21.4) |
| Any AE leading to discontinuation | 2 (3.2) | 10 (15.6)b | 8 (11.1) | 8 (11.4) |
| Any AE leading to interruption of study drug | 17 (27.4) | 17 (26.6) | 16 (22.2) | 18 (25.7) |
| Major adverse cardiac events | 6 (9.7)d | 2 (3.1) | 6 (8.3) | 1 (1.4) |
| Deaths | 1 (1.6) | 0 | 3 (4.2) | 0 |
| Treatment-emergent AEs leading to discontinuation (occurring in >3% of subjects) | ||||
| Nausea | 0 | 2 (3.1) | 0 | 3 (4.3) |
| Vomiting | 0 | 2 (3.1) | 0 | 1 (1.4) |
| Treatment-emergent AE possibly or probably related to treatment (occurring in >3% of subjects) | ||||
| Any AE | 8 (12.9) | 17 (26.6) | 24 (33.3) | 27 (38.6) |
| Constipation | 0 | 2 (2.9) | 0 | 2 (2.9) |
| Nausea | 0 | 5 (7.8) | 0 | 4 (5.7) |
| Vomiting | 0 | 4 (6.3) | 2 (2.8) | 2 (2.9) |
| Hypercalcaemia | 5 (8.1) | 0b | 12 (16.7) | 1 (1.4)c |
| Hyperphosphataemia | 0 | 0 | 4 (5.6) | 1 (1.4) |
| Hypocalcaemia | 0 | 9 (14.1)b | 0 | 18 (25.7)c |
| Muscle spasm | 0 | 2 (3.1) | 0 | 1 (1.4) |
aAEs are listed by MedDRA 14.0 preferred term. AE, adverse event.
bP < 0.05 versus IV paricalcitol.
cP < 0.05 vs Oral paricalcitol.
dOne subject had an event which was a peripheral dialysis arteriovenous graft occlusion, not a coronary artery or carotid artery graft occlusion.
Four subjects died, all from causes which were considered unrelated to treatment. One subject in the IV paricalcitol group died of cardiac arrest. The other three deaths, which occurred in the oral paricalcitol group, were due to myocardial infarction (n = 1), respiratory infection (n = 1) and pneumonia/cerebral infarction (n = 1). These deaths were unrelated to hypercalcaemia (range: 9.3–10.6 mg/dL).
Discussion
The results of this study suggest that a combination of dose-titrated paricalcitol and supplemental cinacalcet for hypercalcaemia in the presence of high iPTH is more effective than a combination of cinacalcet and low-dose vitamin D in achieving KDOQI-recommended target iPTH values. IV paricalcitol-based treatment was significantly more effective than cinacalcet-based treatment in achieving the target iPTH range. The difference between the proportions of subjects who achieved the target iPTH range with oral paricalcitol and with cinacalcet was numerically in favour of paricalcitol but not statistically significant. A pre-specified Cochran–Mantel–Haenszel analysis of the total primary analysis population, controlling for stratum, showed overall superiority of paricalcitol versus cinacalcet in achieving target iPTH levels. These results remained consistent when subjects who received cinacalcet in the paricalcitol arm were excluded from the analysis. Thus, the impact of paricalcitol on iPTH reduction was independent of concomitant cinacalcet use.
Similarly, secondary analyses revealed significantly higher proportions of subjects achieving iPTH reduction of ≥30 and ≥50% from baseline with IV paricalcitol compared with cinacalcet and higher proportions achieving these reductions with oral paricalcitol compared with cinacalcet. The lack of significant differences in treatment effects between paricalcitol and cinacalcet in the oral stratum may reflect, in part, differences in inherent subject characteristics across IV and oral strata. Doses of oral paricalcitol used during the evaluation period were substantially lower than corresponding IV paricalcitol doses.
Paricalcitol-based therapy was more effective in achieving optimal control of calcium than cinacalcet with concurrent low-dose vitamin D while keeping iPTH within target levels. Although cinacalcet-based therapy effectively prevented hypercalcaemia, more than half of the subjects in the cinacalcet arm (across strata) experienced hypocalcaemia during the evaluation period. In contrast, hypercalcaemia, a common side effect of non-selective VDR activators, occurred in only 7.7% of the subjects who received IV paricalcitol and did not occur in the oral paricalcitol group. These findings are consistent with those seen in previous randomized controlled studies of IV and oral paricalcitol in haemodialysis patients demonstrating effective iPTH reduction with no significant increase in the risk of hypercalcaemia when used within the specified dose ranges [19, 20]. Increased risk of hypocalcaemia with cinacalcet-based therapy previously was suggested by the results of a randomized controlled study showing that cinacalcet with concurrent low-dose vitamin D lowered calcium and was associated with a 7% rate of hypocalcaemia in patients with SHPT on dialysis [25]. To treat cinacalcet-induced hypocalcaemia in clinical practice, physicians may increase calcium supplementation through increased dietary intake, the use of calcium-containing phosphate binders or by incremental adjustment of dialysate calcium, all of which may increase calcium load.
A major complication of elevated iPTH in patients with CKD is renal osteodystrophy resulting from increased osteoclast activity and bone resorption [3, 27, 28]. AP and BSAP are important biomarkers of bone turnover in CKD-associated metabolic bone disease [3]. Elevated BSAP has been associated with increased cardiovascular morbidity and mortality in patients with CKD [29], and an increase in AP has been associated with increased all-cause mortality in haemodialysis patients [30]. Consistent with previous findings [20], the results of our study demonstrate that paricalcitol reduces BSAP and AP. In contrast, levels of AP and BSAP increased with cinacalcet in both strata.
The higher incidence of major adverse cardiac events in the paricalcitol compared with the cinacalcet groups across strata, including two deaths from cardiovascular causes, is most likely a reflection of the higher rate of cardiovascular co-morbidities in these groups at baseline. None of the four treatment-emergent deaths in the study were considered possibly or probably related to treatment.
This is the first multinational study to directly compare the use of cinacalcet with oral and IV formulations of the selective VDR activator, paricalcitol, with cinacalcet in the treatment of SHPT. The study had several limitations. In this multinational open-label study, a stratified study design was used to assess differences in the approved dosage form of paricalcitol. In addition, early discontinuations and the use of a fixed dosing algorithm based on biochemical criteria may affect the interpretation of the results. Since the study design required the iPTH at randomization to be 300–800 pg/mL, the results may only be applicable to patients with iPTH values in this range. Efficacy was assessed at only four study visits during the evaluation period, and the fact that efficacy parameters were bone mineral and metabolic biochemical markers rather than outcomes allows only an incomplete assessment of the risk–benefit profile of these interventions. Additional studies evaluating outcomes for bone disease interventions should be encouraged.
Conclusions
The results of IMPACT SHPT suggest that paricalcitol-based therapy with or without supplemental cinacalcet compared with the combination of cinacalcet and low-dose vitamin D provides superior reduction of iPTH to target levels with minimal effects on calcium in patients with SHPT requiring haemodialysis. Furthermore, long-term studies are needed to verify the impact of various SHPT treatment modalities on clinical outcomes.
Acknowledgments
Funding. The IMPACT SHPT study was funded by Abbott LaboratoriesInc. Writing and editorial assistance, funded by Abbott Laboratories Inc., was provided by Roland Tacke, PhD, Marsha Hall and Colleen Hedge of Scientific Connexions, Newtown, PA, USA.
Conflict of interest statement. The IMPACT SHPT study was funded by Abbott. M.K. has received honoraria for speaking and advisory tasks from Abbott, Amgen, Fresenius Medical Care, Genzyme, Medice and Shire and has received research funding from Abbott and Amgen. K.J.M. has been a consultant for Abbott, Cytochroma, Kai and Shire and a speaker for Abbott and Genzyme. M.C. has received honoraria from Abbott, Amgen, Shire, Genzyme and Roche. D.G. has received speaker fees from and has been a consultant for Abbott, Amgen, Novartis, Genzyme, Fresenius Medical Care and Shire. A.S. has been a consultant for Amgen, Genzyme and Abbott, has been a speaker for Amgen and Genzyme and has received research funding from Amgen. M.W. has served as a consultant or received honoraria from Abbott Laboratories, Amgen, Ardelyx, Baxter, Cytochroma, Genzyme, Lutipold, Mitsubishi and Shire. S.K., M.A. and S.M. are employees of Abbott and may own Abbott stock or options.


Comments