


Abstract
Background. The ADVANCE (A Randomized Study to Evaluate the Effects of Cinacalcet plus Low-Dose Vitamin D on Vascular Calcification in Subjects with Chronic Kidney Disease Receiving Haemodialysis) Study objective is to assess the effect of cinacalcet plus low-dose active vitamin D versus flexible dosing of active vitamin D on progression of coronary artery calcification (CAC) in haemodialysis patients. We report the ADVANCE Study design and baseline subject characteristics.
Methods. ADVANCE is a multinational, multicentre, randomized, open-label study. Adult haemodialysis patients with moderate to severe secondary hyperparathyroidism (intact parathyroid hormone [iPTH] >300 pg/mL or bio-intact PTH >160 pg/mL) and baseline CAC score ≥30 were stratified by CAC score (≥30–399, ≥400–999, ≥1000) and randomized in a 1:1 ratio to cinacalcet (30–180 mg/day) plus low-dose active vitamin D (cinacalcet group) or flexible dosing of active vitamin D alone (control). The study had three phases: screening, 20-week dose titration and 32-week follow-up. CAC scores obtained by cardiac computed tomography were determined at screening and weeks 28 and 52. The primary end point was percentage change in CAC score from baseline to Week 52.
Results. Subjects (n = 360) were randomized to cinacalcet or control. Mean age was 61.5 years, 43% were women, and median dialysis vintage was 36.7 months (range, 2.7–351.5 months). The baseline geometric mean CAC score by the Agatston method was 548.7 (95% confidence interval, 480.5–626.6). Baseline CAC score was independently associated with age, sex, dialysis vintage, diabetes and iPTH. Subjects also had extensive aortic and valvular calcification at baseline.
Conclusions. Subjects enrolled in ADVANCE have extensive CAC at baseline. The ADVANCE Study should help determine whether cinacalcet attenuates progression of vascular calcification.
Introduction
Vascular calcification is common among patients with chronic kidney disease [1,2] and may contribute to the elevated risk of mortality and cardiovascular events among patients receiving haemodialysis [3,4]. Although several factors are involved, disturbances in mineral metabolism in general, and elevated serum calcium and phosphorus concentrations in particular, are thought to be important determinants of vascular calcification [5–7]. These biochemical abnormalities can represent direct consequences of secondary hyperparathyroidism (sHPT) per se or may result from the therapeutic interventions used to control sHPT [7]. New approaches to clinical management designed to attenuate these risks may have the potential to modify the process of vascular calcification.
Results from several clinical trials indicate that therapeutic strategies using the calcimimetic agent cinacalcet hydrochloride effectively control plasma parathyroid hormone (PTH) concentrations among haemodialysis patients with sHPT and often maintain serum calcium and phosphorus concentrations within ranges recommended by various clinical practice guidelines [8–15]. However, it remains uncertain whether the use of cinacalcet results in measurable differences in the progression of vascular calcification compared with conventional therapy. Randomized controlled studies evaluating the effect of alternative treatments for sHPT on vascular calcification have not been previously performed.
Computed tomography (CT) is a reliable technique for detecting the presence and assessing the extent of vascular calcification [16,17]. Coronary artery calcification (CAC) scores among patients on haemodialysis are higher than those observed in persons of the same age and gender from the general population [2]. Moreover, CAC progresses more rapidly among patients on haemodialysis than among individuals with normal kidney function [1]. To date, we have yet to determine the exact mechanism(s) for accelerated vascular calcification and to what degree PTH, calcium and phosphorus metabolism play a role in the process. The objective of the ADVANCE (A Randomized Study to Evaluate the Effects of Cinacalcet Plus Low-Dose Vitamin D on Vascular Calcification in Subjects with Chronic Kidney Disease Receiving Haemodialysis) Study was to compare the progression of vascular calcification, as measured by multidetector CT (MDCT), in haemodialysis patients with sHPT treated with cinacalcet and low doses of vitamin D sterols to that observed in patients managed conventionally with varying, or flexible, doses of vitamin D sterols without cinacalcet. Herein, we present the overall design of ADVANCE and summarize baseline data from the study population.
Materials and methods
Study subjects
Adults, 18 years or older, who had been treated with haemodialysis for ≥3 months were eligible for study enrolment if plasma intact PTH (iPTH) concentrations were >300 pg/mL; if bio-intact PTH (biPTH) concentrations were >160 pg/mL; or if albumin-corrected values for the calcium–phosphorus product (Ca × P) were >50 mg2/dL2 while iPTH or biPTH concentrations were 150–300 or 80–160 pg/mL, respectively, during treatment with vitamin D sterols. Additional eligibility criteria included an albumin-corrected serum calcium ≥8.4 mg/dL and CAC score ≥30 at screening as measured by MDCT.
Subjects were excluded from the study if they had received cinacalcet previously or used calcium-free phosphate-binding agents such as sevelamer hydrochloride, lanthanum carbonate or aluminium hydroxide within 30 days of screening. Candidates were also excluded if they were receiving bisphosphonates or had begun treatment with, or required a change in dose of a 3-hydroxy-3-methylglutaryl-coenzyme A (HMG-CoA) reductase inhibitor or other cholesterol-lowering medication within 30 days of screening. Other key exclusion criteria included active atrial fibrillation, a history of coronary artery bypass grafting or coronary artery stent placement, aortic/cardiac valve replacement, cardiac transplantation, presence of ventricular pacemaker leads and thoracic aortic aneurysm. Subjects were also excluded from participation for the following reasons: parathyroidectomy within the previous 3 months, parathyroidectomy anticipated in the ensuing 6 months, specified scheduled date for kidney transplantation, body weight that exceeded the limits of the MDCT scanner (∼136 kg), digestive disorders that could interfere with the ability to swallow or absorb oral medications, known sensitivity to cinacalcet or an unstable medical condition during the 30 days before screening as determined by the investigator.
The study protocol and all study procedures were reviewed and approved by the appropriate ethics committee or independent review board at each study site. All participants gave written informed consent. The study was conducted according to principles of the Declaration of Helsinki, and it was registered at ClinicalTrials.gov (NCT00379899).
Study design
The ADVANCE trial was a multicentre, international, randomized, open-label clinical trial comprised of three phases: a screening phase of up to 45 days, a 20-week dose-titration phase and a 32-week follow-up phase (Figure 1). Eligibility was determined based on biochemical determinations and MDCT measurements of CAC during screening. Subjects were randomized in a 1:1 ratio to receive either cinacalcet (titrated to doses between 30 and 180 mg/day plus low doses of vitamin D sterols [cinacalcet group]) or flexible doses of vitamin D analogues alone (control group). Randomization of subjects to treatment was stratified based on CAC scores at screening with values of ≥30 to 399, ≥400 to 999, and ≥1000 in each of three strata.
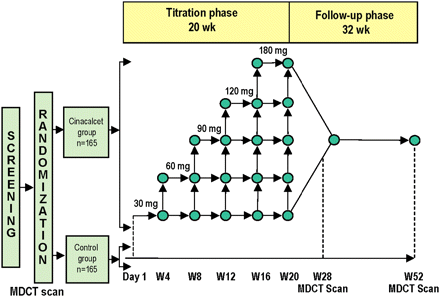
Study design and treatment schema. MDCT = multi-detector computed tomography.
Follow-up measurements of CAC were done at 26 and 52 weeks (Figure 1). Study participants used calcium-based phosphate binders exclusively to eliminate the potential confounding effects of alternative phosphate-binding strategies on vascular calcification [18–20].
Intervention
During the dose-titration phase of the study, treatment with cinacalcet was initiated at a dose of 30 mg/day. Subjects assigned to the cinacalcet group also received low doses of vitamin D sterols either intravenously as 0.5 μg calcitriol, 1 μg alfacalcidol, 1 μg doxercalciferol or 2 μg paricalcitol with each dialysis or orally as 0.25 μg calcitriol every other day or 0.25 μg alfacalcidol daily. Subjects receiving lower doses of vitamin D sterols or no vitamin D therapy at screening continued onto study without a change in dose. The dose of cinacalcet was increased sequentially to 60, 90, 120 or 180 mg/day at 4-week intervals if iPTH was >300 pg/mL or biPTH was >160 pg/mL, corrected serum calcium was ≥8.0 mg/dL, and the subject had no adverse event(s) that precluded a dose increase. The dose of cinacalcet was decreased if iPTH was <150 pg/mL or biPTH was <80 pg/mL, if the dose of vitamin D could not be reduced, if serum calcium was <7.5 mg/dL, if symptoms of hypocalcaemia developed with serum calcium ≥7.5 mg/dL or if an adverse event requiring a reduction in dose occurred. During the follow-up phase of the study, adjustments to the dose of cinacalcet were allowed every 8 weeks using the same criteria. In the event of hypercalcaemia or hyperphosphataemia in either treatment group, changes in active vitamin D or calcium-based phosphate binders, respectively, were considered in accordance with best treatment practice guidelines. The dialysate calcium concentration was to be maintained at a constant level throughout the study unless a change was necessary to ensure the subject's safety. It should be noted that because there are differences in dialysate calcium practice patterns among the participating countries in ADVANCE, dialysate calcium was not uniform across all study participants.
Subjects in the control group began the dose-titration phase of the study using the same dose of vitamin D prescribed before randomization. Doses were adjusted thereafter at the discretion of the investigator to manage iPTH or biPTH concentrations according to available treatment guidelines and local practice patterns. Doses of vitamin D were reduced if iPTH was <150 pg/mL or biPTH was <80 pg/mL.
Evaluation
Coronary artery calcification scores were determined by MDCT scans of the chest obtained at screening and within 4 weeks of scheduled study visits at weeks 28 and 52. After randomization, MDCT scans were not done if a scan had been completed within the previous 12 weeks. A 16-slice or higher MDCT scanner was used at each study site, and one technician at each site was designated as the primary study MDCT technician. All scans were read by a single investigator at a central location. The investigator was blinded to subject characteristics, study site and treatment assignment.
Calcification was assessed using two recognized methods of scoring. The data generated from the Agatston method (‘Agatston score’) [16] were used for the primary analysis as pre-specified by the protocol. Additional analyses based on the data generated from the volumetric scoring method (‘volume score’) [17,21] were also performed. For both techniques, we identified lesions with a density of >130 Hounsfield units (HU). For the Agatston score, a lesion area of ≥1 mm2 was multiplied by a density coefficient ranging from 1 to 4 based on the maximal MDCT attenuation within the lesion as follows: 1 = 130 to 199 HU, 2 = 200 to 299 HU, 3 = 300 to 399 HU and 4 ≥400 HU [16]. A partial score was calculated for each lesion, and the total CAC score was calculated by adding all of the scores together. For volumetric scoring, isotropic interpolation was used to calculate the total calcified volume within each coronary artery lesion. A calcium volume score for each lesion was calculated based on the total volume of the lesion with a density ≥130 HU. The total calcium volume score was determined by adding together all scores for all lesions [17]. The scoring of calcification within designated regions of interest for all scans was automated using image analysis software on a dedicated computer workstation (Picom, Sciimage, Palo Alto, CA). The same methods were used to quantify calcification in the thoracic aorta between the level of the aortic valve and diaphragm and in both the aortic and mitral valves of the heart.
Values for PTH, calcium, phosphorus and albumin were determined at screening and at weeks 2, 6, 10, 14, 18, 28, 36, 44 and 52 of study. Lipoprotein and C-reactive protein (CRP) concentrations were measured at Day 1 and at weeks 28 and 52.
Analysis plan
The primary study end point was the percentage change in CAC score from baseline to Week 52 as measured by the Agatston method. Secondary end points included absolute change in CAC score from baseline to Week 52; absolute and percentage change in calcification scores for the thoracic aorta, aortic valve and mitral valve from baseline to Week 52; the proportion of subjects with >15% progression of CAC from baseline to Week 52; absolute and percentage change in PTH, calcium, phosphorus and Ca × P from baseline to the end of study as assessed during weeks 44 to 52 of follow-up; and the safety of cinacalcet as measured by the type, frequency and severity of adverse events and their reported relationship to treatment.
The current manuscript presents the study design as well as the baseline characteristics of the study population, including CAC scores and cross-sectional correlates thereof. To determine correlates of baseline CAC for inclusion in the multiple linear regression model, we used a combination of demographic, clinical and laboratory data as candidate explanatory variables with the log-transformed CAC score as the dependent variable. We considered two-tailed P-values <0.05 as statistically significant. Analyses were conducted using SAS (version 9.13, SAS Institute, Cary, NC) and S-PLUS (version 8.0, Insightful Corp, Seattle, WA).
As designed originally, ADVANCE was to enrol 330 subjects allocated randomly to one of two similarly sized treatment groups. At that sample size, the study should have 85% power to detect a 15% absolute difference between treatment groups in percentage change from baseline CAC score over 52 weeks, with two-sided α = 0.05 and standard deviation (SD) of 35%. It was anticipated that 20% of subjects would exit the study early and that an additional 20% would use prohibited medications (‘drop in’) or withdraw from study therapy (‘drop out’).
The efficacy evaluable analysis set includes all subjects who completed study treatment per protocol and had baseline and Week 52 CAC scores. The full analysis set includes all subjects with a baseline CAC score and at least one post-baseline CAC score. Relative and absolute changes in efficacy end points will be compared between treatment groups using a generalized Cochran–Mantel–Haenszel (CMH) test on ranks, stratified by CAC score at randomization. A sensitivity analysis using generalized linear models will be used to compare the treatment effect between groups using CAC score strata at randomization as a covariate. Sensitivity analyses will be performed using the full analysis set, with single and multiple imputation techniques used for subjects who were excluded from the efficacy evaluable analysis set. The proportion of subjects with >15% progression of CAC will be compared between the two treatment groups using the CMH test, stratified by CAC score at randomization. The proportion of subjects reaching the end point will be tabulated by (i) treatment group and (ii) treatment group and CAC score stratum. A supportive analysis using a logistic regression model will be performed with baseline CAC score as a covariate. In addition, an exploratory analysis of the impact of clinically important baseline covariates on the primary efficacy end point and secondary efficacy calcification end points will be investigated using generalized linear models.
Biochemical end points will be compared between treatment groups using a generalized CMH test on ranks, stratified by CAC score at randomization, for those subjects in the efficacy-evaluable analysis set.
The safety analysis set includes all randomized subjects. Incidence rates of all adverse events, treatment-related adverse events, adverse events leading to withdrawal, serious adverse events, serious treatment-related adverse events and fatal adverse events will be tabulated by system organ class and treatment group.
Results
Enrolment
A total of 737 subjects from 90 centres were screened for enrolment; 377 failed to qualify for the study. Reasons for screen failure included a CAC score <30 (n = 180), PTH concentrations or Ca × P that did not exceed prespecified eligibility thresholds (n = 95), corrected serum calcium <8.4 mg/dL (n = 19), MDCT scan not obtained within the 45-day screening window (n = 45), no consent provided or consent withdrawn (n = 34) and use of non-calcium-based phosphate binders (n = 13). Among subjects who failed screening but had an available total CAC score (n = 191), 107 (56%) had a score of 0, 62 (32%) had a score >0 but <30, 5 (3%) had a score ≥30 but ≤100, and 17 (9%) had a score >100.
The remaining 360 subjects completed screening and were randomized. Of these, 134 (37%) had CAC Agatston scores ≥30–399, 94 (26%) had Agatston scores ≥400–999, and 132 (37%) had Agatston scores ≥1000.
Demographics and baseline characteristics
Among randomized subjects, the mean age was 61.5 years, 58% were men, and 24% were black (Table 1). The median dialysis vintage was just over 3 years (36.7 months). Subjects with CAC scores ≥1000 tended to be older and were more likely to be men (Table 1). Most subjects had been treated previously with calcium-containing medications, whereas fewer had received sevelamer or lanthanum carbonate. Only 9% of subjects had been treated previously with cinacalcet. Forty-three percent of the study sample had diabetes, and there were relatively high proportions with a history of overt cardiovascular disease (Table 2). Generally, the proportion of subjects with diabetes and a history of coronary artery disease, myocardial infarction, cerebrovascular accident, peripheral arterial disease and congestive heart failure were higher among subjects with more extensive CAC at baseline. Median PTH concentrations at baseline exceeded 400 pg/mL, but values did not differ according to the extent of CAC at baseline (Table 3). Serum calcium and phosphorus concentrations and calculated Ca × P values also did not differ according to baseline CAC scores. There were no differences in mean values for serum total cholesterol, low-density lipoprotein cholesterol, high-density lipoprotein cholesterol or triglycerides among the three strata for CAC scores at baseline. In contrast, median values for CRP were higher in the two upper strata for baseline CAC scores compared with the lowest stratum.
Baseline demographic, disease and medication characteristics
| All subjects n = 360 | CAC score ≥30–399 n = 134 | CAC score ≥400–999 n = 94 | CAC score ≥1000 n = 132 | |
|---|---|---|---|---|
| Sex, n (%) | ||||
| Women | 153 (43) | 65 (49) | 42 (45) | 46 (35) |
| Men | 207 (58) | 69 (51) | 52 (55) | 86 (65) |
| Mean (SD) age, year | 61.5 (12.7) | 58.0 (12.4) | 62.5 (12.8) | 64.3 (12.2) |
| Race, n (%) | ||||
| White | 236 (66) | 87 (65) | 59 (63) | 90 (68) |
| Black | 85 (24) | 36 (27) | 22 (23) | 27 (20) |
| Hispanic or Latino | 25 (7) | 8 (6) | 8 (9) | 9 (7) |
| Other | 14 (4) | 3 (2) | 5 (5) | 6 (5) |
| Mean (SD) body mass index, kg/m2 | 27.2 (5.9) | 27.4 (6.1) | 26.6 (5.6) | 27.5 (5.9) |
| Mean (SD) systolic blood pressure, mm Hg | 141.1 (23.3) | 139.6 (23.2) | 141.4 (22.3) | 142.5 (24.1) |
| Mean (SD) diastolic blood pressure, mm Hg | 75.7 (12.5) | 77.2 (12.2) | 75.6 (12.1) | 74.2 (12.9) |
| Dialysis characteristics | ||||
| Median (IQR) time on haemodialysis, months | 36.7 (19.9–65.4) | 37.7 (19.7–57.0) | 33.2 (17.7–61.9) | 38.3 (22.2–82.6) |
| Time on dialysis, n (%) | ||||
| <12 months | 52 (14) | 22 (16) | 14 (15) | 16 (12) |
| 12–36 months | 124 (34) | 41 (31) | 35 (37) | 48 (36) |
| >36 months | 184 (51) | 71 (53) | 45 (48) | 68 (52) |
| Median (IQR) dialysate calcium, mEq/L | 2.5 (2.5–3.0) | 2.5 (2.5–3.0) | 2.5 (2.5–3.0) | 2.5 (2.5–3.0) |
| Medication use history, n (%) | ||||
| History of calcium-based phosphate binder use | 301 (84) | 113 (84) | 80 (85) | 108 (82) |
| History of sevelamer use | 94 (26) | 37 (28) | 21 (22) | 36 (27) |
| History of lanthanum use | 20 (6) | 8 (6) | 6 (6) | 6 (5) |
| History of other non-calcium-based phosphate binder use | 34 (9) | 14 (10) | 6 (6) | 14 (11) |
| History of calcimimetic use | 33 (9) | 12 (9) | 9 (10) | 12 (9) |
CAC = coronary artery calcification; IQR = interquartile range.
Summary of baseline medical history
| Medical history, n (%) | All subjects n = 360 | CAC score ≥30–399 n = 134 | CAC score ≥400–999 n = 94 | CAC score ≥1000 n = 132 |
|---|---|---|---|---|
| Diabetes mellitus | 156 (43) | 53 (40) | 35 (37) | 68 (52) |
| Hypertension | 338 (94) | 125 (93) | 86 (91) | 127 (96) |
| Peripheral vascular disease | 92 (26) | 25 (19) | 24 (26) | 43 (33) |
| Cerebrovascular accident | 42 (12) | 8 (6) | 7 (7) | 27 (20) |
| Myocardial infarction | 33 (9) | 5 (4) | 9 (10) | 19 (14) |
| Coronary artery disease | 99 (28) | 29 (22) | 22 (23) | 48 (36) |
| Congestive heart failure | 73 (20) | 18 (13) | 21 (22) | 34 (26) |
CAC = coronary artery calcification.
Summary of baseline laboratory parameters
| All subjects n = 360 | CAC score ≥30–399 n = 134 | CAC score ≥400–999 n = 94 | CAC score ≥1000 n = 132 | |
|---|---|---|---|---|
| Median (IQR) PTH, pg/mL | 425.7 (329.9–621.6) | 441.1 (342.0–624.0) | 402.8 (325.0–566.2) | 440.5 (325.1–706.5) |
| Corrected serum calcium, mg/dL | 9.4 (0.6) | 9.3 (0.6) | 9.4 (0.6) | 9.4 (0.6) |
| Serum phosphorus, mg/dL | 5.8 (1.8) | 5.8 (1.9) | 5.5 (1.7) | 6.0 (1.8) |
| Corrected calcium–phosphorus product, mg2/dL2 | 54.2 (17.1) | 54.0 (18.2) | 52.1 (15.9) | 55.9 (16.6) |
| Albumin, g/dL | 3.9 (0.5) | 3.9 (0.4) | 3.9 (0.5) | 3.8 (0.5) |
| Total cholesterol, mmol/L | 4.2 (1.2) | 4.3 (1.1) | 4.3 (1.2) | 4.2 (1.2) |
| LDL cholesterol, mmol/L | 2.3 (0.9) | 2.3 (0.9) | 2.3 (0.9) | 2.2 (0.8) |
| HDL cholesterol, mmol/L | 1.2 (0.9) | 1.2 (1.4) | 1.2 (0.5) | 1.1 (0.4) |
| Triglycerides, mmol/L | 1.9 (1.4) | 2.0 (1.5) | 1.9 (1.3) | 1.9 (1.3) |
| Median (IQR) CRP, mg/L | 7.4 (3.2–15.8) | 5.8 (2.8–12.5) | 8.0 (3.2–19.6) | 8.3 (3.7–15.8) |
CAC = coronary artery calcification; CRP = C-reactive protein; HDL = high-density lipoprotein; IQR = interquartile range; LDL = low-density lipoprotein; PTH = parathyroid hormone.
Values are means (SD) unless noted otherwise.
Assessment of coronary artery, aortic and valvular calcification
Subjects in ADVANCE had significant coronary artery, aortic, aortic valve and/or mitral valve calcification at baseline (Table 4). Because calcification scores for the coronary arteries and other sites of measurement were not normally distributed, summary statistics for calcification scores at each site are presented as geometric means (95% CI) and medians (interquartile range [IQR]). The geometric mean baseline total CAC Agatston score was 548.7 (95% CI, 480.5–626.6). Of all subjects randomized, 90%, 48% and 52% had evidence of detectable calcification (Agatston score >0) in the aorta, aortic valve and mitral valve, respectively. The median aortic calcification, aortic valve calcification and mitral valve calcification Agatston scores were 1496.2 (IQR, 278.3–5100.0), 0.0 (IQR, 0.0–116.8) and 8.5 (IQR, 0.0–293.0), respectively (Figure 2). Mean volume scores were similar to those obtained using the Agatston method. The geometric mean CAC volume score was 450.2 mm3 (95% CI, 397.0–510.6 mm3).
Summary of baseline calcification assessments using the Agatston and volume methods
| Agatston calcification scorea | Calcium volume scoreb mm3 | |||
|---|---|---|---|---|
| Median (IQR) | Geometric mean (95% CI) | Median (IQR) | Geometric mean (95% CI) | |
| Total coronary artery calcification (n = 360) | 622.9 (206.8–1448.2) | 548.7 (480.5–626.6) | 474.7 (170.0–1150.0) | 450.2 (397.0–510.6) |
| Aortic calcification (n = 324) | 1939.5 (410.4–5660.3) | 1361.7 (1091.2–1699.1) | 1562.7 (337.4–4280.2) | 1081.0 (876.7–1332.9) |
| Aortic valve calcification (n = 174) | 119.3 (43.1–428.5) | 120.9 (92.4–158.1) | 99.6 (42.8–339.6) | 117.7 (92.9–149.2) |
| Mitral valve calcification (n = 187) | 251.9 (52.3–1211.4) | 238.6 (178.5–318.7) | 236.1 (59.1–906.4) | 225.7 (174.4–292.3) |
IQR = interquartile range.
Subjects with a calcium score of zero on the original scale or a calcium volume score of zero on the original scale have been excluded from the summaries presented in this table.
The total coronary calcification score is based on the sum of the scores from the left main, left anterior descending, circumflex and right coronary scores.
The total coronary artery calcium volume score includes the calcium volume for the left main, left anterior descending, circumflex and right coronary arteries.
Distribution of baseline total coronary artery calcification scores using the Agatston and volume scoring methods. Median calcification scores (with interquartile range and minimum and maximum values) are shown.
Correlates of baseline coronary artery calcification
Multivariable linear regression was applied to identify factors associated with the extent of CAC. Older age (P < 0.0001), male sex (P = 0.0011), longer dialysis vintage (P = 0.0002), coexistent diabetes (P = 0.0007) and higher baseline iPTH (P = 0.0193) were associated with higher baseline CAC scores (Table 5).
Linear regression analysis with log-transformed CAC as the dependent variable
| Variable | Parameter estimate | Standard error | P-value |
|---|---|---|---|
| Intercept | 5.86725 | 0.11254 | <0.0001 |
| Male sex | 0.42599 | 0.12992 | 0.0011 |
| Age, years | 0.02841 | 0.00516 | <0.0001 |
| Dialysis vintage, months | 0.00518 | 0.00135 | 0.0002 |
| Baseline iPTH, 100 pg/mL | 0.03382 | 0.01439 | 0.0193 |
| Coexistent diabetes | 0.45068 | 0.13181 | 0.0007 |
Discussion
The ADVANCE Study was designed to determine whether treatment of sHPT with a cinacalcet-based treatment strategy (with low doses of vitamin D sterols) results in an attenuation of progression of vascular calcification relative to a flexible, generally higher-dose, vitamin D-based strategy. This study should yield important information for the nephrology community, and in particular, for providers of dialysis care. It has been well established that cinacalcet lowers PTH concentrations [8–15]. What has not been determined is whether the reduction of PTH (either with cinacalcet or other therapies) can attenuate vascular calcification; enhance bone health; or reduce the risk of fractures, cardiovascular events or other aspects of morbidity and mortality. Clinical trials such as ADVANCE are considered to be among the most important studies to evaluate the true effects of various therapeutic strategies. The design of ADVANCE should allow the investigators to determine whether cinacalcet has a clinically meaningful effect on vascular calcification in patients on haemodialysis.
The cross-sectional results of the ADVANCE baseline data document the extent of calcification at several discrete cardiovascular sites. Not unexpectedly, calcification within the thoracic aorta, aortic valve and mitral valve was present in many of the patients with detectable CAC. These initial calcification data from participants in the ADVANCE Study provide the basis for assessing interval changes in the extent of cardiovascular calcification at each of four sites after 6 and 12 months of follow-up using serial MDCT measurements in patients managed by different therapeutic strategies.
By design, only patients with CAC scores ≥30 as measured by the Agatston scoring method using MDCT were enrolled in the current study. Previously reported results using Agatston scoring determined by electron beam CT indicate that patients on dialysis with evidence of CAC often display an increase in calcification scores over 12 to 24 months when assessed by sequential measurements, whereas those with no evidence of CAC are unlikely to develop newly detectable calcified lesions within the same period of follow-up [20]. The inclusion of subjects with evidence of CAC on entry into the current study is thus expected to enhance the ability to detect interval changes in CAC scores over a study of 12-month duration compared with results reported previously in more heterogeneous groups of individuals composed of haemodialysis patients, both with and without evidence of CAC. Despite the difference between ADVANCE and previous studies in the proportion of subjects with evidence of CAC at enrolment, median values for CAC scores in the current clinical trial were similar to those reported by others for patients with detectable CAC at baseline [18,19].
All subjects who participated in the ADVANCE Study received calcium-based phosphate binders to manage phosphorus retention and to control hyperphosphataemia according to clinical practice guideline recommendations and in compliance with local standards of clinical practice. The use of calcium-free phosphate-binding agents was precluded because these compounds exert disparate effects on calcium and phosphorus metabolism and may alter the progression of vascular calcification by one or more of several hypothesized mechanisms [7]. Restriction of the ADVANCE population to subjects with evidence of baseline CAC and on only calcium-based phosphate binders limits generalizability of the study's results but may help clarify the effect of cinacalcet on vascular calcification by minimizing confounding by co-interventions.
Although the investigators in ADVANCE were not blinded to subject treatment, this aspect of the study design permitted appropriate adjustments to ongoing treatments according to current clinical practice recommendations. It should be emphasized that all assessments of CAC and calcification at other cardiovascular sites were performed by a single observer who did not have access to information about subject identity, demographics, study site or treatment assignment either at baseline or during the subsequent 12-month follow-up interval.
The ADVANCE Study was powered to detect a difference of 15% between treatments in the absolute percentage change in CAC scores over 12 months of follow-up, a difference considered to be clinically meaningful. In this regard, an increase in CAC scores ≥15% in 1 year among subjects receiving HMG-CoA reductase inhibitors to manage cardiovascular risk was associated with significantly shorter cardiovascular event-free survival compared with patients who had a <15% increase in CAC score during the same period [21].
Using multivariate analysis, factors shown to predict CAC in the current study included older age, male gender, longer dialysis vintage and diabetes, results consistent with those reported previously. Higher plasma PTH concentrations at baseline were also found to be associated with more extensive CAC in the current study, whereas no association was detected among serum concentrations of either calcium or phosphorus with baseline CAC scores. These results differ from those described by Raggi et al. and others [4,22] suggesting that higher concentrations of serum phosphorus and calcium are associated with more extensive CAC among patients on dialysis. These slightly disparate findings may be attributable to differences in the patient populations studied. Only subjects with biochemical evidence of sHPT were enrolled in the ADVANCE Study, whereas most other reports describing the relations among disturbances in mineral metabolism and vascular calcification have included more heterogeneous patient samples.
One potentially interesting observation in this study was elevated median CRP in the upper two baseline CAC strata. Although these findings may be taken to suggest a role of inflammation in the development of CAC, they should be interpreted with caution because they do not provide proof of cause and effect and may be confounded by other variables, such as age, dialysis vintage or diabetes. Nonetheless, it will be of interest to verify in the course of the study whether control of sHPT reduces the level of CRP.
Vitamin D therapy has been considered the cornerstone of sHPT treatment because decreases in vitamin D concentrations parallel increases in PTH as kidney function declines [23]. Some animal experiments, however, have raised the concern that vitamin D may increase vascular calcification [24]. Retrospective and cross-sectional data in humans have given contradictory results with some publications showing a contribution of vitamin D to vascular calcification [25] whereas others do not support this contention [26]. On the other hand, experiments in animal models of kidney failure have demonstrated inhibition of vascular calcification progression with calcimimetics [27–29]. Hence, it will be of interest to verify whether an effect on vascular calcification can be detected with a relatively short course of calcimimetic therapy along with low-dose vitamin D relative to flexible, typically higher-dose vitamin D.
In addition to the study design limitations described above, one of the primary limitations is that efficacy evaluations will be based on CAC score, with no direct evaluation of the effect of cinacalcet on cardiovascular events. Although the CAC score is a surrogate marker, it is a more proximate marker of cardiovascular events than changes in serum biochemical markers. Indeed, the baseline data from ADVANCE suggest an association between CAC and cardiovascular disease. An ongoing randomized clinical trial will investigate whether cinacalcet reduces time to mortality or cardiovascular events in patients with sHPT receiving haemodialysis [30]. Other limitations of the study include the relatively short duration (1 year), use of different CT scanners at different study sites and potential confounding caused by different dosing of active vitamin D in the two arms. Also, inherent technical variations in CT scanning techniques and methodology cannot be excluded as a limitation.
We anticipate that the ADVANCE Study will provide a better understanding of the effect of cinacalcet on vascular calcification and in conjunction with other evidence, could lead to improvements in therapy for patients with sHPT receiving haemodialysis.
The authors would like to thank Rick Davis, RPh, Margit Rezabek, DVM, PhD, and Ali Hassan, PhD (Complete Healthcare Communications, Inc., Chadds Ford, PA), all on behalf of Amgen Inc., for assistance in the preparation of this manuscript.
Conflict of interest statement. The results presented in this paper have not been presented previously in whole or part, except in abstract form. This study was sponsored by Amgen Inc. J.F. has received speaker and consultant honoraria from Amgen, Genzyme, Shire and has received grant support from Amgen and Fresenius. P.R. has received research grants from Amgen and Genzyme. G.A.B. has received research grants from Amgen, Genzyme, Shire, Novartis, DaVita, and Fresenius; has received fees for expert consultancy and/or advice from Amgen, Genzyme, Shire, Mitsubishi, and Theraclion. P.U.T. has received fees for clinical research, speaking and expert consultancy from Amgen, Shire, Novartis, Roche, Fresenius, Roche, HAS, and Hemotech. G.M.C. has received research funding from Amgen. W.G.G., N.L., G.D. and B.D. are employees and stockholders in Amgen. A.N., B.C., K.N. and M.M. have nothing to declare.


Comments