


Abstract
Recently revised brain tumor classification suggested a glioma treatment strategy that takes into consideration molecular variants in IDH1 and TP53 marker genes. While pathogenic variants of IDH1 and TP53 can be accompanied by chromosomal instability (CIN), the impact of IDH1 and TP53 mutations on genome stability remains unstudied. Elevated CIN might provide therapeutic targets, based on synergistic effects of chemotherapy with CIN-inducing drugs. Using an assay based on human artificial chromosomes, we investigated the impact of common glioma missense mutations in IDH1 and TP53 on chromosome transmission and demonstrated that IDH1R132H and TP53R248Q variants elevate CIN. We next found enhanced CIN levels and the sensitivity of IDH1R132H/WT and TP53R248Q/R248Q genotypes, introduced into U87 MG glioma cells by CRISPR/Cas9, to different drugs, including conventional temozolomide. It was found that U87 MG cells carrying IDH1R132H/WT exhibit dramatic sensitivity to paclitaxel, which was independently confirmed on cell cultures derived from patients with naturally occurring IDH1R132H/WT. Overall, our results suggest that the development of CIN-enhancing therapy for glioma tumors with the IDH1R132H/WT genotype could be advantageous for adjuvant treatment.
Introduction
Diffuse gliomas are the most commonly occurring primary malignant brain tumors, which are reported to be originated from glial cells [1–3]. The discovery of mutations in isocitrate dehydrogenase (IDH) genes has led to a better understanding of glioma biology as well as a major change in diagnostic criteria and standards of care [4]. Most notably, when the molecular features were incorporated in the brain tumor diagnosis for the first time in the fourth edition of World Health Organization (WHO) classification of central nervous system tumors, IDH mutation status was used as the genetic driver mutation biomarker to better classify diffuse gliomas, allowing the combination of phenotype and genotype in the classification of diffuse gliomas. In the updated fifth edition of WHO classification, IDH mutation status plays an important role in differentiating adult-type diffuse gliomas from the rest of diffuse glioma types, including pediatric-type diffuse glioma, circumscribed astrocytic glioma, glioneuronal tumor, and ependymomas. Adult diffuse gliomas, the majority of primary brain tumors seen in adult neuro-oncology clinics, are composed of astrocytoma, IDH-mutant, oligodendroglioma, IDH-mutant and 1p/19q co-deleted, and glioblastoma, now defined as IDH wild-type (WT) tumors. While IDH mutation is the key genetic biomarker, IDH-mutant astrocytomas often carry class-defining loss-of-function mutations in TP53 and ATRX [5, 6]. In contrast, the IDH-mutant oligodendrogliomas are molecularly defined by 1p/19q co-deletion.
Based on the TCGA PanCancer database, 97% of the co-occurrence of IDH1 hotspot mutation and TP53 mutation were in lower grade glioma and glioblastomas [7]. Of note, TP53 alteration and 1p/19q co-deletion in IDH-mutant gliomas are mutually exclusive [7]. The rate of TP53 mutations in IDH-mutant astrocytomas is markedly elevated and >50% IDH-mutant astrocytomas exhibit P53 nuclear expression while the TP53 mutation is extremely uncommon in oligodendrogliomas [3, 6–8].
The most [9] commonly seen IDH1 gene in glioma displays missense mutation that results in a substitution of arginine for histidine at the position 132 (R132H) of the primary amino acid sequence, while TP53 has multiple hotspot missense mutations that result in a substitution of a variety of amino acids: R273C, R175H, R248Q/W, and R273H (Supplementary Table S1). Fourty-one per cent of glioma patients, carrying proto-oncogenic TP53 mutations, also have IDH1R132H [10]. Importantly, mutant IDH1 and TP53 (IDH1mut and TP53mut) facilitate the expansion of glioma stem cells by conferring gain-of-function (GOF) and dominant-negative phenotypes [10–12]. Low-grade glioma patients bearing missense mutations in both IDH1 and TP53 genes have a two-fold lower survival compared with solely IDH1mut patients [13]. Additionally, cBioportal analysis of six low-grade glioma studies revealed 1.7-fold higher overall survival in patients having IDH1mut compared with IDH1mut-TP53mut when all 1p/19q co-deleted samples were excluded (described below; Supplementary Fig. S1) implying that the presence of the TP53mut exacerbates the disease progression. The current standard therapies for IDH-mutant astrocytomas include a maximal safe surgical resection of the tumor followed by radiation and chemotherapy [14]. While current treatment strategies have been shown to increase the patient survival, the results of such combination therapy are still not optimistic enough because of frequent side effects and complications [15, 16]. Even though molecular profiling of gliomas was applied to tumor diagnostic and classification, the therapies specifically targeting IDH1mut and/or TP53mut tumors are currently not available.
The recent genomic analyses of IDHmut and TP53mut gliomas revealed numerous cases of genomic rearrangements such as chromosomal instability (CIN), copy number variations (CNVs), and chromothripsis (a mutational process by which up to thousands of clustered chromosomal rearrangements occur in a single event) that make plausible to employ the drugs triggering genomic instability for the development of novel strategies for the IDHmut and TP53mut glioma therapy. It is well established that the level of cellular heterogeneity in gliomas depends on a number of chromosomal rearrangements [17], and that the hotspot mutations in the IDH1 and TP53 genes probably play an important role in gliomagenesis. Specifically, genomically unstable IDHR132H gliomas exhibit rapid higher grade transformation [18], and the CIN rate increases with the grade of gliomas [19]. The random distribution of CNVs throughout the entire genome in IDH1mut tumors has been documented in several studies [18, 20, 21]. Similarly to the increase in CIN rates, the CNVs are increased in high-grade IDH1mut astrocytoma and oligodendroglioma, as well as with malignant behavior in glioblastoma [19, 22]. Furthermore, the chromothripsis has been detected in neuroblastoma, medulloblastoma [23], and glioblastoma [24]. The glioblastomas are associated with higher chromothripsis that affects modulators of the TP53 pathways [24]. The increased level of chromothripsis is also reported in IDHR132H gliomas with poor clinical outcomes [21]. Interestingly, IDHR132H astrocytoma and oligodendroglioma shared CIN, and astrocytoma exhibited increased total CNVs compared with oligodendroglioma [25]. In general, CIN is an established underlying factor in aggressive behavior and progression of a subset of astrocytoma, while the CIN level in IDHR132H astrocytoma correlates with the patient survival rate [22].
The abovementioned genomic rearrangements cause loss of structural complexity and result in the acquisition or loss of chromosomal regions presumably affecting tumor progression. While tumors with CIN tend to be more aggressive, drug-resistant, and result in a worse clinical outcome, some research data indicated that a high CIN rate in cancer cells prevents them from propagation and, thus, may be exploited therapeutically [26–29, 30]. Incidentally, there are many categories of drugs, either approved by the FDA or in clinical trials for other cancers, that strategically modulate CIN levels in tumor cells [29, 31, 32]. Commonly, CIN-reducing therapies inhibit cell division in the presence of DNA damage, chromosomal or mitotic abnormalities, and/or decrease the rate of abnormal chromosome segregation. In contrast, CIN-inducing therapies exploit the natural tendency of a tumor cell to accumulate chromosomal damages and push cancer cells over the threshold of cell viability, eventually leading to cell death.
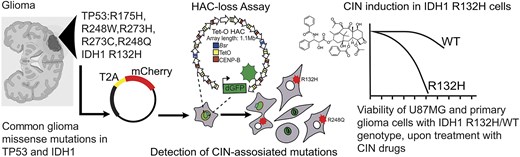
In this study, using a human artificial chromosome (HAC)-based assay, we analyzed the impact of common glioma missense mutations – IDH1R132H and TP53R175H, R273C, R273H, R248Q, and R248W – on proper chromosome transmission. This non-essential HAC carries a constitutively expressed dGFP transgene (HAC/dGFP). The HAC propagates and segregates properly in HT1080 fibrosarcoma cells. However, mitotic stability of HAC/dGFP is ∼10-fold lower than that of natural chromosomes (∼1 × 10³) [33, 34], which makes the HAC a sensitive model for studying a CIN phenotype in cancer cells. Using a HAC/dGFP-based assay, we identified IDH1R132H and TP53R248Q missense mutations that increase a CIN rate in cancer cells. We also investigated the sensitivity of malignant glioma U87 MG cells carrying CRISPR/Cas9-edited IDH1R132H/WT and TP53R248Q/R248Q genotypes to CIN-inducing drugs – paclitaxel, vincristine, and etoposide – versus conventional temozolomide. We found that treatment of U87 MG cells carrying CRISPR/Cas9-edited IDH1R132H/WT with paclitaxel leads to the highest cytotoxicity accompanied by formation of micronuclei (MN) and double-strand breaks (DSBs), the markers of CIN and rearrangements. It is worth noting that LC50 of paclitaxel for IDH1R132H/WT is 10 times lower than that for WT cells. Moreover, high sensitivity of IDH1R132H/WT gliomas to CIN-inducing drugs was confirmed on primary cell models derived from patients. Thus, CIN-inducing drugs has a potential to serve as an adjuvant onco-therapeutic agent for IDH1R132H/WT glioma cancers in addition to conventional chemotherapy with temozolomide.
Materials and methods
cDNA synthesis
SuperScript II Reverse Transcriptase (RT; Thermo Fisher Scientific, USA) was used to synthesize the first-strand complementary DNA (cDNA). The recombinant enzyme reduced RNase H activity and increased a thermal stability. In the 200-μl polymerase chain reaction (PCR) tube, a mixture was taken as the following: 5 μg/μl total RNA, 1 μl Oligo(dT)18, 1 μl dNTP Mix (10 mM each), and 9 μl distilled water. The mixture was heated to 65°C, left for 5 min, and then quickly chilled on ice. The content of tubes was collected by a brief centrifugation and then the following solution was added: 4 μl of 5× first-strand buffer, 2 μl of 0.1 M DTT (Dithiothreitol), and 1 μl of RNase OUT (40 units/μl). The content of the tube was gently mixed and incubated at 42°C for 2 min. Then 1 μl (200 units) of SuperScript II RT was added, gently mixed by pipetting, and incubated at 42°C for 50 min. The reaction was inactivated by heating at 70°C for 15 min.
Construction of the plasmids
The plasmids for the expression of the TP53- and IDH1-mutant variants with mCherry fluorescent protein were constructed based on the vector pLV_EF1a_IRES_blast (Addgene; Plasmid #85133). The coding sequences of the TP53- and IDH1-mutated genes were amplified from cDNA by PCR without a stop codon (this step is necessary for expression of several proteins separated by T2A peptide) in an equivalent ratio under the control of a single promoter [35, 36]. For PCR, we used Phusion® High-Fidelity DNA Polymerase (New England Biolabs, USA). In a PCR tube, the mixture was taken as the following: 10 μl of 5× Phusion HF Buffer, 4 μl of dNTPs (10 mM each), 2.5 μl of the forward primer (10 μM) and 2.5 μl of the reverse primer (10 μM), 1.5 μl of DMSO (Dimethyl sulfoxide), 1 μl of the template (250 ng of cDNA), 0.5 μl of Phusion DNA Polymerase, and 27 μl of water. It is important to add Phusion DNA Polymerase at the end to prevent primers degradation caused by the 3′→ 5′ exonuclease activity. The reaction was gently mixed. Then the solution was collected at the bottom of the tube by a quick spin and PCR tubes were transferred to a PCR machine with the block pre-heated to 98°C. Thermocycling conditions for PCR were as the following: initial denaturation at 98°C for 90 s, cycling denaturation at 98°C for 10 s, annealing at 65°C for 30 s, extension at 72°C for 60 s, and a final extension at 72°C for 180 s. The number of cycles was 35. The mCherry coding sequence was amplified by PCR from the plasmid pH2B_mCherry_IRES_puro2 (Addgene; Plasmid #21045). The forward primer for mCherry contains several complementary nucleotides at the 5′-end of the TP53 coding sequence, allowing the chimeric oncogene-T2A-mCherry sequence to be obtained by overlapping PCR (Supplementary Table S2). The extension time for the mCherry amplification was 30 s.
Overlapping PCR was used to create a chimeric construct to incorporate an oncogene bound to the mCherry fluorescent reporter via a disassociating T2A peptide translation. For overlapping PCR, we used Phusion® High-Fidelity DNA Polymerase (New England Biolabs, USA). In the PCR tube, the mixture was taken as the following: 10 μl of 5× Phusion HF Buffer, 4 μl of dNTPs (10 mM each), 1.5 μl of DMSO, 2 templates (oncogene-T2A and T2A-mCherry) in the equimolar ratio, 0.5 μl of Phusion DNA Polymerase, and 20 μl of water. The reaction was gently mixed. Thermocycling conditions for PCR were as the following: initial denaturation at 98°C for 90 s, cycling denaturation at 98°C for 10 s, annealing at 68°C for 30 s, extension at 72°C for 90 s, and a final extension at 72°C for 300 s. The number of cycles was 15.
Next, the primers were added to the PCR mixture: 2.5 μl of the forward primer (10 μM) and 2.5 μl of the reverse primer (10 μM). The reaction was gently mixed. Thermocycling conditions for PCR reaction were as the following: initial denaturation at 98°C for 90 s, cycling denaturation at 98°C for 10 s, annealing at 68°C for 30 s, extension at 72°C for 90 s, and a final extension at 72°C for 300 s. The number of cycles was 25. The final PCR products were checked by agarose gel electrophoresis (Bio-Rad, USA) and ChemiDoc MP Imaging System analyzer (Bio-Rad, USA). The amplified fragments were purified from an agarose gel with Cleanup Standard (Evrogen, Russia). The plasmid pLV-EF1a-IRES-blast and the resulting chimeric TP53-T2A-mCherry sequence were digested by NotI/BamHI and then ligated by the sticky ends (Thermo Fisher Scientific, USA). To isolate the recombinant plasmids, we used Escherichia coli strain DH10B chemically competent cells (Thermo Fisher Scientific, USA).
Transfection
The day before transfection, the HT1080 cells (ATCC, USA) were seeded on 10-cm dish in 8 ml fresh complete Dulbecco’s modified Eagle’s medium (DMEM) (Gibco, USA) containing 10% fetal bovine serum (FBS; Gibco) and cultured at 37°C, 5% CO2 overnight. The next, the old medium was removed by aspiration and 6 ml of transfection medium was added (95% DMEM, 5% FBS). Two sterile 1.5-ml microcentrifuge tubes marked A and B were prepared and 500 μl of phosphate-buffered saline (PBS) was added to each tube. Then 7 μg of the plasmid pLV-EF1a-IRES was added to tube A and 21 μl of polyethylenimine (PEI) solution (1 mg/ml) was added to tube B, respectively. A solution was mixed in each tube by vortex for 1 min and left at room temperature for 10 min. Then the DNA solution was transferred to the tube A and then mixed with the PEI solution in the tube B. The solutions were mixed gently by pipetting up and down three times and then left at room temperature for 3 min to allow the PEI/DNA complexes to form. Then the PEI/DNA complexes were gently added dropwise to cells, then gently mixed by swirling, and incubated at 37°C for 3 h in the 5% CO2 incubator. After 3 h of incubation, the old medium was removed, and a fresh complete medium was added. The cells were incubated at 37°C in the 5% CO2 incubator.
Base editing of U87 MG glioma cells
A standard U87 MG glioma cell line with the passage number P21 (ATCC; NTV-14) was used to introduce the IDH1R132H/WT (395G > A) and/or TP53R248Q/R248Q(743G > A, 744G > A) mutations to produce the isogenic cell lines. The edited cell lines were obtained using a gene editing approach without DSBs by means of base editors (BEs) [37]. To increase the efficiency of transfection, the cells were selected according to the activity of cytidine deaminase using the blue fluorescent protein (BFP) [38]. Specifically, we utilized a transient reporter for editing enrichment using pEF-BFP (Addgene; Plasmid #138272), double guide RNA (gRNA) – pDT-sgRNA (Addgene; Plasmid #138271), and BE – pEF-AncBE4max (Addgene; Plasmid #138270). For cell transfection, we performed nucleofection on a 4D-Nucleofector™ X-unit (Lonza Bioscience, USA) in 100 μl format using a P3 Primary Cell 4D-Nucleofector™ X Kit (Lonza Bioscience, USA). The pulse program used for the nucleofector was DC-126. After 3–4 days, an efficiency of transfection was assessed by the number of cells expressing GFP using the CellIQ imaging system (the analysis is described below). BFP+/GFP+ cells or GFP+ cells alone were then sorted into 96-well plates, one cell per well, for subsequent clonal expansion. Sorting was performed using a MoFlo Astrios EQ Cell Sorter (Beckman Coulter, USA). After 1–2 months, the expanded clones were screened for the presence of IDH1R132H and/or TP53R248Q using Sanger sequencing. To construct a cell line, we mixed at least three separate clones with the corresponding genotype. As a result, the following cell lines were used for analysis: U87 MGWT – the CRISPR control (a control for the BE unspecific influence), U87 MG clones carrying IDH1R132H/WT, and U87MG clones carrying TP53R248Q/R248Q.
Cell lines and culture conditions
The following cell lines were used for all the experiments described below: the human fibrosarcoma cell line HT1080 (RRID: CVCL_0317) and the human glioblastoma cell line U87 MG Uppsala (RRID: CVCL_GP63). The HT1080 and U87 MG cell lines were obtained from the American Type Culture Collection. Cells have been authenticated in the past 3 years morphologically and by short tandem repeat analysis. The cell lines were tested regularly to confirm the lack of mycoplasma infection with the mycoplasma detection kit PlasmoTest (InvivoGen, USA). All the experiments were performed with mycoplasma-free cells. The HT1080 and U87 MG cells were basically maintained in the complete medium DMEM (Gibco, USA) supplemented with 10% (v/v) FBS (Clontech Laboratories Inc., USA) at 37°C in 5% CO2 atmosphere. To achieve the selection for the GFP-positive cells, the HT1080 cells carrying the HAC/dGFP were maintained in the presence of 10 μg/ml of Blasticidin S (Funakoshi Inc., Japan).
Early-passage cell cultures derived from glioma patients
All tumor samples were provided by the Medical Center of the Far Eastern Federal University (FEFU) and depersonalized. The use of patient samples was approved by the FEFU Ethics Committee (protocol #5/19 December 2017); all experiments were carried out in accordance with the principles of the WMA (World Medical Association) Declaration of Helsinki. All patients signed an informed consent document before participating in the study. To generate primary cell cultures, the following protocol was used. Tumor fragments, sizing 3–5 mm, were rinsed with sterile 1× PBS (Gibco, USA) solution to remove the blood traces. Tumor fragments were placed in a 10-cm cell culture dishes (Eppendorf, Germany) and incubated with 3 ml of 1× trypsin–ethylenediaminetetraacetic acid (EDTA) solution (Gibco, USA). After that, the tumor fragments were grinded using sterile scalpel and tweezers. The obtained suspension was transferred to a sterile 15-ml centrifuge tube (Eppendorf, Germany), closed, and placed for 20 min in a CO 2 incubator with gentle stirring every 5 min. A total of 10 ml of the media was added to the tube with the sample and carefully mixed by pipetting. Then the obtained suspension was transferred to a cell culture flask and put in a CO2 incubator for 24 h. The first three passages of cells were cultivated in serum-free Neurobasal Medium (Gibco, USA) supplemented with EGF (Gibco, USA). Starting from the fourth passage, we used high-glucose DMEM (Gibco, USA) with 1 mM sodium pyruvate and 300 mg/l l-glutamine (Thermo Fisher Scientific, USA) supplied with 10% FBS (Gibco, USA), penicillin, and streptomycin (Gibco, USA). The next day, the flask was rinsed with warm PBS, and then fresh medium was added. Glioma cell culture was considered as established after two successful recultivations and GFAP labeling. Afterwards, a cell culture was labeled for the differentiation markers and snap-frozen in liquid nitrogen.
HAC-loss assay
The HAC/dGFP stably propagates in the human HT1080 cells and ∼10 times less stable than the host chromosomes [33]. Therefore, the loss of HAC/GFP can be measured by flow cytometry or fluorescence scanning microscope. The HAC loss was measured without selection when the cells start losing the HAC spontaneously. To calculate HAC loss, we measured the ratio of GFP-negative cells after transfection with the plasmids containing mutations in either IDH1 or TP53 genes. Induction of the CIN followed by oncogenes expression was examined in HT1080 cells carrying the HAC/dGFP. For the experiment, cells were seeded and cultured with 10 μg/ml of Blasticidin S. After a day, the seeding medium was removed, and then replaced by a transfection medium containing the plasmid. After transfection, the medium was replaced with a fresh medium without Blasticidin S [39]. After 24 h, the mCherry-positive cells were sorted using MoFlo Astrios EQ Cell Sorter (Beckman Coulter, USA) and a fluorescence of mCherry-positive cells was detected at 610 nm by the 587-nm laser. The mCherry-positive cells were subsequently grown without Blasticidin S for 72 h, and then analyzed for HAC loss by detecting the ratio of GFP-negative cells. As a positive control, we used depletion of the MIS18 gene by siRNA transfection comparing with non-targeting control siRNA treatment (nt.siRNA, non target interfering RNA). As a negative control (NC), the cells were transfected with the mCherry-empty plasmid. For each oncogene, the experiment was carried out in three replicates. For each pathogenic variant, the rate of HAC/dGFP loss was accurately measured using flow cytometry on BD Accuri C6 (BD Biosciences, USA). Cells were harvested by trypsin treatment and resuspended in PBS. All the samples were vortexed immediately prior to flow cytometry examination. The fluorescence of GFP-positive cells was measured by the 488-nm laser and detected at 510 nm. Samples were acquired in at least three separate triplicates for 30 s or 1.5 × 10⁴ events (at minimum). HAC-loss analysis was performed with software Kaluza Analysis (v3.1).
siRNA transfection
The rescue experiments were performed as described in the Lipofectamine RNAiMAX protocol (Thermo Fisher Scientific, USA). The genes of interest were depleted using siRNAs (Supplementary Table S2), which were purchased from Dharmacon, USA. For siRNA treatment, 12.5 × 10³/well cells were seeded in 24-well plates a day before the experiment. Cells were transfected with each siRNA (a working concentration of 12 nM) using Lipofectamine RNAiMAX (Thermo Fisher Scientific, USA). Cells were grown for 72 h after transfection. After 72 h, the cells were analyzed by western blot.
Western blot analysis
siRNA depletion of MIS18β (OIP5) protein was confirmed by western blot using the antibodies: Anti-OIP5 (MIS18β) (ab168516) and Anti-GAPDH antibody (Catalogue No. #MA1-16757, Invitrogen, USA). Cells were harvested by adding 0.2 ml 0.05%–0.1% trypsin–EDTA and incubated at 37∘C for 5 min. Cell counts were performed, and cells were pelleted by centrifugation at 200 g for 5 min. The media supernatant was removed, and cell pellets were washed two times in cold PBS. A total of 100 μl of the lysis buffer containing 10 mM Тris–HCl (рН 7.4), 150 mM NaCl, 1% Triton X-100, 1 mM Na3VO4, 10 mM EDTA, 5 mM NaF, and 2 mM phenylmethylsulfonyl fluoride was added to the pellet. Cells were resuspended and incubated for 30 min on ice and then centrifuged at 10 000 × g for 15 min.
The total concentration of the proteins was determined using the Greenberg and Craddock method; the concentrations in the samples were equalized to 1 mg/ml, and sodium dodecyl sulfate–polyacrylamide gel electrophoresis was performed. When the lead dye reached the bottom edge of the gel, the gel was removed from the electrophoretic chamber, and the polypeptides were transferred from the polyacrylamide gel onto a 0.45 μm PVDF (Polyvinylidene fluoride) membrane (Millipore, USA). The transfer was performed for 1 h at 160 mA in 192 mM Tris–glycine buffer (pH 8.4) with 20% methanol. Then protein-free areas of the membrane were inactivated by incubation in 3% skim milk prepared in PBS buffer with 0.05% Tween 20 (PBS-T) for 24 h at 4°C. The membrane was washed in PBS-T three times for 5 min after each stage. Then membrane was incubated with primary antibodies (MIS18 1:2000, GAPDH 1:2000) for 2 h at room temperature and then with diluted secondary antibodies (1:5000) conjugated with horseradish peroxidase (Sigma–Aldrich, USA) for 1 h at room temperature, followed by the addition of the chemiluminescent substrate for horseradish peroxidase (Thermo Fisher Scientific, USA) for 5 min. The chemiluminescent signal was visualized using the gel documentation system ChemiDoc Touch (Bio-Rad, USA). The resulting images were analyzed using the Image Lab software.
Staining and quantification of γ-H2AX foci
On eight-well cell culture chambers (Ibidi, Germany), 1 × 10⁵ HT1080 and U87 MG cells per well were plated. Cells were fixed with 3.7% formaldehyde in PBS for 10 min at room temperature, and then permeabilized with 0.2% Triton X-100 in PBS for 10 min. Cells were blocked with 5% bovine serum albumin (BSA) (Capricorn Scientific, Germany) in TBS for 2 h at room temperature and treated with rabbit monoclonal anti-phospho γ-H2AX (Ser139) antibody (Abcam, USA) in 1:500 dilution with 5% BSA/TBS at 4°C overnight. Goat Anti-Rabbit Alexa Fluor® 568 conjugated secondary antibodies were used in 1:500 dilution with 5% BSA/TBS (TBS, Tris Buffered Saline) at room temperature for 2 h. Cells were stained with 4′,6-diamidino-2-phenylindole dihydrochloride (DAPI) (diluted 1:15 000 in PBS) for 10 min at room temperature. Quantification of the γ-H2AX foci in nuclei was performed using the FV1200 confocal laser scanning microscopy system equipped with the objective lens (UPLSAPO 100×) (Olympus, Japan). The 405-nm LD Laser with Integrated Transmitted Light Photomultiplier Detector and the 488-nm Argon Laser with High-Sensitivity Detector (GaAsP) were used. To avoid cross-detection, the images were acquired sequentially at 488 nm (Argon, USA) and 405 nm (LD). All taken Z-sections were condensed into one single plane to visualize all detectable foci. Staining and quantification of γ-H2AX foci were performed in three independent experiments.
Immunostaining of HT1080 cells transfected with IDH1_mut and IDH1_WT constructs
HT1080 cells were plated onto round glass coverslips in 12-well plates at a density of 17 000 cells/cm² to ensure adequate adherence. The cells were transfected with constructs expressing either mutant IDH1 (IDH1_mut) or WT IDH1 (IDH1_WT) (Supplementary Fig. S5). Fourty-eight hours after transfection, cell were treated with 10 nm of paclitaxel for 3 h, then medium was replaced by new. Subsequently, 72 h post-transfection, the cells were fixed using a pre-cooled microtubule stabilizing buffer (MTSB) solution under a fume hood. The MTSB solution was prepared by combining 27.5 ml H2O, 2.5 ml 100 mM EGTA (ethylene glycol-bis(β-aminoethyl ether)-N,N,N′,N′-tetraacetic acid), 50 μl 1 M MgCl2, and 20 ml 200 mM PIPES, resulting in final concentrations of 5 mM EGTA, 1 mM MgCl2, and 80 mM PIPES.
The fixing solution consisted of MTSB buffer supplemented with 0.1%–0.5% Triton X-100, 4% paraformaldehyde, and 0.025% glutaraldehyde. Cells were fixed/extracted for 10 min at room temperature, followed by quenching in 0.1% NaBH4 in PBS for 7 min. Alternatively, quenching was omitted if the cells were washed three times with PBS containing 0.1% Triton X-100, followed by blocking in Triton block solution. The cells were then rinsed twice with PBS and stored at 4°C. The following day, immunostaining was performed to detect α-tubulin – marker for microtubule organization. Cells were incubated with primary antibodies—anti-α-tubulin YL1/2 (rat monoclonal, 1:500)—diluted in Triton blocking solution for 2 h at room temperature. After incubation, cells were washed three times with PBS containing 0.1% Triton X-100.
Secondary antibodies—anti-rat Cy3 (for α-tubulin)—were diluted 1:500 in Triton blocking solution, and cells were incubated with the secondary antibodies for 1 h in the dark. Post-secondary antibody incubation, cells were washed three times with PBS containing 0.1% Triton X-100 and subsequently stained with DAPI to visualize the nuclei. Finally, the coverslips were mounted onto slides using an anti-fade mounting medium. The cells were then imaged using a fluorescence microscope to evaluate the mitotic abnormalities associated with the transfected constructs and drug treatment.
Micronucleus formation assay
The micronucleus formation assay was performed as described earlier [40] with minor changes. On ibidi cell culture dishes (Ibidi, USA), 1 × 10⁵ HT1080 or U87 MG cells per well were plated. Cells were fixed with 3.7% formaldehyde in PBS for 10 min at room temperature. For scoring, cells were stained using 0.5 μg/ml of a DNA-specific stain, namely DAPI. Approximately 2000 cells were scored using the FV1200 confocal laser scanning microscopy system equipped with the objective lens (UPLSAPO 100×) (Olympus, Japan) and 405-nm LD Laser with Integrated Transmitted Light Photomultiplier Detector. The criteria for evaluation of micronucleus formation included: (i) cell integrity (an intact nucleus and cytoplasm); (ii) similar staining of the nucleus and MN; and (iii) a nucleus and MN present in the same plane of focus. The frequency of cells with MN was determined for each analyzed subject. This assay was performed in three independent experiments.
Drugs
Paclitaxel (PHR1803; Sigma–Aldrich, USA), etoposide (E2600000; Sigma–Aldrich, USA), vincristine (V0400000; Sigma–Aldrich, USA), and temozolomide (PHR1437; Sigma–Aldrich, USA) were used in our study. For primary screening, the LC50 concentrations were measured (Table 1). For 2-hydroxyglutarate (2-HG) effect detection, we used D-α-hydroxyglutaric acid disodium (S7873; Selleckchem, USA).
LC50 concentrations of the drugs used in this study
| Drugs | U87 MGWT WT | U87 MG IDH1R132H/WT heterozygote | U87 MG TP53R248Q/R248Q homozygote |
|---|---|---|---|
| Etoposide, LC50 | 3.148 μM | 6.787 μM | 3.679 μM |
| Temozolomide, LC50 | 2.437 mM | 1.228 mM | 0.120 mM |
| Vincristine, LC50 | 1.366 μM | 1.656 μM | 1.055 μM |
| Paclitaxel, LC50 | 0.5742 μM | 0.05731 μM | 0.5934 μM |
LC50 determination using MTT assay
U87 MG cells were seeded in 96-well plates (Eppendorf, Germany) at density of 1 × 10³ cells per well and were kept at 37°C in 5% CO2. After 24 h, the cells were treated with the drugs: paclitaxel at concentrations of 0.005, 0.01, 0.015, 0.03, 0.06, 0.09, 0.12, 0.15, 0.18, and 0.24 μM and etoposide at concentrations of 0.1, 0.5, 1, 2, 3, 4, 6, 8, 10, and 15 μM. After 48 h, the medium was discarded and replaced by 100 μl of DMEM and 10% FBS containing 5 mg/ml of MTT (3- (4, 5-Dimethylthiazol- 2-yl)-2, 5-diphenyltetrazolium bromide) (Sigma–Aldrich, Germany). After 4 h of incubation, 100 μl of lysis buffer (4 mM HCL, 1% NP-40 in isopropanol) was added, and the cells were kept for 20 min on shaker. Using microplate reader iMark (Bio-Rad, USA), absorbance of each well was measured at 595 and 655 nm. The experiment was carried out in six replicates for each sample. GraphPad Prism software (San-Diego, USA) was used for statistical analysis. The obtained data were normalized for the percentages (an NC data was considered as 100%) to calculate LC50. Linear-regression analysis was performed where R2 > 0.65 was considered relevant. MTT assay was performed in three independent experiments.
cBioportal analysis of patient survival
Data for analysis were taken from cBioportal (https://www.cbioportal.org/). We selected six low-grade glioma studies: Brain Lower Grade Glioma (TCGA, Firehose Legacy), Brain Lower Grade Glioma (TCGA, PanCancer Atlas), Diffuse Glioma (GLASS Consortium, Nature 2019), Glioma (MSK, Clin Cancer Res 2019), Glioma (MSK, Nature 2019), and Low-Grade Gliomas (UCSF, Science 2014) comprising 2241 patients (2644 samples) in total. Then, we further excluded 1p/19q co-deleted samples accounting for 25 patients. Thus, we analyzed 2216 patients (2594 samples). From this cohort, we selected patients bearing IDH1 missense mutations and/or TP53 missense mutations, which accounted for 1298 patients (1505 samples) that were subdivided on the following comparison groups: IDH1- and TP53-mutant (774 samples), IDH1-mutant/TP53WT (393 samples), and TP53-mutant/IDH1WT (338 samples). Afterwards, we analyzed patients whose data for overall survival were present (displayed in bottom table in Supplementary Fig. S1) and built Kaplan–Meier graphs using ‘Comparison/Survival’ tub of cBioportal.
Statistical analysis
The statistical significance of comparisons was determined by GraphPad Prism 8. Unpaired Student’s t-test and one-way ANOVA with multiple comparisons were used. P < .05 was considered significant. The data are presented in diagrams as mean. Error bars correspond to 95% confidence interval.
Measurement of cell proliferation using a high content imaging system (Cell-IQ®)
The proliferation rate of U87 MG cells with IDH1R132H and TP53R248Q genotypes was measured. Cells were seeded in Greiner Bio-One TC 24-well plates (5000 cells per well). During 95 h, the attached cells were observed using the automated cell culture and analysis system Cell-IQ® (CM Technologies) with Nikon CFI Plan Fluorescence DL 4× objective. Nine visual fields were analyzed in each well. The interval between observations of each visual field was 3 h. Cell counting and cell growth curves were obtained using Cell-IQ Analyzer™ software.
Results
Experimental system to identify missense mutations that affect chromosome transmission
For this study, we hypothesized that some GOF and non-GOF mutations of common glioma marker genes, TP53 and IDH1, play a critical role in the high level of genomic rearrangements and instability observed in glioma cells and impact patient survival in the cohort of low-grade gliomas without 1p/19q co-deletion (Supplementary Fig. S1). In this study, we aimed to assess the impact of these variants on genome stability, evaluating their effect based on the fidelity of chromosome transmission. For this purpose, we utilized a previously developed HAC assay, namely the HAC/GFP system [32]. The HAC carries a fluorescent reporter GFP (the destabilized GFP transgene) (Fig. 1A and B) and propagates in human fibrosarcoma HT1080 cells. Since the HAC contains a functional centromere, it enables its relatively stable inheritance as a non-essential chromosome (Fig. 1A). While this HAC is mitotically stable, mutations that dysregulate proper segregation of native human chromosomes also induce HAC missegregation with a notably higher rate than native chromosomes [33] leading to the loss of a fluorescent HAC marker. Thus, the CIN rate can be measured by counting the proportion of fluorescent cells.
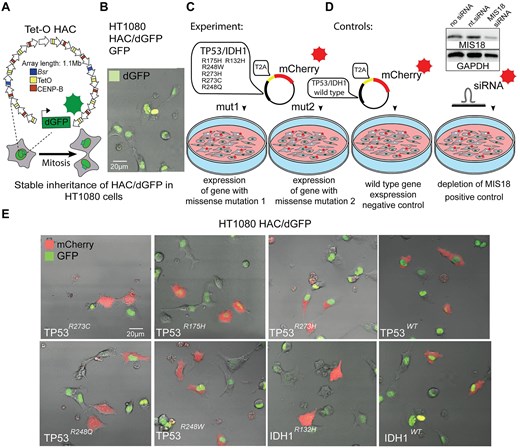
Experimental design of HT1080 HAC/dGFP assay to identify an impact of the missense mutations on CIN. (A) The schematic representation of alphoidtetO-HAC (Tet-O HAC) carrying dGFP and (B) a microscope image displaying a dGFP fluorescent signal from the HAC/dGFP in HT1080 cells. (C) Experimental design: HT1080 cells carrying HAC/dGFP were transfected with the vectors expressing either WT or TP53mut- or IDH1mut-mutant genes in one reading frame with mCherry separated by T2A self-cleaving peptide. (D) Controls: as an NC, mCherry-empty vector and WT genes were used; as a positive control, siRNA depletion of MIS18 was used. Western blot analysis confirms silencing efficiency of the MIS18 protein after siRNA-mediated knockdown of the gene compared with nt.siRNA. (E) Images of the cells transfected with the vectors carrying either WT or TP53mut or IDH1mut display a mCherry fluorescence.
Previously, this HAC was used for the identification of drugs that elevate CIN in cancer cells [41–43]. In addition, this HAC was used as a gene delivery vector for ectopic expression of full-length genes in mammalian cells [34, 44–48], and for studies on the epigenetic regulation of human kinetochores [49–51]. The latest version of this HAC [52] exploits the expression of a modified short half-life GFP (dGFP) that enables detecting CIN within 72–120 h after induction of HAC loss.
In this study, we used the modified HAC/dGFP-based assay to identify the impact of a commonly found glioma’s polymorphism on the CIN level. The starting hypothesis was that missense mutations such as IDH1R132H and TP53R175H, R273C, R273H, R248Q, and R248W (hereafter referred to as IDH1 and TP53 pathogenic variants) may induce HAC loss and, thus, conceivably, disturb proper mitotic transmission of native human chromosomes leading to cell death.
First, by cDNA sequencing we confirmed that the IDH1 and TP53 genes in HT1080 cells carrying HAC/dGFP are not mutated (Supplementary Fig. S2). Then the pathogenic variants were expressed in HT1080 cells (Fig. 1C) by introducing recombinant vectors bearing coding sequences of the mutant genes fused with a fluorescent reporter mCherry separated by the T2A self-cleaving peptide coding sequence [53, 54] (Supplementary Figs S3–S5). After translation, T2A self-cleavage separates mCherry from oncogene proteins to prevent marker interference with the TP53MUT/WT and IDH1MUT/WT proteins. The main advantage of this approach is that the pathogenic variants of genes and mCherry are controlled by the same promoter allowing to estimate TP53 and IDH1 expression based on the fluorescent signal.
Eight vectors were constructed (Fig. 1C), as described in Supplementary Figs. S3–S5. As a positive control, we used siRNA to deplete the MIS18 messenger RNA that results in CIN as previously described [42]. We have performed a western blot analysis that confirmed silencing of MIS18 protein after siRNA-mediated knockdown of the gene in HT1080 HAC/dGFP cells (Fig. 1D) compared with nt.siRNA. As an NC, we utilized the vector expressed WTs of TP53 and IDH1 with T2A-mCherry reporter (Fig. 1D). As shown in Fig. 1E, the cytoplasmic localization of mCherry confirmed the successful expression of the oncogenes and self-cleavable oncogene-T2A-mCherry fusions. We also examinated an expression level of IDH1 and TP53 variants construct expression using reverse transcriptase-polymerase chain reaction (RT-PCR). The results showed no significant difference in the expression level of mutant and WT constructs in HT1080 cells (Supplementary Fig. S6). Moreover, since the constructs for the ectopic expression of pathogenic variants include mCherry marker separated from the coding sequence of target protein by a T2A self-cleaving peptide, we also measured the intensity of fluorescence in mCherry-sorted cells (Supplementary Fig. S6). The results showed an equal fluorescence level of mCherry, which is consistent with the RT-PCR results. These data confirm that any observed phenotypic differences are likely due to the functional effects of the mutations rather than differences in gene expression levels. Among mCherry-positive cells, two outcomes were expected upon the expression of IDH1 and TP53 pathogenic variants: (i) no change in the percentage of GFP-positive cells, i.e. no effect on HAC stability; or (ii) increase of GFP-negative cells in the population meaning that expression of mutant genes induces HAC segregation errors. The control cells transfected with a vector containing solely mCherry were used as a baseline estimate for the loss of HAC/dGFP.
Expression of IDH1R132H and TP53R248Q pathogenic variants leads to γ-H2AX accumulation and MN formation, suggesting potential CIN
Using the system described above, we sorted mCherry-positive cells (Fig. 2A and B) and then analyzed them for mitotic stability of the HAC, based on the GFP signal loos (Fig. 2C). First, we analyzed a proportion of GFP-negative cells after MIS18 depletion as a positive control, confirming that the system functions as expected and responds to siRNA-mediated knockdown of the essential kinetochore gene MIS18, compared with cells treated with nt.siRNA.
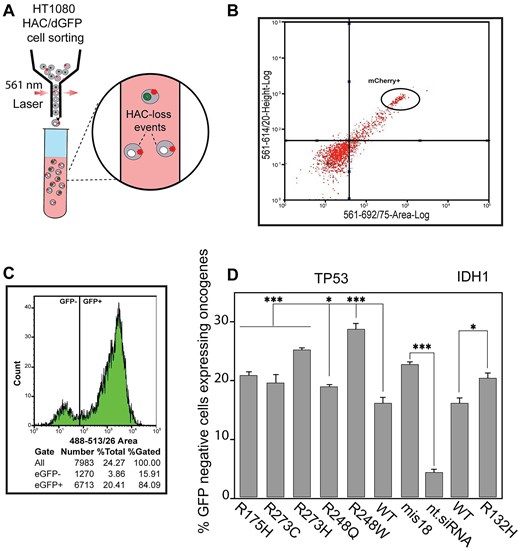
Mitotic stability of HAC/dGFP after TP53mut and IDH1mut expression. (A) Schematic representation of cell sorting where expression of missense mutations induces HAC/dGFP loss that is detected by loss of the GFP signal among the mCherry-positive cells. (B) Cell sorting of HT1080 HAC/dGFP cells with mCherry expression that confirms expression of TP53 and IDH1 genes carrying missense mutations. (C) Representative flow cytometry plot of HT1080 HAC/dGFP cells. Using flow cytometry, the number of GFP-negative cells was counted in the entire cell population (DAPI-positive cells). (D) Mitotic stability of HAC/dGFP determined as a proportion of the GFP-positive cells in the mCherry-positive population where either TP53mut or TP53WT or IDH1R132H or IDH1WT is expressed. Depletion of the MIS18 gene with siRNA was used as a positive control, compared with nt.siRNA. WTs are NCs, i.e. HT1080 HAC/dGFP cells are transfected with vectors expressing either TP53WT or IDH1WT gene. The statistical analysis was performed using non-parametric one-way ANOVA (Kruskal–Wallis test). Asterisks indicate a statistically significant difference (*P < .05; **P < .005; ***P < .001).
Next, we observed that both TP53mut and IDH1mut affected the rates of HAC loss, with the TP53R248W having the greatest effect among all the mutant TP53 (Supplementary Table S3). The percentage of GFP-negative cells was 28.83 [standard deviation (SD) ± 1.4; 1.8-fold elevation] (Fig. 2D and Supplementary Table S3). As seen, other TP53 variants (including TP53R273H, TP53R273C, TP53R175H, and TP53R248Q) as well as IDH1R132H also significantly elevated HAC loss. Thus, this approach could be applied to evaluate missense mutations leading to HAC loss. Three TP53 and one IDH1 pathogenic variants – TP53R273H, TP53R248W, TP53R248Q, and IDH1R132H – have been chosen for further analysis.
A micronucleus formation assay has been extensively used to evaluate chromosome stability [55]. Formation of MN (micronuclei) manifests natural chromosome loss. To investigate whether TP53R273H, TP53R248W, TP53R248Q, and IDH1R132H expression leads to instability of the natural chromosomes, we performed a micronucleus formation assay in HT1080 cells transfected by the vectors expressing these variants (Fig. 3A). Data in Fig. 3B and C are presented as percentages of the cells with MN observed over the total number of cells analyzed and in terms of fold induction comparing IDH1 and TP53 mutants versus WT (Supplementary Table S4). Our analysis revealed a statistically significant elevation of MN formation in TP53R248W and TP53R248Q expressing cells (Fig. 3B) with the percentage of MN cells being 29.83 (SD ± 3.76; 1.6-fold elevation) and 28.89 (SD ± 3.33; 1.6-fold elevation), respectively (Supplementary Table S4). While TP53R248W and TP53R248Q expressing cells demonstrated an elevated MN phenotype, the TP53R273H expression did not change the number of MN significantly compared with WT TP53 expression. Analysis of HT1080 cells expressing IDH1R132H also revealed a statistically significant elevation of MN formation compared with IDH1WT: 8.89 (SD ± 0.55; 1.3-fold elevation) (Fig. 3C and Supplementary Table S4).
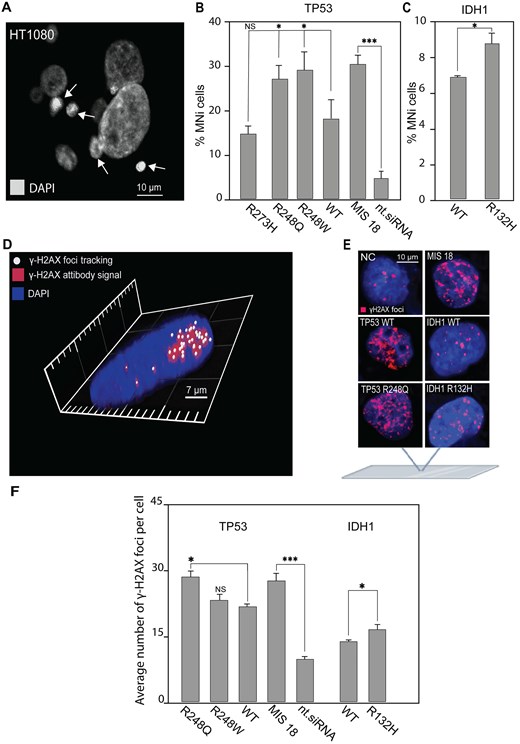
MN formation and accumulation of DSBs in HT1080 cells expressing either TP53mut or IDH1R132H. (A) Representative images of MN formation. White arrows point to MN. (B) The percentage of HT1080 cells with MN after transfection with the mutant variants of TP53 and (C) a mutant variant of IDH1 compared with TP53WT and IDH1WT. (D) γ-H2AX foci tracking microscopy. The image was obtained using the FV1200 confocal laser scanning microscopy system equipped with the objective lens (UPLSAPO 100×) (Olympus, Japan). A 405-nm LD Laser with Integrated Transmitted Light Photomultiplier Detector and 488-nm Argon Laser with High-Sensitivity Detector (GaAsP) was used. The image was acquired sequentially at 488 nm (Argon) and 405 nm (LD). (E) Examples of immunostaining of HT1080 cells after transfection with TP53WT and TP53mut or IDH1WT and IDH1R132H. γ-H2AX foci staining as a marker for DSBs. (F) The number of γ-H2AX foci in HT1080 cells 72 h after expression of TP53WT and TP53mut or IDH1WT and IDH1R132H. WT is HT1080 cell that expresses either TP53WT or IDH1WT gene. Depletion of the MIS18 gene with siRNA was used as a positive control, compared with nt.siRNA. Error bars correspond to an SD of replicates. Statistical analysis was performed using one-way ANOVA. Asterisks indicate a statistical significance (*P < .05; **P < .005; ***P < .001, relative to the control – WT or NC).
MN formation indicates possible DNA damage in HT1080 cells expressing TP53R248W, TP53R248Q, and IDH1R132H. Therefore, to investigate further the mechanism(s) by which expression of these mutated oncogenes lead to CIN, we examined DNA damage response of HT1080 cells after expression of TP53R248W, TP53R248Q, and IDH1R132H (Fig. 3D–F). For this purpose, we stained the cells with an antibody against phosphorylated histone γ-H2AX, a common marker for DSBs and DNA damage response [56–58], and then estimated the number of DSBs. The number of DSBs is expressed as the number of γ-H2AX foci per nucleus and as fold induction, comparing TP53mut and IDH1mut cells to TP53WT and IDH1WT cells. To avoid cross-detection, the images were acquired sequentially, and all taken Z-sections were condensed into one single plate to visualize all detectable γ-H2AX foci. The 3D image was acquired using layer-by-layer imaging and analyzed using Imaris Microscopy Image Analysis Software (Fig. 3D). The γ-H2AX foci labeling of HT1080 cells, that provides imaging of DSBs in chromatin (Fig. 3E), showed that expression of TP53R248Q enhances the level of DSBs (Fig. 3F). The average number of γ-H2AX foci per nucleus was equal to 28.5 (SD ± 1.46; 1.3-fold elevation) (Fig. 3F and Supplementary Table S5). Also, a higher DNA damage response was observed in IDH1R132H cells compared with IDH1WT (Fig. 3F). The average number of γ-H2AX foci per nucleus in IDH1R132H was 16.4 (SD ± 1.29; 1.2-fold elevation) (Supplementary Table S5).
To summarize, IDH1R132H and TP53R248Q pathogenic variants are likely to result in CIN. This conclusion is supported by observations of elevated HAC loss and increased MN formation. Additionally, the accumulation of γ-H2AX foci indicates an active DNA damage response, further highlighting potential genome instability associated with these mutations.
Cytotoxicity of CIN-inducing drugs and conventional temozolomide in the base-edited U87 MG glioma cell lines carrying IDH1R132H/WT and TP53R248Q/R248Q
Our results suggest that treatment of glioma cells carrying pathogenic variants by specific drugs can induce CIN that might have a therapeutical effect. To test this hypothesis, we first performed gene editing of IDH1 and TP53 in the glioma model cells, i.e. the U87 MG cell line (Fig. 4A). Using cytosine base editors (CBEs), composed of a Cas9-nickase (nCas9) and modified cytidine deaminase evoCDA1-BE4max or evoAPOBEC1-BE4max (Fig. 4A) [58], we generated the IDH1R132H/WT heterozygote and TP53R248Q/R248Q homozygote cell lines (Fig. 4B). Note that IDH1R132H and TP53R248Q mutations are commonly found in glioma patients [59–61]. More importantly the IDH1R132H/WT heterozygote and TP53R248Q/R248Q homozygote genotypes also represent common genotypes of glioma patients [56, 57]. In the IDH1R132H/WT heterozygous cell line, we observed a notable rise in IDH1 expression compared with WT cells (Supplementary Fig. S7). This could be explained by a compensatory mechanism of the remaining WT allele in the heterozygous context, which has been observed in patients harboring this mutation. In such cases, the WT allele continues to produce alpha-ketoglutarate (α-KG), which partially compensates for the rising levels of the oncometabolite 2-HG produced by the mutant allel [62–65, 66, 67].
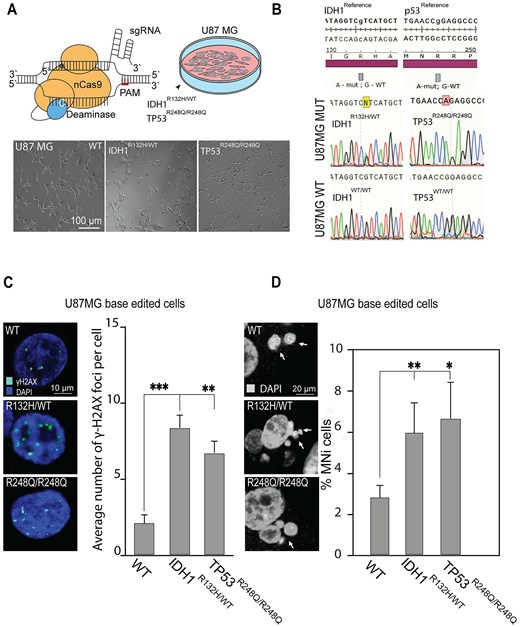
MN and DSB phenotypical assays in CRISPR/Cas9-edited U87 MG cells carrying IDH1R132H/WT or TP53R248Q/R248Q genotype. (A) CBEs, composed of an nCas9 fused to a cytosine deaminase, converted C to T. Bottom panel: Representative images of U87 MG cells after gene editing, where WT is U87 MG cells with native genotype (WT) expressing BFP and BE but without gRNA that underwent clonal selection for BFP expression. This is the control for bystander editing and unspecific effect of BE. Thus, the U87 MG cells carry a wild genotype (WT). (B) Confirmation of U87MG mutant and wild genotypes by Sanger sequencing, the TP53 and IDH1 loci of genomic DNA samples are presented IDH1R132H/WT; TP53R248Q/R248Q; IDH1WT/WT; TP53WT/WT. (C) Representative images of γ-H2AX foci labeling in U87 MG cells and an average number of γ-H2AX foci in U87 MG cells carrying either IDH1R132H/WT or TP53R248Q/R248Q genotype compared with the WT. (D) Representative images of MN formation in U87 MG cells carrying either IDH1R132H/WT or TP53R248Q/R248Q genotype. White arrows point to MN. The percentage of U87 MG cells with MN compared with the WT. Error bars correspond to an SD of replicates. Statistical analysis was performed using one-way ANOVA. Asterisks indicate a statistical significance (*P < .05; **P < .005; ***P < .001 relative to the control – WT).
In IDH1R132H/WT and TP53R248Q/R248Q base-edited U87 MG cells, we found that these missense mutations apparently cause elevation of γ-H2AX foci, a marker for DNA damage response [56] (Fig. 4C and Supplementary Table S6). The average number of γ-H2AX foci in IDH1R132H/WT cells was significantly higher than in cells with the IDH1WT/WT genotype: 8.29 (SD ± 0.93; 4.22-fold elevation; P < .05). TP53R248Q/R248Q cells displayed a milder yet statistically significant increase in γ-H2AX foci: 6.74 (SD ± 0.83; 3.43-fold elevation; P < .001). The rate of MN formation in U87 MG cells with either the IDH1R132H/WT or TP53R248Q/R248Q genotype was also significantly increased (Fig. 4D and Supplementary Table S7). The average number of MN in IDH1R132H/WT cells was higher than in the cells with the IDH1WT/WT genotype: 5.84 (SD ± 1.53; 2.13-fold elevation; P< .005). The TP53R248Q/R248Q cells also displayed a statistically significant increase of MN formation: 6.74 (SD ± 1.85; 2.45-fold elevation; P < .05). We also performed a proliferation assay on cells after base editing using the population of parental cells as a control. In this experiment, we observed a reduction of cell proliferation in both IDH1R132H/WT and TP53R248Q/R248Q cell lines compared with the parental cells (Supplementary Fig. S8).
To conclude, the reduction of cell proliferation, an elevated frequency of MN, and a statistically significant increase of γ-H2AX foci observed in TP53R248Q/R248Q and IDH1R132H/WT base-edited U87 MG cells indicate to chromosome damage and CIN.
To test whether the IDH1R132H/WT and TP53R248Q/R248Q glioma cells have a sensitivity to the CIN-inducing drugs, we compared the cytotoxicity of the conventional temozolomide with a set of CIN-inducing drugs such as paclitaxel, vincristine, and etoposide [68] in CRISPR/Cas9-edited U87 MG cells. First, using the MMT assay we determined the LC50 concentration of the drugs for each cell line (Supplementary Fig. S9 and Supplementary Tables S10–S13). All LC50 concentrations are listed in Table 1. The MTT assay allowed us to rank the drugs with respect to viability of the CRISPR/Cas9-edited U87 MG glioma cells carrying either the IDH1R132H/WT or TP53R248Q/R248Q genotype. As seen, the U87 MG IDH1R132H/WT cells are the most sensitive to paclitaxel while U87 MG TP53R248Q/R248Q cells are the most sensitive to temozolomide (Table 1).
To investigate whether treatment with paclitaxel leads to elevation of CIN markers in the cells with TP53R248Q/R248Q and IDH1R132H/WT genotypes, we performed MN and DSBs assays. Our analysis revealed a statistically significant elevation of MN formation in the IDH1R132H/WT cells treated with paclitaxel versus untreated (DMSO-treated NC cells). Data in Fig. 5A are expressed in terms of percentages of the cells with MN observed over the total number of cells and in terms of fold induction comparing mutant versus WT cells (Supplementary Table S8). The percentage of MN formation upon paclitaxel treatment in IDH1R132H/WT cells was 39.6 (SD ± 5.27; 1.7-fold elevation) (Fig. 5A). At the same time, TP53R248Q/R248Q cells did not show a statistically significant effect upon paclitaxel treatment compared with WT cells (Supplementary Table S8).
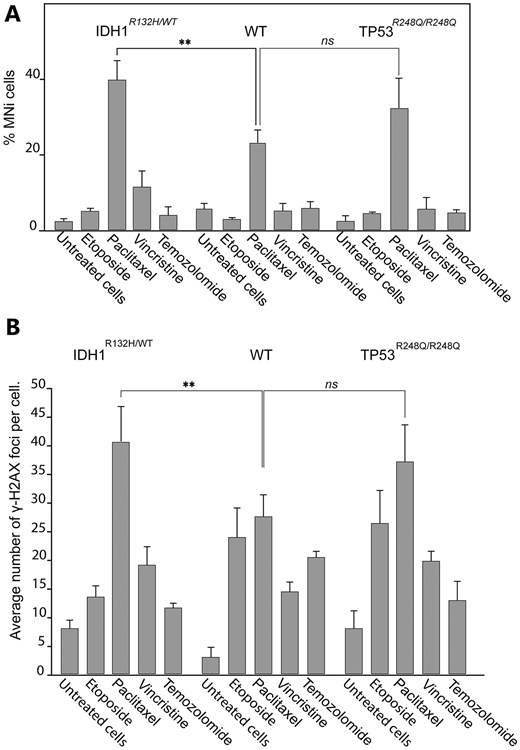
Accumulation of DSBs and MN formation in CRISPR/Cas9 edited U87 MG cells with either TP53R248Q/R248Q or IDH1R132H/WT genotype after drug treatments. (A) The percentage of MN in U87 MG IDHR132H/WT and TP53R248Q/R248Q cells after drug treatments compared with drug-treated U87 MGWT cells. (В) Accumulation of γ-H2AX foci in U87 MGWT, IDH1R132H/WT, and TP53R248Q/R248Q cells after drug treatments. The LC50 concentration of each drug determined for U87 MGWT cells (Table 1) was used. Error bars correspond to an SD of replicates. Statistical analysis was performed using one-way ANOVA. Asterisks indicate a statistical significance **P < .005 relative to the control – U87 MGWT drug-treated cells.
The γ-H2AX-antibody visualization of DSBs in IDH1R132H/WT cells revealed a statistically significant accumulation of DSBs upon paclitaxel treatment (Fig. 5B). The percentage of γ-H2AX foci was 41.2 (SD ± 6.22; 1.49-fold elevation) (Supplementary Table S9). At the same time, the TP53R248Q/R248Q cells did not reveal a significant difference compared with WT cells (Supplementary Table S9).
To summarize, CIN drug, aseptically paclitaxel significantly increases MN and γ-H2AX foci formation in the IDH1R132H/WT glioma cells, indicating that this drug causes chromosome damage that may lead to CIN in these cells. These data indicate a high potential of CIN-inducing drugs to target mitotic transmission of the natural chromosomes in the glioma cells carrying the IDHR132H/WT genotype.
We next compared the survival rates of the cells carrying either the TP53R248Q/R248Q or IDH1R132H/WT genotype upon treatment with etoposide, paclitaxel, vincristine, or temozolomide when a drug concentration was equal to LC50 for U87 MGWT cells (WT) (Fig. 6A and Supplementary Table S14). We observed some viability reduction of cells with the IDH1R132H/WT genotype (1.21 times lower than WT; P < .05) and a dramatic reduction of viability of TP53R248Q/R248Q cells compared with WT cells (3 times lower than WT; P < .01) upon temozolomide treatment. Unexpectedly, IDH1R132H/WT cells demonstrated an elevated viability after treatment with etoposide (1.58 times higher than WT; P < .01). The most dramatic effect on the viability of U87 MG cells with the IDH1R132H/WT genotype was observed after treatment with paclitaxel. The survival rate of WT cells was 12.2 times higher than IDH1R132H/WT cells (P < .001). Note that treatment with vincristine [this drug has an opposite effect on microtubule stability compared with paclitaxel (USP-1491332, CAS 33069–62-4)] demonstrated a higher viability of TP53R248Q/R248Q compared with WT cells (1.31 times higher than WT; P < .001). Overall data demonstrated a dramatic sensitivity of the base-edited U87 MG glioma cells with IDH1R132H/WT genotype to the CIN-inducing drug paclitaxel.
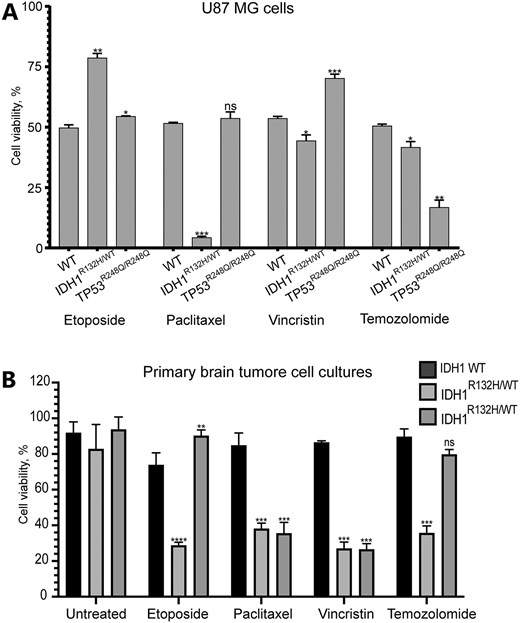
(A) Viability of drug-treated U87 MG cells carrying either IDHR132H/WT or TP53R248Q/R248Q or IDHWT (WT) or TP53WT (WT) genotype after drug treatment. (B) The survival rates of early-passage glioma cell cultures that propagated from primary cells derived from the patients with naturally occurred IDH1R132H/WT genotype upon treatment with etoposide, paclitaxel, vincristine, and temozolomide. The LC50 concentration of each drug used in the experiment is listed in Table 1. Error bars correspond to an SD of replicates. Statistical analysis was performed using Student’s t-test. Asterisks indicate a statistically significant difference (*P < .05; **P < .005; ***P < .001 relative to the control - U87 MGWT or IDH1WT.
To further investigate the potential mechanism underlying the impact of IDH1 mutation, we performed an additional experiment using HT1080 cells, which were initially used in the screening (Fig. 2). Specifically, we measured the occurrence of multipolar mitosis in cells expressing the IDH1R132H construct following treatment with paclitaxel (Supplementary Fig. S10). Our analysis demonstrated that paclitaxel treatment significantly increased the frequency of multipolar spindle formation in IDH1-mutant cells compared with cells expressing WT IDH1 and untreated WT control (Supplementary Fig. S10A). Across three experimental replicates, HT1080 cells expressing the IDH1R132H mutation exhibited a three-fold increase in multipolar spindles following paclitaxel treatment compared with cells expressing the WT construct. These findings suggest that the IDH1 mutation intensifies the disruptive effects of paclitaxel on spindle assembly, leading to lethal mitotic abnormalities, as observed in the treated samples (Supplementary Fig. S10B).
In order to support the statement that paclitaxel treatment increases MN and γ-H2AX foci formation in the IDH1R132H/WT glioma cells more than IDH1WT/WT, we quantified the natural dynamics of proxy markers (γ-H2AX, MN, and multipolar mitosis) under treatment with low-dose (LC25) concentrations of drugs used in this study, using the U87 MG cell line with both mutant and WT genotypes (Supplementary Fig. S11).
Soon after drug exposure at the first timepoint (6 h after drug exposure), we observed a significant DNA damage response caused by etoposide, indicated by the phosphorylation of histone H2A. γ-H2AX levels changed rapidly in response to drugs in both WT and mutant cells, which in line with the fact that γ-H2AX accumulation is one of the first DNA damage response mechanisms. We also observed that WT cells recovered faster after drug washing out, and the proportion of γ-H2AX-positive cells had decreased. The dynamic loss of γ-H2AX foci can be explained by DNA repair occurring in cells, while accumulation of γ-H2AX under paclitaxel treatment we observed after 12 h drug exposure can be explained by the indirect mechanism of the drug on DNA damage.
MN formation exhibited delayed responses (24–72 h) for drugs like paclitaxel and vincristine. These data can be explained by the fact that chromosome missegregation requires at least one mitosis to pass, and for that, a full cell cycle is necessary. At 48–96 h, distinct phenotypic outcomes became even more evident. For instance, IDH1R132H/WT cells showed increased MN formation and multipolar mitosis. We observed a more dramatic effect of the CIN enhancing drugs on IDH1R132H/WT cells, especially paclitaxel, which aligns with the main message of this study. To understand how the IDH1R132H mutation contributes to increased sensitivity to taxanes, it is essential to examine the mutation metabolic effects. The IDH1R132H variant catalyzes the abnormal conversion of α-KG into 2-HG, thereby altering the metabolic landscape. This metabolic alteration disrupts various cellular processes, notably affecting redox balance and biosynthetic pathways that are vital for cell division and maintaining chromosomal integrity [62, 65]. Specifically, 2-HG functions as an oncometabolite by inhibiting α-KG-dependent dioxygenases, including those enzymes responsible for DNA and histone demethylation. This inhibition leads to widespread epigenetic modifications, such as the hypermethylation of CpG islands, which can influence the expression of genes critical for mitotic regulation, chromosome segregation, and microtubule dynamics [64, 67]. These changes potentially explain the heightened vulnerability of IDH1-mutant cells to taxane-based therapies.
Finally, to address potential mechanisms of CIN phenotype accumulation in IDH1R132H/WT cell culture, we formulated hypothesis that 2-HG itself, as an oncometabolite, impacts CIN. As shown in Supplementary Fig. S11, cell treatment with 125 μM 2-HG demonstrated elevated levels of MN and multipolar mitosis in both WT and mutant U87 MG cells, supporting the hypothesis that 2-HG accumulation contributes to the phenotypes and drug sensitivity observed in IDH1R132H/WT-mutant cells.
Cytotoxicity of CIN-inducing drugs and conventional temozolomide in early-passage cell cultures carrying naturally occurred IDH1R132H/WT genotype
We next compared the survival rates of early-passage glioma cell cultures that propagated from primary cells derived from the patients with naturally occurred IDH1R132H/WT genotype upon treatment with etoposide, paclitaxel, vincristine, and temozolomide (Fig. 6B and Supplementary Table S14). For this purpose, we isolated two primary glioma cell lines with IDH1R132H/WT genotype from two different patients to exclude features of a particular cell sample. Full characterization of early-passage cell cultures is presented in our previous study [69]. In Supplementary Fig. S12, the genotyping and morphological characteristics are observed using the CD44 marker, that is commonly used to isolate different cancer stem cells, including CD44-enriched glioma stem cells [70].
In this experiment, to compare the data of base-edited U87 MGWT and early-passage glioma cell cultures carrying IDH1R132H/WT genotype, we used the same LC50 concentrations of drugs initially identified for U87 MG. Both early-passage cell cultures with IDH1R132H/WT revealed a significant reduction of cell viability upon paclitaxel and vincristine treatment (2.2 times lower than WT, P < .001; 3.2 times lower than WT, P < .005, respectively) (Fig. 6B). These data correlate with a dramatic effect of paclitaxel on the viability of the glioma cell line U87 MG with IDH1R132H/WT genotype (Fig. 6A). Temozolomide and etoposide treatment revealed a cytotoxicity only for one IDH1R132H/WT early-passage cell culture: viability was 2.6 times lower (P< .0001) than WT upon etoposide treatment, and 2.5 times lower (P < .001) upon temozolomide treatment, respectively (Fig. 6B and Supplementary Table S14).
In conclusion, our findings suggest a promising direction for adjuvant therapy in glioma patients carrying the IDH1R132H/WT genotype. By leveraging CIN-inducing drugs, which enhance CIN, we could potentially exploit the vulnerabilities created by the IDH1 mutation. This strategy may provide a novel therapeutic approach, amplifying the effects of standard treatments and targeting the specific genomic instability pathways active in these tumor cells. However further research is essential to validate this approach and optimize its application in clinical settings.
Discussion
IDH1R132H/WT and TP53R248Q/R248Q genotypes elevated CIN in gliomas
CIN is a fundamental property of many cancers and probably is one of the key mechanisms underlying oncogenesis as well as malignant tumor progression. A subset of CIN in tumors is likely driven by mutations in genes that maintain overall genomic stability, including structural maintenance of chromosomes and mitotic controls. In subsets of diffusely infiltrating adult gliomas of all histological and molecular classes, CIN manifests in genomic sequences’ CNVs and chromothripsis, eventually resulting in poor clinical outcome [71]. Such large-scale changes could drive abnormal gene copy number and expression patterns [72].
In this study, we obtained experimental evidence that the common gliomas missense mutations IDH1R132H and TP53R248Q have an impact on chromosome transmission fidelity and therefore genome stability. This conclusion was made based on the HAC-loss assay (Figs 1 and 2), micronuclei formation (Figs 3B and C and 4D) and accumulation of DSBs (Figs 3F and 4C). However, there is inconsistent result between the HAC-loss assay (Fig. 2D) and the MN formation assay (Fig. 3B), which shows disruption of HAC transmission while no MN (micronucleus) formation. Likely these results can be explained by distinct mechanisms by which the TP53R273H and TP53R248Q mutations impact genomic stability. TP53R273H, a DNA-contact mutation, subtly disrupts the protein’s ability to bind DNA and regulate key processes like cell cycle arrest and apoptosis. The HAC-loss assay, being highly sensitive to small changes in chromosome transmission, detects these subtle effects. In contrast, TP53R248Q, a structural mutation, causes more significant chromosomal missegregation, leading to increased MN formation, as seen in the MN formation assay. The differing sensitivities of these assays likely account for the discrepancies in their results. The mutations found in low-grade gliomas (Supplementary Table S1) cause GOF, dominant-negative phenotypes, and facilitate the expansion of glioma stem cells [11, 12]. The IDH1R132H tumors demonstrate an elevated CIN rate [19, 73] and an increased level of chromothripsis [21], which may leads to further progression of glioma [18], lower progression-free survival and overall survival intervals [21, 22, 74]. Moreover, higher initial histologic grade gliomas are characterized by altered expression patterns of genes related to CIN, elevated initial total copy number burden [74], aggressive behavior [22], and variable tumor response to standard therapy [75]. In line with this, the CIN rate increases with the grade of gliomas [19]. While IDH1R132H/WT genotype is considered as an unique feature of gliomas and acute myeloid leukemia [76], the TP53 is the most frequently mutated gene among multiple cancers [77]. It encodes the p53 protein that prevents the propagation of genomically unstable cells. The relation between p53 loss-of-function and CIN in cancer is delineated primarily from the strong correlations between TP53 mutations and aneuploidy in multiple tumor types [78, 79]. Recently, genome-editing of human derived colon organoids revealed that when TP53 is mutated, organoids spontaneously develop CIN and a more aggressive phenotype [80]. The TP53 hotspot mutations occur mainly in the DNA-binding domain (DBD), which results in high expression of oncogenic variants of the p53 protein with an aberrant GOF. Polymorphisms R175H, R273C, and R273H in the DBD of the TP53 gene are the most common in gliomas according to the International Agency for Research on Cancer. Upon the structure of the p53 DBD, TP53 mutations classify into mutations that disrupt amino acids directly by contacting DNA, which provides specificity to DNA binding, and mutations that alter the conformation of the DBD [81, 82]. TP53R175H mutation is Loop 2/Loop 3 interaction stabilizer of a structural group mutation of the p53 DBD. The R175 hotspot is located at the zinc-binding site near the DNA-binding interface, which is very important for maintaining structural stability. So, the p53-R175H by introduction of histidine residue causes distortions that directly interferes with zinc binding [83] and is called a structural mutation. R175H reduces the transcriptional activity of p73α and the transcriptional activity of TP53WT [84]. DNA-contact mutants retain the overall architecture of the DBD with loss of a critical DNA contact.
The TP53R248W- and TP53R248Q-mutant residues interact with DNA minor groove while TP53R273C and TP53R273H are major groove interacting residues. Our results demonstrate a consistent difference in the CIN level for R248Q and R248W mutations (Figs 2D and 3B), which can be explained by the differential proficiency of minor groove DNA repair system as a result of evasion of the common excision repair pathways neither recombination nor mismatch repair (MMR) [85] and the critical need in accurate DNA synthesis of correct interactions between a DNA polymerase and the DNA minor groove [86]. The activity of TP53 GOF mutants is different even if the mutations occur at the same codon [87]. It was reported that TP53R248Q and TP53R248W mutants have structural and biochemical differences [88]. R248 mutants lack sequence-specific DNA binding and transactivation functions and the ability to suppress cell growth. Functionally, TP53R248Q did not bind the DNA sequence recognized by TP53WT mainly due to the loss of major groove contacts, whereas TP53R248W did not bind DNA mainly due to the loss of minor groove contacts [89]. TP53R248Q activates the phosphorylation of Stat3 [90], inducing the overexpression of CCND1 allowing damaged DNA to be replicated by antagonizing the checkpoint-induced cell cycle arrest and disturbing DNA replication [91]. This mechanism could explain our results showing the predominance of DSBs in cells with expression of TP53R248Q (Fig. 3F). Furthermore, these genotypes affect pathways circumventing the therapeutic mechanisms of classical cytostatic drugs.
In general, gliomas have a higher repair activity of the genetic material [92]. However, non-specific genome methylation, caused by IDH R132H mutation, leads to an increase in CIN level, which can explain the prevalence of γ-H2AX foci in mutant cell lines. DSBs can lead to gene aberrations that could promote tumorigenesis [92] and if they are not appropriately repaired to chromosomal rearrangements [93, 94]. Thus, hypermethylation of CpG islands in the promoter regions of DNA repair genes [95], leading to sustained repression of transcription, presumably, explains the prevalence of DSBs in IDH1R132H (Fig. 3F) compared with WT cells despite the increased activation of the repair system. Increased level of CIN in the cell lines bearing the IDH1R132H/WT genotype is confirmed by the elevated percentage of GFP-negative cells (Fig. 2D) and the enhancement of MN formation (Figs 3C and 4D).
In the context of our findings, the IDH1R132H mutation appears to play a role in driving CIN and mitotic abnormalities (Fig. 2 and Supplementary Fig. S10). To address potential mechanism, we observed frequency of lethal multipolar mitoses (Supplementary Fig. S10). Our analysis revealed a significant increase in the rate of mitotic abnormalities in HT1080 cells expressing the IDH1R132H-mutant construct upon treatment with paclitaxel. This result is consistent with the original screening using the HT1080 HAC/dGFP assay, which revealed an elevated HAC-loss rate in HT1080 cells expressing the mutant IDH1. As a potential mechanism to explain the impact of the IDH1R132H mutation and why it increases sensitivity to taxanes such as paclitaxel, we must consider the metabolic impact of the IDH1 mutation. The IDH1R132H mutation results in the neomorphic conversion of α-KG into 2-HG, leading to a shift in the cellular metabolic state. This metabolic disruption has widespread consequences, particularly on redox balance and biosynthetic pathways, which are crucial for cell division and chromosomal stability [62, 65]. Specifically, 2-HG acts as an oncometabolite by inhibiting α-KG-dependent dioxygenases, including those involved in DNA and histone demethylation. This results in global epigenetic changes, such as hypermethylation of CpG islands, potentially affecting the expression of genes involved in mitotic regulation, chromosome segregation, and microtubule dynamics [64, 67]. This hypothetical possibility was validated in this study in the supplementary experiment (Supplementary Fig. S11).
Taxanes, such as paclitaxel, stabilize microtubules, preventing their normal depolymerization, which disrupts spindle formation and leads to multipolar spindles and mitotic arrest [96]. In IDH1R132H/WT cells, the 2-HG itself, as an oncometabolite, may impact chromosome transmission. As shown at Supplementary Fig. S11, cell treatment with 125 μM 2-HG demonstrated elevated levels of MN and multipolar mitosis in both WT and mutant U87 MG cells, supporting the hypothesis that 2-HG accumulation contributes to the phenotypes and drug sensitivity observed in IDH1R132H/WT-mutant cells. The global epigenetic changes, such as hypermethylation caused by the IDH1 mutation and 2-HG, may alter multiple processes from microtubule dynamics to DNA damage response, leading to the higher rates of multipolar spindles observed in Supplementary Figs S10 and S11. This can explain the enhanced sensitivity to CIN-inducing drugs.
This study does not directly provide detailed mechanisms or a comprehensive understanding of how IDH1R132H mutation contribute to CIN and enhance sensitivity to taxane-induced mitotic stress. However, these insights lay the groundwork for future mechanistic studies on the impact of IDH1 mutations on chromosomal stability and mitotic fidelity, potentially leading to more effective therapeutic strategies for gliomas harboring IDH1 mutations.
Sensitivity of cells harboring IDH1R132H/WT genotype to CIN-inducing and genotoxic drugs
While glioma patients carrying mutant IDH1 respond to temozolomide and radiotherapy, the mechanism by which IDH1 mutations contribute to gliomagenesis and the resultant changes in therapeutic response remains unclear. However, the impact of the missense mutation R132H in the IDH1 gene on chromosomal transmission suggests that CIN-enhanced, genotype-specific therapy for gliomas must be considered. Despite advances in molecular profiling, surgery, postoperative surveillance, and radiotherapy, new therapy development for glioma is limited due to incomplete knowledge of somatic glioma driving alterations and the suboptimal molecular disease classification. Molecular profiling can help to identify molecular correlations to individualize therapy and increase patient survival. Drugs that decrease genome structural complexity should be considered to improve existent chemo- and radiotherapy for IDH1- or p53-mutant tumors. IDHmut astrocytomas are significantly less aggressive than their IDHWT counterparts [18]. However, existing therapeutics approach for treatment of such tumors does not consider the specific trace of IDH mutation, e.g. for IDHWT and IDHR132H tumors the temozolomide is still a key drug.
In this study, we compared a sensitivity of malignant glioma U87 MG cells carrying either the IDH1R132H/WT or TP53R248Q/R248Q genotype introduced by CRISPR/Cas9 editing and early-passage glioma cell cultures with naturally occurred IDH1R132H/WT to the CIN-inducing drugs such as paclitaxel, vincristine, and etoposide versus to the conventional temozolomide. The compounds were ranked according to their chromosome destabilizing potency. We found that treatment of U87 MG cells carrying the IDH1R132H/WT genotype with paclitaxel leads to the highest cytotoxicity accompanied by MN formation (Fig. 5A), which manifests a high CIN in these cells. It is important that LC50 of paclitaxel for IDH1R132H/WT is 10 times lower than for WT cells and 21 times lower compared with conventional temozolomide treatment (Table 1). However, the effects observed in our study, particularly in Fig. 5A and B, focus on the specific accumulation of MN and DSBs as markers of CIN, rather than on overall cytotoxicity. TMZ is an alkylating agent that primarily induces DNA damage by methylating guanine at the O6 position, leading to mismatches during replication. This triggers the MMR system, which ultimately results in cell cycle arrest and apoptosis if the damage is not adequately repaired [97, 98]. However, this type of damage does not predominantly result in the formation of MN or DSBs, which are more direct markers of CIN and chromosomal missegregation. Instead, TMZ-induced DNA lesions are often repaired through base excision repair pathways, which do not typically lead to the type of genomic instability detected by the assays used in our study [99].
In contrast, paclitaxel stabilizes microtubules and disrupts normal mitotic spindle function, leading to mitotic arrest. This disruption directly contributes to the formation of DSBs and MN due to abnormal chromosome segregation and spindle checkpoint failure during mitosis [96]. The nature of paclitaxel mechanism makes it more likely to generate the type of chromosomal damage that our assays detect, explaining why paclitaxel-treated cells showed higher levels of these markers compared with TMZ-treated cells. In Fig. 6, it is evident that TMZ demonstrates a significant effect on the viability of IDH1-mutant cells, both in gene-edited U87 cells and early-passage cell cultures derived from tumors. This suggests that while TMZ might not induce high levels of MN and DSBs, it is still effective in reducing cell viability, likely through a different mechanism that does not involve the markers we used to assess CIN.
Thus, the absence of significant MN and DSB formation in TMZ-treated cells compared with paclitaxel does not diminish TMZ’s overall efficacy. Instead, it reflects the distinct mechanisms through which these drugs exert their effects on IDH1-mutant gliomas. However, the efficacy of TMZ, taken at the LC50 established for the gene-edited IDH1-mutant line, varies in experiments on patient-derived cells (Fig. 6B). In this regard, the search for specific adjuvant therapies based on other mechanisms of action is likely to be a promising approach to eliminate the individual sensitivity of tumors of different patients to TMZ.
In line with this, we confirmed the sensitivity of glioma cell cultures derived from patients with the IDH1R132H/WT genotype to paclitaxel and vincristine (Fig. 6B). Thus, CIN-enhancing drugs such as paclitaxel and vincristine, have a potential to serve as advantageous onco-therapeutic agents for glioma cancers when CIN is considered as a target for cancer therapy versus canonical chemotherapy with temozolomide. It is interesting that paclitaxel was used as the front-line chemotherapeutic drug for many types of cancer for decades. Our results suggest that development of CIN-enhancing therapy for glioma patients could be advantageous for adjuvant treatment. However, the clinical promise of targeting gliomas by paclitaxel that increase CIN warrants more study.
To conclude, this work represents the first systematic analysis of the chromosome destabilizing potency of the drugs that may be used in glioma therapy. In addition, a HAC/dGFP-based assay for measuring CIN seems to be a very sensitive system developed so far that can be applied to identify mutations that elevate chromosome missegregation and drive lethal aneuploidy. CIN-enhancing drugs such as paclitaxel can selectively elevate CIN in IDH1R132H/WT cells and promote cancer cell death. Observed results could lay the foundation for new treatment strategies of IDH1-mutant gliomas.
Acknowledgements
Author contributions: Conceptualization and Methodology: N.V.G.; Writing - Original Draft: N.K., N.V.G., V.V.K.; Resources: V.V.K. and N.V.G.; Investigation and Validation: N.V.G., I.N.B., A.P.S., V.S.G., D.L., N.A.S., and M.E.S.; Writing - Review & Editing: M.L.V., V.L., V.V.K.; Funding acquisition: V.V.K. and N.V.G..
Supplementary data
Supplementary data is available at NAR Cancer online.
Conflict of interest
None declared.
Funding
The experiments on plasmids construction, HAC loss, Micronucleus Assay, and γ-H2AX assays after ectopic expression of the IDH1 and TP53 gene variants were supported by the Russian Science Foundation (grant no. 21-75-00100). Experiments on glioma cell lines harboring driver mutations, early-passage cell culture establishing, and drug sensitivity experiments were supported by the Ministry of Science and Higher Education of the Russian Federation (project #FZNS-2023-0017).
Data availability
The data generated in this study are available upon request from the corresponding authors.

Comments