


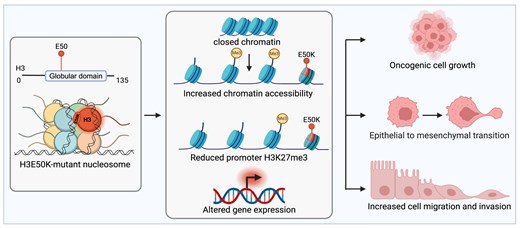
Abstract
Sequencing of human patient tumors has identified recurrent missense mutations in genes encoding core histones. We report that mutations that convert histone H3 amino acid 50 from a glutamate to a lysine (H3E50K) support an oncogenic phenotype. Expression of H3E50K is sufficient to transform human cells as evidenced by an increase in cell migration and invasion, and an increase in proliferation and clonogenicity. H3E50K also increases the invasive phenotype in the context of co-occurring BRAF mutations, which are present in patient tumors characterized by H3E50K. H3E50 lies on the globular domain surface in a region that contacts H4 within the nucleosome. We find that H3E50K selectively increases chromatin accessibility and perturbs proximal H3 post-translational modifications including H3K27me3; together these changes to chromatin dynamics dysregulate gene expression to support the epithelial-to-mesenchymal transition. Functional studies using Saccharomyces cerevisiae reveal that, while yeast cells that express H3E50K as the sole copy of histone H3 show sensitivity to cellular stressors, including caffeine, H3E50K cells display some genetic interactions that are distinct from the characterized H3K36M oncohistone yeast model. Taken together, these data suggest that additional H3 mutations have the potential to support oncogenic activity and function through distinct mechanisms that dysregulate gene expression.
Introduction
Routine patient tumor sequencing has unmasked recurrent somatic genomic alterations associated with cancer initiation, progression, and therapeutic response [1–4]. Collectively, these studies have led to the identification and subsequent characterization of novel tumor suppressors and oncogenes, many of which are involved in transcriptional regulation and include epigenetic enzymes or complexes involved in chromatin reading, writing, and erasure (e.g. NSD1, DNMT3A, IDH1, and many others) [1, 2, 5, 6]. These and other functional studies provide evidence that appropriate chromatin packaging, modification, and organization are key contributors to the regulation of gene expression, and show that the role of chromatin dynamics extends into other essential processes that are frequently perturbed in cancer, such as DNA repair. Taken together, these studies show that various mechanisms that perturb chromatin structure can contribute to oncogenesis.
Chromatin is organized into repeating nucleosome subunits, wherein each nucleosome is comprised of 146–147 bp of DNA, which wraps around a hetero-octamer of the histone proteins H2A, H2B, H3, and H4. Nucleosome-incorporated histones are subject to post-translational modifications (PTMs) directed by chromatin modifying enzymes, which enable context-dependent epigenetic regulation to inform gene expression. Studies demonstrate that histone genes harbor genomic alterations in cancers and that oncogenic-driver variants of histone proteins dysregulate gene expression to contribute to an oncogenic phenotype [7, 8], leading to the term ‘oncohistone’. Such oncohistone variants have been most extensively characterized in histone H3 [9–11]. Although the human genome encodes 15 histone H3 genes, for most characterized oncohistones, mutation of a single H3 allele is sufficient for the development of oncohistone-driven cancers, demonstrating a dominant effect of the oncohistone mutant protein.
While numerous mutations in histone genes have been identified [8, 12], only a few oncohistones have been functionally characterized. The H3K27M amino acid change occurs in at least 80% of pediatric diffuse intrinsic pontine gliomas (DIPGs) and has been reported with a lower frequency of 15%–60% in adult diffuse midline gliomas [13, 14]. H3K36M has been identified in several cancer types, including chondroblastoma and squamous cell cancers of the head and neck [15], while H3G34V/R and H3G34W/L predominantly occur in non-brainstem gliomas and bone cancers, respectively [8, 16]. More recent characterization of histone H2B mutations suggests that H2BE76K is found across cancer types, with a small preference for bladder and cervix [17]. Functional studies support the hypothesis that oncohistones alter the chromatin landscape and perturb gene expression through distinct mechanisms. While H3K27 and H3K36 harbor PTMs that contribute to chromatin accessibility [7], mutation that converts either residue to a methionine impairs the ability of H3 to support PTMs, including methylation that can impact gene expression on a larger scale. H3K27M mutant histones reduce H3K27 methylation in cis and in trans by impairing polycomb repressive complex 2 (PRC2) recruitment to the genome, thereby reducing H3K27me3 genomic spread [18, 19]. The subsequent reduction in deposition of the transcriptionally repressive H3K27me3 PTM supports expression of development-associated genes, causing a de-differentiated and aggressive tumor type [18, 20]. In contrast, expression of H3K36M mutant histones dominantly impairs the recruitment and function of H3K36 methyltransferases including NSD1 and SETD2 [21, 22]. Because nucleosomes characterized by H3K36me3 are poor substrates for PRC2, loss of gene body H3K36me3 supports the spread of H3K27me3, which can aberrantly repress gene expression [10]. H3G34 histones do not directly harbor PTMs, but alter proximal PTMs in cis, including H3K27 and H3K36 methylation [23, 24]. In contrast, the oncogenic H2BE76K mutation destabilizes the nucleosome core, leading to a more open chromatin conformation and enhanced gene expression [17]. While other oncogenic histone mutations have been proposed, to date, most remain uncharacterized.
Recent preclinical studies have focused on leveraging the gene expression changes defined in oncohistone expressing human cancers to identify viable therapeutic targets. While H3K27M DIPGs do not induce extensive global gene expression changes, H3K27M tumors show dysregulation of a subset of genes with oncogenic activity, some of which may be therapeutically actionable [18]. Gliomas, including H3K27M DIPG, are characterized by upregulation of the dopamine receptor gene DRD2 [25] and increased PI3K/AKT and RAS/MAPK signaling [26]. Initial proof-of-concept clinical trials using the DRD2 antagonist and mitochondrial ClpP agonist ONC201 in H3K27M-mutant diffuse midline glioma patients with recurrent disease demonstrate an improved patient quality of life and extended progression-free survival [25, 27]. Larger clinical trials have found that ONC201 treatment nearly doubles progression-free survival and overall survival in both nonrecurrent and recurrent diffuse midline gliomas [28]. Other proteins, including EZH2 and STAT3, have been proposed as viable targets for the treatment of H3K27M-mutant cancers [29, 30]. These preclinical and clinical studies support the hypothesis that many oncohistone-driven cancers may be therapeutically actionable. Moreover, given that some oncohistones change gene expression and alter chromatin dynamics (e.g. H2BE76K), the opportunities for therapeutic treatments and therapy combinations may be extensive.
A challenge with understanding how the amino acid changes that occur in oncohistones alter histone function in the context of chromatin is that histone genes are present in multiple copies, creating a situation where a single oncohistone protein is present in the background of wild-type histones. One approach that has been utilized to understand how specific amino acid changes alter histone function in the context of chromatin has been to employ model systems [31–34]. This approach benefits from the fact that the histone proteins are some of the most evolutionarily conserved proteins [35] and that simple model systems such as yeast have far fewer copies of histone genes than higher eukaryotes. For example, while there are 15 histone H3 genes in humans, the budding yeast Saccharomyces cerevisiae has only two histone H3 genes, HHT1 and HHT2. In a system such as budding yeast, one histone gene can be readily edited to model an oncohistone while either leaving the other histone gene intact, to assess whether the oncohistone protein confers dominant phenotypes similar to the situation in patients, or the second histone gene can be easily deleted to create cells that express the oncohistone as the sole histone present. In this latter scenario, studies can be performed to directly assess how the amino acid change present in the oncohistone alters the function of the histone protein. Studies in genetic model organisms can also take advantage of genetic strategies available in these systems to identify cellular pathways that are likely to be altered when oncohistones are present [34].
Here, we build upon publicly available data suggesting that H3E50K is a recurrent histone alteration in human cancer [7, 8]. Using a combined approach in untransformed human breast cells, BRAF-mutant human melanoma cancer cells, and a budding yeast model, we provide insight into this possible oncohistone H3E50K, which falls into a class of histone variants that have the potential to generate novel sites for PTMs by introducing a surface-exposed lysine. We show that overexpression of H3E50K modestly increases cell proliferation and clonogenic growth in human breast cells, demonstrating that expression of H3E50K is sufficient to transform human cells. However, cells expressing H3E50K as the only cancer-associated change or in the context of BRAF-mutant melanoma considerably enhance migratory and invasive potential, suggesting that H3E50K could be involved in cancer progression or other features common to metastatic disease. H3E50K expression selectively remodels chromatin accessibility, including changes in chromatin accessibility of selected transcription factor binding motifs and dysregulation of the H3 N-terminal tail and globular domain PTM profile, thereby perturbing gene expression. Compared with wild-type H3, gene signatures associated with the epithelial-to-mesenchymal transition (EMT) and oncogenic signaling pathways, such as KRAS and JAK/STAT, are increased in H3E50K breast cells. Genetic analyses exploiting a budding yeast model and comparing to an established H3K36M oncohistone yeast model [34] provide evidence to suggest that H3E50K may alter cell physiology through mechanisms that are distinct from H3K36M. These findings suggest that globular histone domain amino acid changes can support oncogenic growth and could contribute to advanced stage cancer by initiation of the metastatic cascade.
Materials and methods
Evaluation of patient tumor sample ploidy, allele frequency, and co-occurring genomic alterations
To understand clinical context of the H3E50K variant in cancer, patient tumor genomic data available in the cBioPortal and COSMIC databases were evaluated, and patient tumors characterized by the H3E50K variant were identified. Patient cancer pathology, allele frequency of H3E50K alteration, presence of metastatic disease, and ploidy score, if reported, were obtained. All genomic alterations within tumor samples expressing H3E50K alteration were collected and surveyed for co-occurring alterations in bona fide oncogenes and tumor suppressor genes. Findings were visualized in Adobe Illustrator and GraphPad Prism.
In silico modeling
PDB files 5X7X (Homo sapiens) [36] and 1ID3 (S. cerevisiae) [37] were used for all PyMOL imaging (Schrödinger). An overview of the human nucleosome structure was depicted in surface view, with DNA modeled in cartoon view. Higher resolution images were obtained for the modeling of E50, D50, K50, A50, and R50. For these images, the ‘mutagenesis’ function was used to make amino acid substitutions. The lowest numbered (highest populated) state/rotamer for each amino acid residue was utilized to produce the images, given that it did not produce any clashes with surrounding amino acids. Interactions with nearby residues and DNA were measured in angstroms in the E50 and E50K states. The ‘ray’ setting was used at 2400 × 2400 resolution to take all images, with ‘ray_shadow’ set to off.
Plasmids and cell lines
Wild-type Drosophila melanogaster H3.3 (NCBI NM_001273153), which shares 100% amino acid identity with H. sapiens H3.3, was cloned into the pBabePuro IRES GFP plasmid (Addgene, #14430). Wild-type H. sapiens H3.1 (NCBI, NM_003531.2) was cloned into the pBabePuro plasmid (Addgene, #1764). H3.3 and H3.1 mutations were introduced into the pBabePuro dH3.3-IRES GFP and pBabePuro plasmids, respectively, using site-directed mutagenesis (Agilent). Plasmids were verified by sequencing, packaged into retroviral particles, and used to generate stable human mammary epithelial cells (HMECs). Authenticated HMECs were purchased from ATCC, engineered to express dominant-negative p53 [38], and used for experiments within the first 20 passages. Authenticated A2058 cells were purchased from ATCC and used for experiments within the first 20 passages. Both HEMC and A2058 cultures were checked for mycoplasma every 3 months (Lonza) and maintained at 37°C and 5% CO2 in Dulbecco’s modified Eagle’s medium (DMEM)/F12 media supplemented with 0.6% fetal bovine serum (FBS), 0.01 μg/ml epidermal growth factor (EGF), 10 μg/ml insulin, 0.025 μg/ml hydrocortisone, 1 ng/ml cholera toxin, 2.5 μg/ml amphotericin B, and 1% penicillin–streptomycin, or DMEM supplemented with 10% FBS and 1% penicillin–streptomycin, respectively.
Human and yeast cell lysis and immunoblotting
Histones were acid extracted from human cells as described previously [39]. In brief, cells were lysed on ice in Triton extraction buffer [TEB; phosphate-buffered saline (PBS), 0.5% Triton X-100] supplemented with protease inhibitors (7.5 μM aprotinin, 0.5 mM leupeptin, 250 μM bestatin, 25 mM AEBSF–HCl). Cell lysates were centrifuged at 6500 × g at 4°C and histones were acid extracted from the resulting pellet with 1:1 TEB:0.8 M HCl. Histones were centrifuged at 4°C and the supernatant was precipitated with the addition of an equal volume of 50% trichloroacetic acid, then centrifuged at 12 000 × g at 4°C. Histones were washed one time in ice-cold 0.3 M HCl in acetone and two times ice-cold in 100% acetone before drying and resuspended in 20 mM Tris–HCl (pH 8.0), 0.4 N NaOH, supplemented with protease inhibitors (7.5 μM aprotinin, 0.5 mM leupeptin, 250 μM bestatin, 25 mM AEBSF–HCl). Protein lysate concentration was determined by Bradford assay (Bio-Rad). Fourty micrograms of acid-extracted proteins prepared in 1× LDA sample buffer (Invitrogen) containing 10% beta-mercaptoethanol were separated using sodium dodecyl sulfate–polyacrylamide gel electrophoresis (SDS–PAGE). Proteins were transferred to nitrocellulose membranes and blocked in Tris-buffered saline with Tween20 (TBST) + 5% milk. After primary and secondary antibody incubation, proteins of interest were visualized and quantified (Odyssey, Li-Cor).
Whole cell lysate was produced from human cells by lysing cells on ice in immunoprecipitation buffer (IPB) [20 mM Tris–HCl (pH 7.5), 150 mM NaCl, 5 mM MgCl2, 1% NP-40] supplemented with protease inhibitors [7.5 μM aprotinin, 0.5 mM leupeptin, 250 μM bestatin, 25 mM AEBSF–HCl]. Soluble proteins were separated via centrifugation at 15 900 × g for 10 min, transferred to a clean microcentrifuge tube, and protein concentration was determined by Bradford assay (Bio-Rad). Thirty micrograms of whole cell lysate prepared in 1× lithium dodecyl sulfate (LDS) sample buffer (Invitrogen) containing 10% beta-mercaptoethanol was separated using SDS–PAGE. Proteins were transferred to nitrocellulose membranes and blocked in TBST + 5% milk. After primary and secondary antibody incubation, proteins of interest were visualized and quantified (Odyssey, Li-Cor).
For yeast experiments, the indicated yeast strains were grown overnight at 30°C to saturation in 5 ml YEPD (yeast extract, peptone, and dextrose) media. Cells were diluted in 100 ml YEPD to a starting OD600 = 0.1 and grown at 30°C to a final OD600 = 1.0. Cells were pelleted by centrifugation at 1962 × g in 50 ml tubes, washed in ddH2O, transferred to 2 ml screwcap tubes, washed again in ddH2O, and pelleted by centrifugation at 900 × g. Pelleted cells were washed in Buffer 1 [1 M sorbitol, 50 mM Tris–HCl (pH 7.5), 5 mM MgCl2] and weighed. Samples were separated into two tubes to be <100 mg each. Cells were resuspended in 1 ml Buffer 1, and 5.4 μl 2-mercaptoethanol (14.3 M) was added to each. Samples were incubated on ice for 10 min. Cells were pelleted at 4°C at 900 × g and resuspended in 1 ml Buffer 1 plus 600 μg zymolyase 20T, then incubated at 35°C for 20 min with gentle agitation. Then, 0.7 ml Buffer 2 [1 M sorbitol, 50 mM 2-(N-morpholino)ethanesulfonic acid (MES) (pH 6), 5 mM MgCl2] plus protease inhibitors (Thermo Fisher Scientific, A32955) were added, and cells were pelleted at 1233 × g in 4°C. Samples were resuspended in 0.7 ml Buffer 3 [50 mM MES (pH 6), 75 mM KCl, 0.5 mM CaCl2, 0.1% NP-40] plus protease inhibitors, incubated on ice for 5 min, and pelleted at 12 175 × g at 4°C. Samples were resuspended in 0.7 ml Buffer 4 [10 mM MES (pH 6), 430 mM NaCl] plus protease inhibitors and 0.5% IGEPAL CA-630, incubated on ice for 5 min, and pelleted at 14 489 × g. Finally, samples were resuspended in 0.7 ml Buffer 4 plus protease inhibitors, incubated on ice for 5 min, and pelleted at 17 005 × g. Pellets were resuspended in 120 μl 0.25 M HCl and spun in a rotor wheel at 4°C for at least 2 h. Samples were pelleted at 14 489 × g in 4°C, and the supernatants were combined with 8 volumes of acetone and incubated overnight at −20°C. Extracts were pelleted at room temperature at 1962 × g, resuspended in acidified acetone (120 mM HCl in acetone), and pelleted 12 300 × g. Extracts were washed in acetone and pelleted. Extracted histones were air dried and resuspended in 50 μl ddH2O plus 1 μl NaOH. Protein lysate concentration was determined by Pierce BCA Protein Assay Kit (Life Technologies). Protein lysate samples (20–25 μg) in reducing sample buffer [50 mM Tris–HCl (pH 6.8), 100 mM Dithiothreitol (DTT), 2% SDS, 0.1% bromophenol blue, 10% glycerol] were resolved on 4%–20% Criterion™ TGX Stain-Free™ precast polyacrylamide gels (Bio-Rad). Protein lysate samples were transferred to nitrocellulose membranes (Bio-Rad) in Dunn carbonate buffer [10 mM NaHCO3, 3 mM Na2CO3 (pH 9.9), 20% methanol] at 22 V for 90 min at room temperature, and the resulting membranes were blocked in TBST + 5% milk. After primary and secondary antibody incubation, proteins of interest were visualized and quantified using the ChemiDoc MP Imaging System (Bio-Rad).
For human and yeast studies, the primary antibodies used were as follows: H3 (Abcam 1791; 0.1 μg/ml), H3.3 (Abcam 17 899; 1.71 μg/ml), TY1 (Diagenode C15200054; 2.2 μg/ml), HA (CST 6E2; 1:1000), H3K4me3 (Abcam 8580; 1 μg/ml), H3K4me2 (Abcam 32 356; 0.28 μg/ml), H3K4me1 (Abcam 8899; 2 μg/ml), H3K27me3 (CST 9733S; 1:1000), H3K27ac (CST 8173S; 1:1000), H3K36ac (Abcam 175 038; 4 μg/ml), H3K36me3 (Abcam 9050; 1 μg/ml), H3K56ac (Invitrogen PA5-40101; 1.6 μg/ml), H3K79me3 (CST 4260S; 1:1000), actin (Millipore MAB1501, 1:1000), N-Cadherin (CST 13116T; 142 ng/ml), E-Cadherin (CST 3195T; 54 ng/ml), and p53 (Santa Cruz DO-1; 100 ng/ml). Secondary antibodies include the fluorophore-conjugated goat anti-rabbit 680 IgG (LiCor, 925–68 071; 1:10 000) and goat anti-mouse 800 IgG (LiCor, 926–32 210; 1:10 000).
Quantitation of histone immunoblotting
The protein band intensities from immunoblots were quantitated using Image Lab software (Bio-Rad) and mean fold changes in protein levels were calculated in Microsoft Excel (Microsoft Corporation). The protein band intensity was normalized for each endogenous histone PTM level to the total endogenous H3 band. The mean fold change was further calculated related to the wild-type H3 sample for each PTM. The data were represented as an average fold change compared with wild-type with standard deviation (n = 3). The mean fold changes in histone H3K36me3 levels in oncohistone mutant cells relative to the wild-type control were calculated from two immunoblots. H3K36me3 band intensity was first normalized to total histone H3 band intensity and then normalized to H3K36me3 intensity in wild-type cells. The mean fold changes in H3K36me3 levels in oncohistone mutant cells relative to the wild-type control were graphed in GraphPad Prism 8 (GraphPad Software, LLC) with standard error of the mean error bars.
Transformation assays
To measure cell proliferation, 3000 cells/well were seeded in a 96-well plate. Cells were fixed at 24, 48, 72, and 96 h post seeding in 50% EtOH and 10% acetic acid, and crystal violet stained in 0.2% (w/v) crystal violet in 10% EtOH. Cells were destained in destaining solution (40% EtOH and 10% acetic acid) and crystal violet quantitated at OD595 (Biotek). To measure cell proliferation over an extended time period (15–18 days), 25 000 cells were seeded in a 24-well plate and cultured for 3 days with changing media every second day. After 3 days, the cells were trypsinized, counted, and 25 000 cells were re-seeded. At the end of the experiment, the total number of cells was calculated. To measure cell clonogenicity, 500 cells/well were seeded in a six-well plate and incubated for a total of 15 days with media change every 4 days, after which cells were fixed and crystal violet stained as described above. Plates were imaged, destained, and crystal violet quantitated at OD595 (Biotek). To perform the cell confluence assay for population doubling, 2000 cells were seeded in a 96-well plate (Corning, 353072) in triplicate. The plate was scanned in Incucyte (Sartorius) at 37°C with 5% CO2 for 96 h using a time-lapse system that imaged the cell confluency every 2 h. At the end of the experiment, the data were analyzed using Sartorius Rev2 software, and the growth curve was plotted based on the cell confluency over time.
Wound closure assays
Total 4 × 10⁵ cells were seeded in duplicate in 12-well plates. Once confluent, cells were scratched with a sterile p200 pipette tip. Images of the wound were collected at 0, 5, and 12 h post scratch (Leica Delimited). The rate of cell migration and percent wound closure was calculated using Image J.
Transwell migration and invasion assays
For transwell migration assays, 1 × 10⁵ cells were seeded in duplicate in an 8.0-μm transwell 24-well plate insert (Corning, 353097) in 100 μl of DMEM/F12 media without growth factors and serum and 600 μl full growth media in the bottom of the well. Nonmigrated cells were removed from the upper transwell membrane with a cotton swab after 8 h. Transwell membranes were fixed in 70% EtOH for 10 min, allowed to dry for 10 min, followed by crystal violet staining in 0.2% (w/v) crystal violet in 10% EtOH. Excess crystal violet was removed from the upper transwell membrane with a cotton swab, and the inserts were washed in deionized water. After drying, the membrane was cut from the insert and mounted on glass slides. Images were collected (Leica Delimited) and migrated cells were quantitated with Image J. For transwell invasion assays, 8.0-μm transwell 24-well plate inserts were coated with 100 μl of 1 mg/ml matrigel (Corning, 254234). The plates coated with matrigel were incubated for 1 h at 37°C to solidify. Total 1 × 10⁵ cells were seeded in duplicate on the top of matrigel-coated insert in 100 μl of DMEM/F12 media without growth factors and serum and 600 μl full growth media in the bottom of the well. Cells were incubated for 48 h for invasion and processed as described for the transwell migration assays.
ATAC-seq library preparation
Bulk assay for transposase-accessible chromatin with sequencing (ATAC-seq) libraries were prepared following the previously established Omni-ATAC protocol [40] with minor modifications. Briefly, cells were counted and 50 000 cells were washed with cold ATAC-seq resuspension buffer (RSB) [10 mM Tris–HCl (pH 7.4), 10 mM NaCl, 3 mM MgCl2 in water), and permeabilized with ATAC-seq lysis buffer (RSB supplemented with 0.1% NP-40, 0.1% Tween-20, and 0.01% digitonin). For the transposition step, cells were resuspended in 44 μl of transposition mix (25 μl 2× tagmentation buffer, 2.5 μl transposase, 16.5 μl PBS, 0.5 μl 1% digitonin, 0.5 μl 10% Tween-20) and incubated at 37°C for 40 min in a thermomixer with shaking at 1000 RPM. The DNA fragments were cleaned up with the DNA Clean & Concentrator kit (Zymo Research, D4014) and polymerase chain reaction (PCR)-amplified for 8–12 cycles with Illumina Nextera adaptors using KAPA SYBR® FAST (Roche, 07959427001). The number of PCR cycles was determined based on monitoring for a change in fluorescence of 100 000 or a ΔRn of 0.1, after which PCR was stopped and the samples removed. After amplification, a second cleanup with 1.8× Ampure XP beads (Aline Biosciences, Catalogue No. C-1003–50) was performed and library eluted in 10 mM Tris–HCl. Fragment size distribution and concentration were evaluated via Bioanalyzer High Sensitivity DNA kit (Agilent, 5067–4626), and libraries were sequenced to a target depth of at least 75 million paired-end reads per sample (Novogene).
ATAC-seq analysis
Reads were checked for quality using FastQC and FastQ screens. Reads were then trimmed using Trim Galore! (https://www.bioinformatics.babraham.ac.uk/projects/trim_galore/), aligned to hg38 with Bowtie 2 [41], and files that had an alignment rate of >80% were used. Mitochondrial reads, duplicates, nonunique alignment reads, and black-listed reads were removed using SAMtools [42], PicardTools (http://broadinstitute.github.io/picard), and Bedtools [43]. The final .bam files were then indexed and imported into RStudio for peak calling using the ChrAccR package (https://greenleaflab.github.io/ChrAccR/authors.html#citation) and MACS2. In Rstudio, overall differential accessibility and differential transcription factor motif enrichment was performed using ChrAccR. For RNA/ATAC-seq integration, chromosomal coordinates of regulatory regions of previously identified EMT-related genes were located using a published H3K27ac ChIP-seq dataset (GSE96352) and the BiomaRt package [44]. Nearest genes were annotated with ChIPseeker [45]. This dataset was then used to filter differentially accessible regions (DARs) using Granges. Graphable matrix files were generated using Deeptools ComputeMatrix [46], and heatmaps were generated via plotHeatmap.
CUT&Tag analysis
Total 250 000 cells were processed per condition, following the manufacturer’s instructions (EpiCypher CUTANA CUT&Tag), using 1 µg H3K27me3 antibody (CST 9733). The resulting library-prepared DNA was sequenced to a target depth of a minimum of 25 million paired-end (PE150) reads per sample (Novogene). The resulting FASTQ files were processed by first trimming adapter sequences with Trim Galore!. FASTQ files were aligned to the GRCh38 human genome using Bowtie 2 [41]. Files were then converted to BAM files, and reads were sorted using SAMtools [42]. Duplicate reads were marked using PicardTools. BigWig files were then generated using bamCoverage and reads were aligned to the human genome counted with SAMtools. Graphable matrix files were generated using Deeptools ComputeMatrix [46], and heatmaps were generated via plotHeatmap centered around transcription start sites.
RNA isolation, sequencing, and analysis
RNA was isolated from HMECDD cells using the RNeasy Isolation Kit (Qiagen) according to the manufacturer’s instructions. Sequencing and analysis were performed as previously described [47]. In brief, preparation of the RNA library and transcriptome sequencing was conducted by Novogene Co., Ltd. The resulting FASTQ files were aligned to the human reference genome (build GRChg38) and transcript abundance was quantified using salmon (Illumina DRAGEN). The DESeq2 package was used to identify differentially expressed transcripts between the H3.3E50K and wild-type H3.3 expressing HMECDD cells. Transcripts with adjusted P-value ≤ .05 and |log2(FoldChange)| ≥ ±1.5 were considered differentially expressed. Fast gene set enrichment analysis (FGSEA) of the pre-ranked gene list was performed using clusterProfiler and fgsea, using the MSigDB hallmark gene set.
S. cerevisiae strains and plasmids
Chemicals used for experiments with S. cerevisiae were obtained from Sigma–Aldrich (St Louis, MO), United States Biological (Swampscott, MA), or Thermo Fisher Scientific (Pittsburgh, PA) unless otherwise noted. All media were prepared by standard procedures [48]. All DNA manipulations were performed according to standard procedures [49]. Saccharomyces cerevisiae strains and plasmids used in this study are listed in Supplementary Table S2. The PCR- and homologous recombination-based system for generating targeted mutations in histone genes in budding yeast cells has been described [50]. Strains to model oncohistones—hht2-K36M hht1Δ (ACY2822), hht2-E50K hht1Δ (ACY2972), hht2-E50R hht1Δ (ACY2968), and hht2-E50A hht1Δ (ACY2964), which harbor mutations at the codons encoding the 36th or 50th histone H3 residue at the endogenous HHT2 gene—were generated using the parental hht2Δ::URA3:TRP1 strain (yAAD165) and the strategy detailed previously [50, 51]. The endogenous HHT1 gene in these oncohistone model strains was subsequently deleted and replaced via homologous recombination with a kanMX marker cassette. The isolation of the YEp352 genomic DNA plasmids from the suppressor screen – HHT2_HHF2 (pAC4145), SGV1 (pAC4132), ESA1 (pAC4149), TOS4_YLR184W (pAC4150), PHO92_WIP1_BCS1 (pAC4160) – and the YEp352 plasmids containing cloned S. cerevisiae genes – HHT2 (pAC4201), ESA1 (pAC4190), TOS4 (pAC4196), PHO92 (pAC4193), SGV1 (pAC4208) – is described in [34].
S.cerevisiae growth assays
To examine the growth of oncohistone model strains, wild-type (yADP127), hht2-K36M hht1Δ (ACY2822), hht2-E50K hht1Δ (ACY2972), hht2-E50R hht1Δ (ACY2968), and hht2-E50A hht1Δ (ACY2964) strains were grown overnight at 30°C to saturate in 2 ml YEPD media. Cells were normalized to OD600= 5, serially diluted in 10-fold dilutions, spotted on control YEPD media plates or YEPD media plates containing 18 μg/ml camptothecin, 6 μg/ml bleomycin, or 15 mM caffeine and grown at 30°C for 2–5 days. Cells were also grown on Ura- plates containing 2% glucose with or without 15 mM caffeine to ensure plasmid expression. To test the effect of the H3K36 mutant suppressor plasmids on the growth of H3E50 mutant strains in the presence of caffeine, wild-type (yADP127), hht2-E50K hht1Δ (ACY2972), hht2-E50R hht1Δ (ACY2968), and hht2-K36M hht1Δ (ACY2822) cells transformed with YEp352, HHT2 (pAC4145), ESA1 (pAC4149), TOS4 (pAC4150), PHO92 (pAC4160), or SGV1 (pAC4132) plasmid were grown overnight at 30°C to saturation in 2 ml Ura- media containing 2% glucose. Plasmids in Fig. 7 were isolated directly from the screen in Lemon et al. (G3 2022), and marked plasmids from Supplementary Fig. S7 were created by cloning. Cells were normalized to OD600 = 5 and serially diluted as previously described, spotted onto control YEPD media plates or YEPD media plates containing 15 mM caffeine, and grown at 30°C for 2–5 days. Cells were also spotted onto control Ura- plates or Ura- plates containing 15 mM caffeine.
Statistical analysis
All experiments were performed in three independent experiments unless otherwise noted. Mean ± SD are reported unless otherwise noted. Statistical significance (P ≤ .05) of differences between two groups was determined by Student’s t-test. To compare average allele frequency and aneuploidy scores amongst alterations of H3E50, H3K27, and H3K36, a one-way ANOVA was performed using GraphPad Prism. To analyze the probability of cancer diagnosis associated with alterations in H3 residues, the gnomAD database was surveyed for alterations in all H3 encoding genes for variants that recur in an undiagnosed population. The number of altered alleles was determined and compared with the number of alterations of H3 residues found in cBio and COSMIC databases using a logistic regression model and visualized in R.
Results
Mutations that alter H3E50 are recurrent in human cancers
To date, most established histone H3 oncohistones function through direct perturbation of a known site of histone PTM (e.g. H3K27M and H3K36M/R), or an amino acid proximal to H3K36 (e.g. H3G34V/R/W/L) [7, 8]. These oncogenic changes can disrupt histone H3 PTMs in cis and/or in trans, imparting functional changes that result in transcriptional dysregulation. To determine whether additional histone mutations are associated with human cancers, we surveyed the COSMIC and cBioPortal publicly available adult human cancer datasets and identified recurrent mutations that alter H3E50 [52, 53] (Fig. 1). The E50 residue is located within the H3 globular domain (Fig. 1A–C). H3E50 is surface accessible within the nucleosome and located in close proximity to DNA (Fig. 1B and C). Mutations that alter H3E50 were identified in 37 adult cancer cases (Fig. 1D). In contrast to H3K36M and H3K27M, which predominantly occur in one of the two H3.3 (H3-3A or H3-3B) genes, H3E50 mutations primarily occur in H3.1 genes, with cases also identified in H3.2 and H3.3 genes (Fig. 1D and Supplementary Fig. S1A). With respect to the specific amino acid change introduced, H3E50K and H3E50D are the most common, although other changes were detected, including H3E50Q and H3E50*, with the latter introducing a premature stop codon (Fig. 1E). Genomic alterations affecting H3E50 were detected most frequently in lung and breast cancers, although H3E50 mutations were detected in a variety of other cancer types, including melanoma (Fig. 1F and G and Supplementary Fig. S1B). We surveyed publicly available data to determine the number of cancer-associated mutations in all 15 histone H3 genes across adult cancers, and while there is a low degree of mutations that occur across the H3 genes, nucleotides that encode H3E50, along with H3K27 and H3K36, harbor a higher mutation number than the average (Supplementary Fig. S1C). We also queried all 15 H3 genes in the gnomAD database that surveys single nucleotide polymorphisms in non-diseased populations [54], and found that H3E50 alteration occurs at background levels (Supplementary Fig. S1D). To extend the analysis of missense mutations that alter H3E50, we investigated whether genomic alterations that change H3E50K co-occur with established oncogenic driver and/or tumor suppressor alterations in cancer. Using the cBioPortal and COSMIC databases, we identified co-occurring genomic alterations in tumor suppressors (e.g. TP53, NF1, and PTEN) and oncogenes (e.g. PIK3CA, BRAF, and KRAS). In fact, characterized oncogenic driver mutations in BRAF (V600E), PIK3CA (E545K and H1047R), and KRAS (K117N) were found in patient tumors expressing the H3E50K variant (Fig. 1G and Supplementary Table S1). These results suggest that considering the functional consequences of histone mutations in the context of these co-occurring alterations could be critical. Notably, metastatic disease was also reported for 8 of 13 (61.5%) tumor specimens characterized by H3E50K variant expression (Fig. 1G).
![H3E50 mutation occurs in human cancers. (A) Schematic of H3.3 highlighting the E50 residue within the globular domain. Top (B) and side view (C) of H3E50 and H3K36 within the nucleosome. The nucleosome, including DNA, H3K36, and H3E50, are modeled with PDB 5X7X [36]. (D) Survey of E50 mutation abundance in histone H3 genes encoded in the human genome. (E) Identity of defined H3E50 mutations in human cancers. (F) Survey of H3E50 mutation abundance across human cancer types. (G) Overview of cancer pathology, ploidy score, co-occurring genomic alterations, and total number of genomic alterations in patient tumors characterized by H3E50K variant expression. (H) Variant allele frequency (VAF) of the H3E50 genomic alterations compared with known oncohistones H3K27 and H3K36 observed in patient tumors defined in cBioPortal. One-way ANOVA was performed for statistical significance. (I) Boxplots showing aneuploidy score for patient samples reported in cBioPortal. One-way ANOVA was performed for statistical significance. (J) Logistic regression model demonstrating the probability of cancer diagnosis associated with variants of H3, where 0 = no diagnosis and 1 = cancer diagnosis. (K) In silico modeling of human H3E50, H3D50, and H3K50, using PDB 5X7X [36].](https://oup.silverchair-cdn.com/oup/backfile/Content_public/Journal/narcancer/7/1/10.1093_narcan_zcaf002/5/m_zcaf002fig1.jpeg?Expires=1750268767&Signature=lOEV9QrORY-wbI-j~8vHbVr-FMsmtBVH35ZXQkaI~NQOY~aZf~lNhih4Pu6tCBbbYF2e9thMeLDq9Z0CkF~Q6riwDtSHNXdTzIhSwBsADuyCtW0H4EWDGKubGl3nLavEFV0mhijaoR-vwZFuu5BVQobvAvFoiePOjmUcRflYJ8MHq-ykbqiWjQqGPRvwuCstO~1XIRb--ZHmxHa~S-ecvKrfIeIzRzvczNMlidqYbLx1XQ9oJQknc~92rfy3gavSOPk4cZ4fCXRCQKDoimjMokA1r9abcReqYUxfP1MF9Wxr7vZrZPB~DxGr7~oRNO4g-fbXEF6mRwC6V8jI0dYDHw__&Key-Pair-Id=APKAIE5G5CRDK6RD3PGA)
H3E50 mutation occurs in human cancers. (A) Schematic of H3.3 highlighting the E50 residue within the globular domain. Top (B) and side view (C) of H3E50 and H3K36 within the nucleosome. The nucleosome, including DNA, H3K36, and H3E50, are modeled with PDB 5X7X [36]. (D) Survey of E50 mutation abundance in histone H3 genes encoded in the human genome. (E) Identity of defined H3E50 mutations in human cancers. (F) Survey of H3E50 mutation abundance across human cancer types. (G) Overview of cancer pathology, ploidy score, co-occurring genomic alterations, and total number of genomic alterations in patient tumors characterized by H3E50K variant expression. (H) Variant allele frequency (VAF) of the H3E50 genomic alterations compared with known oncohistones H3K27 and H3K36 observed in patient tumors defined in cBioPortal. One-way ANOVA was performed for statistical significance. (I) Boxplots showing aneuploidy score for patient samples reported in cBioPortal. One-way ANOVA was performed for statistical significance. (J) Logistic regression model demonstrating the probability of cancer diagnosis associated with variants of H3, where 0 = no diagnosis and 1 = cancer diagnosis. (K) In silico modeling of human H3E50, H3D50, and H3K50, using PDB 5X7X [36].
To address whether H3E50 alterations could function as oncogenic driver events, we examined the allele frequency. H3E50 variant allele frequency (VAF) ranged from 20%–50%, with an average H3E50 VAF of 27% (0.27 ± 0.15) (Fig. 1H) and patient tumors characterized by H3E50 variant expression have an average reported aneuploidy score of 11.43 and median of 9 (Fig. 1I). Although we observed a significant difference in allele frequency between H3E50 and H3K27 alterations, no significant difference was observed between H3E50 and H3K36 (Fig. 1H). Similarly, we did not observe a statistical difference in aneuploidy score between H3E50 variants and either H3K27 or H3K36, which correspond to the known oncohistones H3K27M and H3K36M, respectively (Fig. 1I). The allele frequency, taken together with average tumor ploidy, suggests that H3E50 alterations including H3E50K are likely acquired subclonal mutations and not germline mutations or polymorphisms. We also used a logistic regression model to determine the statistical probability of the association of H3 alterations with a cancer diagnosis. While this approach does not consider confounding variables such as age, race, environmental factors, lifestyle choices, or cancer predisposing conditions, this model suggests that an individual presenting with H3E50, H3K27, or H3K36 variant expression has a significant probability of cancer diagnosis, whereas this model does not predict a cancer diagnosis with expression of random H3 variants such as H3R63 or H3K122 (Fig. 1J). Taken together, these data support the hypothesis that H3E50K could contribute to oncogenic phenotypes.
As mutations that alter lysine residues, which can harbor PTMs, are common in previously studied oncohistones, we focused our efforts on examining the potential oncogenicity of H3E50K. In silico modeling demonstrates that H3E50 interacts with H4R39 (Fig. 1K). Altering this residue to H3E50K creates a repulsion between the H3K50 R group and the H4R39 R group, which may locally open the nucleosome structure. In comparison, altering this residue to H3E50D does not change the interaction with H4R39. Thus, a change in H3E50 could alter overall nucleosome structure and/or impact interaction with packaged DNA.
H3E50K and H3E50D transform human cells and alter cellular growth
To examine whether H3E50 mutation exhibits properties consistent with oncogenic activity and is sufficient to transform human cells, we utilized the human telomerase reverse transcriptase (hTERT) immortalized but untransformed HMECs that were previously engineered to express a dominant-negative p53 mutant protein [38]. Dominant-negative p53 expression in HMECs, or ‘HMECDD’, does not fully transform these cells; rather, these cells require expression of an oncogene in order to produce a transformed phenotype in vitro [38, 55, 56]. We transduced HMECDD cells with vectors expressing a C-terminal TY1 epitope-tagged wild-type H3.3, H3.3E50K, or the established oncohistones, H3.3K27M or H3.3K36M [7], to produce stable, pooled HMECDD H3.3-TY1, H3.3E50K-TY1, H3.3K27M-TY1, and H3.3K36M-TY1 cell lines. Because H3.1 harbors genomic alterations H3.1E50K and H3.1E50D in human cancers (Fig. 1D), we also transduced HMECDD cells with vectors expressing a C-terminal HA epitope-tagged wild-type H3.1, H3.1E50K, or H3.1E50D to produce stable, pooled HMECDD H3.1-HA, H3.1E50K-HA, and H3.1E50D-HA cell lines. To confirm expression of each histone variant, we acid extracted histones from these cells and analyzed ectopic H3.3 and H3.1 expression via the TY1 and HA tags, respectively. As shown in Fig. 2A and B (Supplementary Fig. S2A and B), each of these ectopic histones are expressed at similar levels across this pool of cells, and ectopic histone expression does not change p53 expression (Supplementary Fig. S2C). Importantly, ectopic expression of these histone variants represents only a minor fraction of the total H3 expressed in cells, ranging from 2% to 7% of the total histone H3 and total H3.3 pool, respectively (Supplementary Fig. S2D and E).
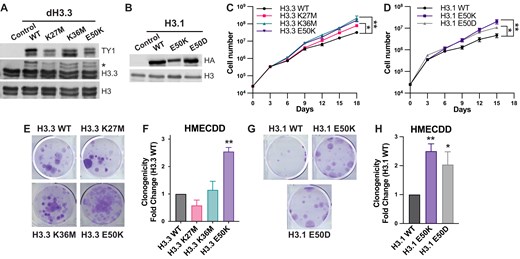
H3E50 variant expression increases cell proliferation and clonogenicity. HMECDD cells stably transduced with (A) pBabePuro H3.3-TY1, H3.3K27M-TY1, H3.3K36M, or H3.3E50K or (B) pBabePuro H3.1-HA, H3.1E50K-HA, or H3.1E50D and lysates acid extracted. Lysates were immunoblotted with the indicated antibodies. Representative images shown, n = 3. (C, D) Stable HMECDD cells expressing the indicated H3.3 mutant proteins were seeded and cell proliferation measured over the indicated timecourse, n = 3. (E) HMECDD cells stably transduced with the indicated H3.3 plasmids were seeded and cell clonogenicity measured after 15 days. Representative images are shown. (F) Quantification of panel (E), n = 3. (G) Stable HMECDD cells expressing the indicated H3.1 mutant proteins were seeded and cell clonogenicity measured after 20 days. Representative images are shown. (H) Quantification of panel (G), n = 4.
To explore the functional consequences of H3E50K, we seeded this series of HMECDD cells and monitored cell proliferation over time. We found that H3.3E50K, H3.1E50K, and H3.1E50D expression significantly but modestly enhances HMECDD proliferation compared with wild-type histone H3 proteins (Supplementary Fig. S2F and G). We monitored cell growth over time using the Incucyte platform that measures cell confluence in real time and found that H3.3E50K expression increases cell confluence over a 96-h timecourse relative to wild-type H3.3 proteins, whereas H3.1E50K and H3.1E50D did not, suggesting a faster doubling time for H3.3E50K (Supplementary Fig. S2H and I). Upon examining cell proliferation for an extended time period of 15–18 days, we did find a significant increase in the cell proliferation rate for HMECDD cells expressing either H3.3E50K, H3.1E50K, or H3.1E50D, relative to wild-type H3.3 or H3.1, respectively (Fig. 2C and D). Expression of H3E50K and H3E50D also significantly increases the ability of HMECDD cells to form colonies in limited dilution, clonogenic assays compared with wild-type H3.3 or H3.1 (Fig. 2E–H). In fact, H3.3E50K expression yields more robust clonogenic growth than stable expression of either H3.3K27M or H3.3K36M. Moreover, the ability of these H3E50 histone variants to enhance cellular transformation from an ectopic expression vector demonstrates that H3E50K and H3E50D can function in a dominant manner, as all endogenous histone H3 genes remain wild type and endogenous wild-type H3 is expressed (Fig. 2A and B and Supplementary Fig. S2A and B). This result is consistent with patient data mined, in which patient tumors identified with a missense mutation that encodes H3E50K contain a single mutation in one allele of a single H3 gene (Fig. 1E). Collectively, these data suggest that H3E50K, and to a lesser extent, H3E50D, exhibits growth and transformation properties that support oncogenic function in both H3.1 and H3.3.
H3E50K enhances cell migration and invasion
To determine whether H3E50 variants regulate cell migration and invasion, which are cellular phenotypes associated with cancer metastasis [57], we performed a series of cell migration assays. We cultured the series of transduced HMECDD cells to confluence, then scratched the 2D culture, and monitored the ability of cells to migrate and close the wound over time. Expression of H3.3E50K significantly increases the migration rate (Supplementary Fig. S3A and B) and percentage of wound closure at both 5 and 12 h (Supplementary Fig. S3C) compared with wild-type H3.3. To further examine the propensity of H3.3E50K expression to drive cell migration, we performed transwell migration assays. H3E50K expression increases by ∼4-fold the number of HMECDD cells that migrate through the 8.0 μm porous membrane in response to growth factors as compared with H3.3 wild type (Fig. 3A and B, Supplementary Fig. S3D). We also found that H3.3E50K and H3.1E50K expression enhances the invasive properties of HMECDD cells as seen by a six- and two-fold enhanced invasion through a matrigel-coated transwell membrane, respectively (Fig. 3C–F, Supplementary Fig. S3E and F). Notably, expression of H3.1E50D did not significantly increase transwell invasion compared with wild-type H3.1 (Fig. 3E and F). Because the H3E50K missense mutation co-occurs with other genomic alterations, including BRAF mutation in human cancer (Fig. 1G), we investigated whether H3E50K expression enhances oncogenicity in the presence of co-occurring oncogenic driver events. We overexpressed wild-type H3.3 or H3.3E50K in the BRAF V600E-mutant melanoma cell line A2058 (Supplementary Fig. S3G and H). Despite the fact that H3.3E50K expression does not increase cell proliferation or clonogenic growth in BRAF-mutant melanoma cells (Supplementary Fig. S3I–K), expression of H3.3E50K with BRAF V600E significantly enhances cell migration and invasion in this context (Fig. 3G–J, Supplementary Fig. S3L and M). Notably, we detect a statistically significant difference in the ability of H3.3E50K expression to enhance proliferation and clonogenicity as well as support migration and invasion. The magnitude of the increase observed for migration and invasion is much larger, suggesting H3E50K could be involved in an EMT-like process. Together, these data suggest that H3E50K expression contributes to an increase in cancer cell migration and invasion alone or in combination with known oncogenic driver gene expression in cancer types that harbor an H3E50K missense mutation.
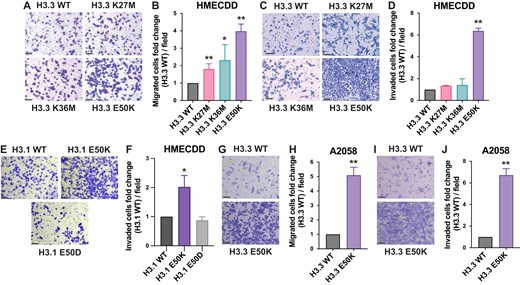
H3E50K expression enhances phenotypes associated with cancer progression. (A) HMECDD cells stably transduced with the indicated H3.3 plasmids were seeded and cell migration through an 8.0 μm filter was measured after 8 h. Representative images are shown. (B) Quantification of panel (A), n = 3. (C) HMECDD cells stably transduced with the indicated H3.3 plasmids were seeded and cell invasion through an 8.0 μm 1 mg/ml matrigel-coated filter was measured after 48 h. Representative images are shown. (D) Quantification of panel (C), n = 2. (E) HMECDD cells stably transduced with the indicated H3.1 plasmids were seeded and cell invasion through an 8.0 μm 1 mg/ml matrigel-coated filter was measured after 48 h. Representative images are shown. (F) Quantification of panel (E), n = 3. (G) A2058 cells stably transduced with the indicated H3.3 plasmids were seeded and cell migration through an 8.0 μm filter was measured after 8 h. Representative images are shown. (H) Quantification of panel (G), n = 3. (I) A2058 cells stably transduced with the indicated H3.3 plasmids were seeded and cell invasion through an 8.0 μm 1 mg/ml matrigel-coated filter was measured after 48 h. Representative images are shown. (J) Quantification of panel (I), n = 3.
H3E50K alters chromatin accessibility and perturbs histone PTMs
Prior studies examining the molecular mechanisms by which oncohistone expression drives cancer development and progression reveal that while all known histone H3 oncohistones modulate transcriptional competence, they do so via unique mechanisms of action. To begin to explore how H3.3E50K expression could contribute to oncogenic growth, we performed ATAC-seq in HMECDD cells expressing wild-type H3.3-TY1 or H3.3E50K-TY1 (Supplementary Fig. S4A). While H3.3E50K expression does not dramatically alter chromatin accessibility (Fig. 4A), H3.3E50K induces an increase in chromatin accessibility at gene regulatory regions including promoters and enhancers (Fig. 4B). Differentially accessible regions (DARs) are detected between wild-type H3.3 and H3.3E50K (Fig. 4C); of the top 5000 DARs, this approach defined an increase in 2247 DARs and a decrease in 2753 DARs in H3E50K expressing cells (Supplementary files 1 and 2). Using HOMER motif analysis, we found that H3E50K expression increases the accessibility of transcription factor motifs including those of the Fos (Ap-1) and Jun families (Fig. 4D and Supplementary Fig. S4C). Collectively, these data suggest that H3E50K expression selectively alters chromatin at specific loci to favor an open conformation, which may impact downstream gene expression.

H3E50K expression perturbs chromatin accessibility, histone modification, and gene expression dynamics. (A) Tornado plots assessing chromatin accessibility in HMECDD cells stably transduced with WT H3.3 or H3.3E50K. Representative plot of the top 30 000 peaks shown of a single biological replicate, n = 3. (B) Genomic distribution of the DARs between HMECDD cells expressing H3.3E50K or WT H3.3. (C) Gene cluster heatmap depicting the distribution of the 5000 most significantly DARs across the genome between HMECDD cells expressing H3.3E50K or WT H3.3, n = 3. (D) Heatmap showing top 25 most differentially accessible transcription factor binding motifs between H3.3E50K and WT H3.3, n = 3. (E) HMECDD cells stably transduced with the indicated plasmids and histone lysates were acid extracted as described in ‘Materials and methods’ section. For each sample, 40 μg of lysates was immunoblotted with the indicated antibodies. Representative images are shown. (F) Quantification of panel (E) for the following modifications: H3K4, H3K27, H3K36, H3K56ac, and H3K79me3, n = 3. All results shown are normalized to the WT H3.3, which was set to 1.0. (G) Tornado plots representing promoter-associated H3K27me3 via CUT&Tag in HMECDD cells stably expressing WT H3.3 or H3.3E50K. Merged plot of two biological replicates are shown.
To determine whether the detected changes to chromatin accessibility may result in changes to histone PTM, we acid extracted histones from HMECDD cells expressing wild-type H3.3-TY1, H3.3E50K-TY1, H3.3K27M-TY1, or H3.3K36M-TY1 and examined a suite of histone PTMs critical for proper regulation of gene expression. While expression of H3.3K27M dysregulates H3K27me3 and H3.3K36M dysregulates H3K36me3 on a global level, respectively, (Fig. 4E and F), H3.3E50K reduces multiple PTMs, including those with opposing functions. H3.3E50K globally reduces H3K4me1 and H3K36me3, both of which are PTMs associated with transcriptional activation [58]. In addition, H3.3E50K globally reduces H3K27me3, which is a mark of heterochromatin [58] (Fig. 4E and F). Considering H3K27me3 is a key histone PTM involved in transcriptional repression and we identified increases in accessible chromatin via ATAC-seq, we performed H3K27me3 CUT&Tag (Supplementary Fig. S4B). HMECDD H3E50K cells are characterized by a reduction in promoter-associated H3K27me3 (Fig. 4G). Collectively, these data suggest chromatin-associated changes may contribute to the dysregulated phenotypes observed with H3E50K expression.
H3E50K dysregulates the breast transcriptome to support EMT
Transcriptomic analysis via RNA sequencing (RNA-seq) demonstrates that stable overexpression of H3.3E50K in HMECDD cells significantly dysregulates gene expression as compared with HMECDD cells that overexpress control wild-type H3.3 (269 increased transcripts, 85 decreased transcripts; P < .05) (Fig. 5A and B and Supplementary Fig. S5). FGSEA with cancer hallmarks suggests that H3.3E50K expression positively regulates EMT, TNFα via NFκB signaling, KRAS signaling, JAK/STAT3 signaling, and other hallmarks of cancer, while decreasing hallmarks, including the G2M checkpoint (Fig. 5B). Analysis of differentially expressed transcripts (Fig. 5C) in H3E50K cells identify an increase in transcripts that encode proteins with defined roles in EMT, including PREX1, FLT1 (VEGFR1), and NLRP2 (Fig. 5D). To assess whether these changes reflect an increase in EMT, we analyzed both N-cadherin and E-cadherin protein levels. We detect an increase in N-cadherin and a decrease in E-cadherin consistent with enhanced EMT (Fig. 5E and F). Collectively, these data suggest that H3E50K expression supports a transcriptional program that contributes to enhanced EMT, which is consistent with our observations that H3.1 and H3.3E50K significantly increase cell migration and invasion (Fig. 3).
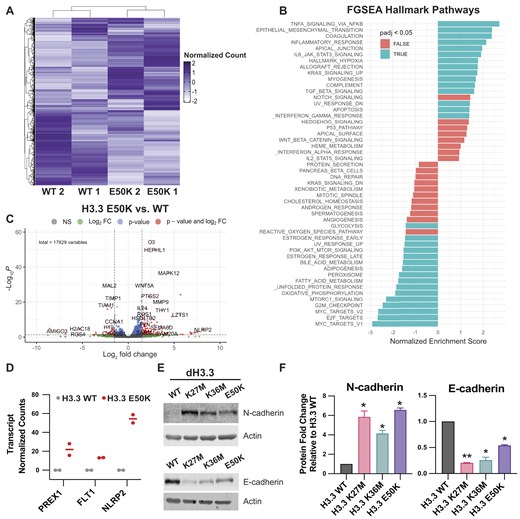
H3E50K supports an EMT gene expression program. (A) Gene cluster heatmap of HMECDD H3.3-TY1 and HMECDD H3.3E50K-TY1 cells from RNA-seq data showing differentially expressed genes. Z scores with normalized read counts were used for heatmap representation, n = 2. (B) FGSEA depicting upregulated or downregulated hallmark pathways from HMECDD H3.3E50K-TY1 cells compared with HMECDD H3.3-TY1 cells. (C) Enhanced volcano plot depicting significantly differentially expressed genes between HMECDD H3.3-TY1 cells and HMECDD H3.3E50K-TY1 cells, where P ≤ .05 (blue) and log2fold change ≥ 1.5 (red). (D) Normalized read counts of indicated EMT-associated genes that are upregulated in HMECDD H3.3E50K-TY1 cells compared with H3.3-TY1. (E) HMECDD cells stably transduced with the indicated plasmids and proteins extracted. Thirty micrograms of lysates were immunoblotted with the indicated antibodies. Representative images are shown, n = 2. (F) Quantification of the protein levels shown in panel (E) normalized to actin as a loading control.
To determine whether changes to chromatin state underlie the transcriptional and phenotypic differences that support EMT and are observed in H3E50K-expressing breast cells, we examined whether EMT-associated genes and regulatory regions are differentially accessible via ATAC-seq. H3E50K expression increases chromatin accessibility of EMT genes and regulatory regions (Fig. 6A and Supplementary Fig. S6A), while decreasing H3K27me3 at the promoters of EMT-associated genes (Fig. 6B). Integration of the ATAC-seq and RNA-seq datasets suggests that chromatin changes may underlie some H3E50K-associated gene expression associated with EMT (e.g. MMP9, MAPK12, and FYN) (Fig. 6C). These data are supported by the co-regulation of EMT genes including MMP9, MAPK12, and others, which are characterized by increased chromatin accessibility, decreased promoter H3K27me3, and increased transcript abundance (Fig. 6D and Supplementary Fig. S6B). These data support a model in which H3E50K variant expression drives localized changes to chromatin accessibility at EMT genes, which leads to changes in histone modifications to support transcriptional competence, which is reflected in an increase in EMT gene expression.
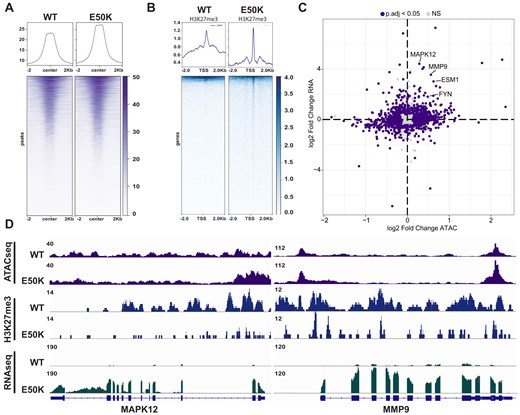
Chromatin changes underlie an H3E50K-associated EMT transcriptional program. (A) Tornado plot assessing differential accessibility of genes and regulatory regions associated with EMT. Representative plots are shown, n = 3. (B) Tornado plots representing promoter-associated H3K27me3 at EMT genomic loci via CUT&Tag in HMECDD cells stably expressing WT H3.3 or H3.3E50K. Representative plots are shown, n = 3. (C) Scatterplot depicting integration of RNA-seq differential gene expression and ATAC-seq differential accessibility. (D) Integrative genomics viewer (IGV) tracks from ATAC-seq, H3K27me3 CUT&Tag, and RNA-seq of selected EMT-associated genes.
H3E50 amino acid substitutions sensitize S. cerevisiae to drugs that induce various forms of cell stress
Previously characterized oncohistones cause growth defects and/or altered drug sensitivity in yeast models [7, 32, 34, 59] demonstrating that yeast models are valuable tools for exploring cellular effects of oncohistone proteins. To explore whether H3E50 changes modeled in yeast also impact cell physiology, we utilized the model organism S. cerevisiae. The histone H3 proteins in budding yeast share the highest degree (90%) of identity with human H3.3 [35]. As such, the nucleosome structure in S. cerevisiae shows similar contacts between H3E50 and H4R39, as observed in H. sapiens H3 (compare Fig. 1K with Fig. 7A). To explore the potential consequences of specific amino acid changes at this position, H3E50K, H3E50D as well as H3E50R and H3E50A were modeled both in budding yeast (Fig. 7A) and human (Fig. 7B) nucleosomes. As observed for H3E50K within the human nucleosome structure (Fig. 1K), H3E50R creates a repulsive interaction with the coordinating H4R39 amino acid, while H3E50A eliminates the potential for interaction with H4R39.
![H3E50K S. cerevisiae exhibit restricted growth phenotypes via distinct mechanisms from H3K36M. (A) In silico modeling of S. cerevisiae H3E50, H3E50K, H3E50D, H3E50R, and H3E50A harboring possible PTMs, using PDB 1ID3 [37]. (B) Insilico modeling of H. sapiens E50R and E50A, using PDB 5X7X [36]. (C) Serial dilution spotting assays of S. cerevisiae cells expressing the yeast H3 homologue HHT2 containing the indicated mutation were grown on normal media (YEPD) or media containing cellular stressors – 18 μg/ml camptothecin, 6 μg/ml bleomycin, or 15 mM caffeine – for 2–5 days. Representative images are shown, n = 3. (D) Serial dilution spotting assays of S. cerevisiae cells expressing the yeast H3 homologue hht2 containing the indicated mutation in the absence of HHT1 were grown on normal media (YEPD) or media containing cellular stressors – 18 μg/ml camptothecin, 6 μg/ml bleomycin, or 15 mM caffeine – for 2–5 days. Representative images are shown, n = 3. (E) Lysates acid extracted from S. cerevisiae cells of the indicated genotypes were immunoblotted with the indicated antibodies. Representative images are shown, n = 3. (F) Quantification of panel (E). Signals were normalized to H3 and PGK1 levels.](https://oup.silverchair-cdn.com/oup/backfile/Content_public/Journal/narcancer/7/1/10.1093_narcan_zcaf002/5/m_zcaf002fig7.jpeg?Expires=1750268767&Signature=vzRlBOIrHzscttnv~xVXworjT~OwWzK2t0~ma4O0-JhlrEQ2aANNM1YMyElVBxvcgY4Fy5N7s4K7WgGMbiwqetaDB933ynXlq-0mWwLCfo4sAY2dliWZ4OTdpuYK~ObTzqU0TcA3qFlWnvDEy8y1o9cY9p8p5dv~ewBOhe7txjsnaEWzEhiLYEgbRw8Q45sIEJK3ApgFCP~r88rugwEGCMcm1cpg47SrvIXZKCXQoyXjGX6ZaysS0zBooGyjHwXiFpKYrh10m4498oUsiADDWNZJrjDMm0DA3WMJgBYm9J7FBQTQa4vasHYpUQTIliBm0JkSl5l43oJQ2YW733h08w__&Key-Pair-Id=APKAIE5G5CRDK6RD3PGA)
H3E50K S. cerevisiae exhibit restricted growth phenotypes via distinct mechanisms from H3K36M. (A) In silico modeling of S. cerevisiae H3E50, H3E50K, H3E50D, H3E50R, and H3E50A harboring possible PTMs, using PDB 1ID3 [37]. (B) Insilico modeling of H. sapiens E50R and E50A, using PDB 5X7X [36]. (C) Serial dilution spotting assays of S. cerevisiae cells expressing the yeast H3 homologue HHT2 containing the indicated mutation were grown on normal media (YEPD) or media containing cellular stressors – 18 μg/ml camptothecin, 6 μg/ml bleomycin, or 15 mM caffeine – for 2–5 days. Representative images are shown, n = 3. (D) Serial dilution spotting assays of S. cerevisiae cells expressing the yeast H3 homologue hht2 containing the indicated mutation in the absence of HHT1 were grown on normal media (YEPD) or media containing cellular stressors – 18 μg/ml camptothecin, 6 μg/ml bleomycin, or 15 mM caffeine – for 2–5 days. Representative images are shown, n = 3. (E) Lysates acid extracted from S. cerevisiae cells of the indicated genotypes were immunoblotted with the indicated antibodies. Representative images are shown, n = 3. (F) Quantification of panel (E). Signals were normalized to H3 and PGK1 levels.
In budding yeast, which possess two H3 genes, HHT1 and HHT2 [60], we engineered the HHT2 allele to express hht2-E50A, -E50R, or -E50K, or, as a control, hht2-K36M to genetically model oncohistone expression in a background similar to oncohistone expression in human cells in which another wild-type copy of histone H3 (HHT1) is present. H3E50R was included to examine whether the positive charge shared between the lysine and arginine R groups impacts H3 function. Cells expressing these H3 variants were grown in control conditions or in the presence of cellular stressors or DNA damaging agents (Fig. 7C). While no change in growth was detected under control conditions, hht2-K36M, hht2-E50R, and hht2-E50K, cells show growth defects in the presence of the DNA damaging agent bleomycin [61] as well as caffeine, a negative regulator of the target of rapamycin (TOR) signaling pathway [62] (Fig. 7C). These studies further demonstrate the dominant nature of H3E50K and show that H3E50R also has a dominant effect on yeast cell sensitivity to these drugs. In contrast, H3E50A does not confer a dominant growth defect.
To directly explore the functional consequences of amino acid substitutions at E50 for histone H3, we also examined yeast cell growth using mutants that express H3E50 variants as the sole copy of budding yeast histone H3. These cells express each engineered mutant hht2 allele (hht2-E50A, -E50R, or -E50K) and are deleted for HHT1. With this experimental paradigm, the H3E50R and H3E50K cells still show slow growth in the presence of the DNA damaging agent bleomycin as well as caffeine (Fig. 7D). As the sole copy of H3, H3E50A confers a growth defect in the presence of camptothecin as well as bleomycin [63], but no significant effect is detected in the presence of caffeine. Thus, converting E50 to a positive residue affects yeast cell sensitivity to specific stressors in a manner that does not occur with a neutral change, suggesting the positive charge provides a gain of function. In both genetic contexts (Fig. 7C and D), H3E50R confers a slightly stronger growth defect in the presence of bleomycin or caffeine as compared with H3E50K.
H3E50-mutant histones alter cell physiology via a mechanism that is distinct from H3K36M-mutant histones
One advantage of the budding yeast system is that simple genetics can be employed to identify cellular pathways impacted by histone PTM and/or oncohistones [34, 64, 65]. We recently employed such an approach to identify high copy suppressors of the caffeine-sensitive growth defect of H3K36 mutants in budding yeast [34]. This approach identified several chromatin modifying enzymes and complexes that when overexpressed can suppress the impaired growth of H3K36 mutants on media containing caffeine [34]. As S. cerevisiae expressing H3E50K and H3E50R are also sensitive to caffeine (Fig. 7C and D), we examined whether the growth of the H3E50 mutants like H3K36R/M mutants is suppressed by overexpression of the suppressor genes, which would suggest that similar cellular pathways are impacted in these oncohistone models. We overexpressed H3K36 suppressors, including ESA1, encoding a lysine acetyltransferase [66], TOS4, encoding a protein implicated in transcriptional regulation [67], PHO92, encoding an N6-methyladenosine reader [68], and SGV1, encoding a CDK9 kinase, in S. cerevisiae with H3E50K or H3E50R as either the sole copy of H3 or in the presence of WT HHT1 and assessed growth in the presence of caffeine (Supplementary Fig. S7A and B). Overexpression of the established H3K36 suppressors shows minimal rescue of the H3E50 mutants. Taken together, these genetic suppressor experiments suggest that H3E50 variants alter yeast cell physiology in a manner that may be distinct from H3K36M.
To determine whether H3E50K perturbs proximal PTMs in budding yeast, we acid extracted histones from the strains expressing wild-type H3 protein or mutant H3 (e.g. hht2-E50A, -E50R, or -E50K) that are also deleted for HHT1. While expression of H3K36M globally reduces H3K36me3 (Fig. 7E and F), we find mutation of E50 significantly reduces H3K4me1 (Fig. 7E and F), which is consistent with our findings in human models (Fig. 4). Collectively, these data suggest that S. cerevisiae can be employed to streamline functional studies examining the molecular mechanisms of action of cancer-associated histone variants, readily complementing companion studies in human systems.
Discussion
Here, we leverage the publicly available cBioPortal and COSMIC datasets to identify histone H3E50 mutations as novel and recurrent histone mutations in human cancers. While multiple cancer-associated genomic alterations occur that result in a change of H3E50 to another amino acid, a missense mutation that changes H3E50 to a lysine to produce H3E50K is amongst the most common in these publicly available patient datasets. We show that ectopic expression of either H3.1E50K or H3.3E50K functions in a dominant manner to drive cell proliferation, growth in limited dilution, migration, and invasion. H3.3E50K also selectively increases chromatin accessibility, including at Fos/Jun transcription factor binding sites, and reduces proximal H3 PTMs involved in transcriptional repression including H3K27me3. Transcriptomics suggests that H3.3E50K expression governs essential pathways and processes involved in cell invasion and the EMT, consistent with H3E50K-mediated cellular phenotypes. Integration of chromatin accessibility, H3K27me3 CUT&Tag, and transcriptomics data suggest that changes to chromatin underlie the pro-EMT phenotype we empirically observe in H3E50K expressing cells. Genetic suppressor assays in S. cerevisiae demonstrate that while slow growth in caffeine is shared between the known oncohistone H3K36M and H3E50K, genes that suppress growth phenotypes of H3K36M cells do not show similar suppression of H3E50 mutant models. Taken together, these data suggest that H3E50K may alter cell physiology and support oncogenic properties in a manner that is distinct from previously analyzed histone variant proteins.
As compared with H3K36M and H3K27M oncohistones, missense mutations that change H3E50 to other residues, including H3E50K, occur at a lower frequency without a preference for a specific tissue of origin, with H3E50K identified in breast, lung, and skin cancers, in addition to other cancer types (Fig. 1F and G and Supplementary Fig. S1B). We modeled H3.1E50K and H3.3E50K expression in untransformed HMECs that were previously transduced with dominant-negative p53 (HMECDD). Expression of H3E50K supports a transformed phenotype in this context. While we observed a modest but significant increase in the proliferation and clonogenic expansion of these cells, the ability of H3.3E50K expression to increase cell migration and invasion is not only significant, but of a large magnitude, suggesting that H3.3E50K expression may contribute to metastatic phenotypes. We also examined the transformative capacity of H3E50K in a second untransformed human breast cell line, MCF10A, which is TP53 wild type. Unlike HMECs, ectopic expression of H3E50K in the MCF10A background was insufficient to support oncogenic activity (data not shown). Because H3E50 genomic alterations occur in patient tumors in the context of other co-occurring genomic alterations (e.g. loss of function TP53 mutation and/or activating BRAF V600E mutation as illustrated in Fig. 1G), we investigated whether H3.3E50K expression in the BRAF V600E-mutant A2058 melanoma cell line enhances the transformative phenotypes already observed in this cell line. While H3.3E50K expression in A2058 melanoma cells did not increase proliferation or clonogenicity, H3.3E50K expression in this context strikingly increased cell migration and invasion (Fig. 3), in line with our observations in untransformed HMECDD cells. These data highlight how co-occurring genomic alterations may collaborate or synergize with histone mutations, including mutations that produce the histone variants such as H3E50K. While H3E50K mutation is relatively infrequent and, as such, patient outcome data are not readily available, these data raise the possibility that potential oncohistone mutations, such as H3E50K, may be associated with poor patient prognosis or may be associated with later stage diagnosis due to a more aggressive phenotype, especially in situations where H3E50K co-occurs with additional oncogenic driver events. Co-occurrence with oncogenic driver mutations, such as BRAF V600E, may also explain the likely subclonal nature of tumors containing H3E50K alteration (Fig. 1H). While H3E50K patient data is limited, surveying existing patient data demonstrates that genomic alterations that result in H3E50K variant expression is associated with metastatic disease (Fig. 1G). Gene signatures associated with H3E50K expression (Fig. 5) support this conclusion, as H3.3E50K expression in untransformed breast cells increases steady-state levels of transcripts associated with KRAS signaling, which could synergize with known oncogenic KRAS/MAPK signaling effectors such as BRAF V600E.
As described above, our findings suggest that H3.1 and H3.3E50K expression supports oncogenic activity and a transformed phenotype, which is evidenced by migration and invasion in in vitro assays. While these phenotypic experiments are consistent with the conclusion that H3E50K may support oncogenicity, in vivo experiments are required to assert that the H3E50K variant functions as an oncogenic driver. Moreover, our studies demonstrate H3E50K drives migratory and invasive cellular phenotypes in both untransformed HMECs characterized with concurrent dominant-negative p53 expression, and, in the context of H3.3E50K, also enhances invasion in the presence of concurrent oncogenic drivers. Chromatin changes coupled with transcriptomic studies support these findings by revealing that H3E50K cells remodel chromatin in a manner that increases expression of genes associated with EMT. We found that H3E50K expression increases chromatin accessibility around FosL1/FosL2 and related Jun/Fos transcription factor binding motifs (Fig. 4D and Supplementary Fig. S4C), many of which have established roles in EMT in breast and other cancers [69, 70]. These studies provide insight into the potential role H3E50K may have in cancer progression and migration as opposed to cancer initiation, suggesting that H3E50K may support cancer cell dissemination to distal sites. Conclusively testing this hypothesis in in vivo murine models is a critical future direction.
The previously characterized H3K27M oncohistone primarily reduces H3K27 trimethylation both in cis and trans [9]; similar changes are observed for H3K36M on H3K36 trimethylation both in cis and trans [10]. Additional alterations to histone PTMs may occur in these contexts, which are likely to be indirect changes as a result of the global misregulation of H3K27 methylation and H3K36 methylation, respectively. In contrast, H3.3E50K globally reduces numerous H3 PTMs associated with both transcriptional activation and repression (Fig. 4). We detect a significant global reduction in H3K27me3 and a reduction in promoter-associated H3K27me3 across the genome including at the promoters of EMT-associated genes (Figs 4G, 6B, and 6D). These findings support the hypothesis that expression of H3.3E50K may directly modulate one or more proximal PTMs including H3K27me3 through altering the association of chromatin modifying enzymes with H3. An alternative hypothesis is that H3E50K generally destabilizes nucleosomes, as has been reported for the H2BE76K oncohistone [17]. The data presented here suggest global nucleosome destabilization is not the driving mechanism as both selective and bidirectional changes in chromatin accessibility were defined (Fig. 4). However, previous studies that used a biochemical approach to examine in situ histone dimer exchange revealed that H3.1 E50 variants (H3E50A/D/K/Q) enhance dimer exchange relative to wild-type H3.1 [7], which suggests that H3E50K expression could reduce nucleosome stability. Subsequent experiments could address these hypotheses and extend to an examination of how H3E50K perturbs the H3 interactome, and whether the presence of H3E50K systematically alters the stability of nucleosomes that contain H3E50K.
Our data in budding yeast demonstrate that both hht2-E50K and hht2-E50R cells are sensitive to DNA damage and TOR inhibition in the presence of wild-type endogenous histone H3 (Fig. 7C). These results align with previous studies that identified sensitivity to several DNA damaging agents in hht2-E50 mutant cells [71, 72]. These studies both demonstrate the utility of S. cerevisiae as a model to functionally dissect the role of amino acid properties in supporting oncogenic activity and suggest that the positive charge in the lysine and arginine R groups may support a pro-oncogenic phenotype (Fig. 7C and D). While both hht2-E50R and hht2-E50K exhibit growth defects in the presence of the DNA damaging agent bleomycin as well as the cell stress inducer caffeine, the growth characteristics are different, suggesting that while the conserved positive charge may play a role in oncogenic activity, we cannot rule out the possibility of additional functions that differentiate H3E50K from H3E50R. These functions may enhance our understanding of why H3E50K is identified as a recurrent mutation in cancer, while H3E50R is not (Fig. 1). Another study that examined hht2-E50A yeast cells revealed that this amino acid change can extend chronological lifespan of these cells [73], a phenotype that could support oncogenic properties in human cells. In the future, to address the potential contributions of H3E50 changes, one could engineer human cell lines to express the suite of H3E50 mutant proteins and examine their propensity to support oncogenic activity and perturb gene expression, as compared with H3E50K.
This research is focused on delineating the mechanistic basis of how oncohistones, including H3K27M and H3K36M, function, with the goal of defining therapeutic targets. This line of investigation has led to the preclinical testing of compounds targeting a variety of transcription factors, kinases, and chromatin modifying enzymes, as well as the clinical testing of the DRD2 antagonist ONC201 in H3K27M-mutant gliomas [25, 27, 28]. Our studies identify a series of proteins and biological processes that are upregulated, some of which may represent viable therapeutic targets for patients with cancers characterized by H3E50K. Our data show that H3E50K upregulates KRAS signaling and H3E50K co-occurs with BRAF mutations in melanoma and other cancers. As such, patient tumors characterized by H3E50K mutation may predict enhanced or prolonged sensitivity to combined BRAF and MEK inhibition via debrafinib and trametinib, respectively, which is currently a standard-of-care for the treatment of BRAF V600E-mutant melanomas [74]. While this combination has yet to be tested in the context of H3E50K mutant cell lines and tumors, other approaches can be utilized to define H3E50K vulnerabilities. To identify functional vulnerabilities in oncohistone expressing cells, we have previously exploited S. cerevisiae and performed high copy suppressor screens in H3K36M/R budding yeast oncohistone models [34]. In this context, we identified conserved chromatin modifying enzymes including the histone acetyltransferases Esa1/Tip60. This strategy can be employed in parallel with human and murine in vitro and in vivo studies to identify therapeutically actionable targets in H3E50K cell lines and tumors.
Here, we lay a foundation for understanding the oncogenic potential of additional histone H3 variants, with a focus on H3E50K. The models used for these foundational studies are engineered via ectopic overexpression of H3E50K; we acknowledge the limitations of overexpression models include non-physiological histone variant expression. While we demonstrate low ectopic histone variant expression (Supplementary Fig. S2E), CRISPR-based approaches in which the histone gene is manipulated at the endogenous locus under endogenous regulatory sequences will be critical to validate our observations in a physiologically relevant context. While preliminary, the evidence presented here suggest H3E50K supports oncogenic activity and highlights potential contributions to cancer progression. Future studies should focus on integrating CRISPR knock-in models and analysis of patient-derived tissue to comprehensively assess the transformative capacity of H3E50K and evaluate potential roles in tumorigenesis. Utilizing patient cell lines and tumor samples that are characterized by H3E50 variant expression, if available in the future, would strengthen the findings reported here and provide additional validation.
Acknowledgements
We thank the Spangle, Corbett, and Hong laboratories for helpful project discussions. We thank Dr Anna M. Kenney for kindly providing access to the Leica Delimited microscope equipped with the MC170 camera used for imaging migration and invasion assays. We thank Dr Dan Yan, Department of Pediatrics, Emory University for providing support for the Sartorius Incucyte.
Author contributions: K.S., C.Y.J., D.V.F., E.J.H., A.H.C., and J.M.S. designed the research. K.S., C.Y.J., D.V.F., E.J.H., K.T.S., M.A., S.L., R.S.L., J.F., and S.E. performed experiments and analyzed the results. A.L.H., S.A.S., C.C.M., A.H.C., and J.M.S. supervised the studies. J.M.S. wrote the manuscript with input from K.S., D.V.F., C.Y.J., E.J.H., R.S.L., and A.H.C.
Supplementary data
Supplementary data is available at NAR Cancer online.
Conflict of interest
None declared.
Funding
This study was supported by grants from the National Institute of Health (NIH) (R21CA256456 to J.M.S. and A.H.C., 1R35GM150587 to J.M.S., T32GM135060 to D.V.F., T32GM152344 to D.W.F., and K12GM000680 to C.Y.J.), the National Science Foundation (NSF) (S352L5PJLMP8 to J.M.S.), the Winship Cancer Institute of Emory University (Winship Invest$ to J.M.S. and A.H.C.), and University Research Committee, Emory University (URC) (to J.M.S. and A.H.C.).
Data availability
The data generated in this study are publicly available in the Gene Expression Omnibus at GSE (RNA: GSE246607; ATAC-seq: GSE286330; H3K27me3 CUT&Tag: GSE286331). Strains and plasmids are available upon request. The authors affirm that all data necessary for confirming the conclusions of the article are present within the article, figures, and tables.

Comments