


Abstract
The commonly used arabinose- and rhamnose-inducible Escherichia coli promoters, PBAD and PRha, exhibit tight regulation through activation via their respective transcription factors, AraC and RhaS, alongside the cyclic AMP receptor protein. The mechanisms of these promoters have been characterized on a parts level, but nucleotide-level analysis has yet to be elucidated. Therefore, we describe here a massively parallel reporter assay that maps regulatory sites at the nucleotide level. The relative importance of nucleotides in each binding site is revealed, including loci not included in previous annotations. For PBAD, we confirm known sites and reveal novel binding sites involved in modulating gene expression. In PRha, we refine the length and sequence specificity of rhaI half-sites, updating previous annotations and providing nucleotide level insights into RhaS-mediated regulation. Mutations that lead to increased promoter strength, wider dynamic range, and altered basal expression are identified for both promoters. Engineered versions of PBAD and PRha promoters based on this data show improvements in dynamic range alongside a seven- and three-fold increase in promoter strength, respectively, with a slight increase in basal expression for the PBAD promoters and no significant increase for PRha. This work expands the genetic parts “toolkit” and increases the understanding of these important commonly used promoters.
Introduction
The Escherichia coli arabinose- (PBAD) and rhamnose-inducible promoters (PRha) are widely used promoter systems. Both promoters provide tight expression while exhibiting a modest dynamic range in the presence of their respective inducers, l-arabinose and l-rhamnose, making them attractive for diverse biotechnological applications [1–6]. Moreover, they have also been adapted to respond to various effector ligands [7–9]. Transcription factors (TFs)—AraC and RhaS—are primary regulators of PBAD and PRha, respectively, with both promoters involving the cyclic AMP receptor protein (CRP) to enhance expression, including their own regulator expression from their respective divergent operons, PC and PRhaRS [10, 11].
Although PBAD and PRha promoters share a similar structural arrangement of their binding sites on the promoter [12], they are unique in their mechanisms (Fig. 1). PBAD becomes transcriptionally active when AraC binds to the araI1 and araI2 half-sites [12]. In the absence of arabinose, AraC binds two loci that are separated by 210 bp, the araO2 and araI1 half-sites, leading to a DNA loop structure that represses transcription (Fig. 1A) [12]. In the presence of arabinose, AraC undergoes conformational change, releasing araO2 and recruiting RNA polymerase (RNAP) after binding both araI1 and araI2 in conjunction with CRP to open the DNA loop structure (Fig. 1B) [12]. As the AraC concentration increases, expression is downregulated by binding to araO1 located in the PC promoter.
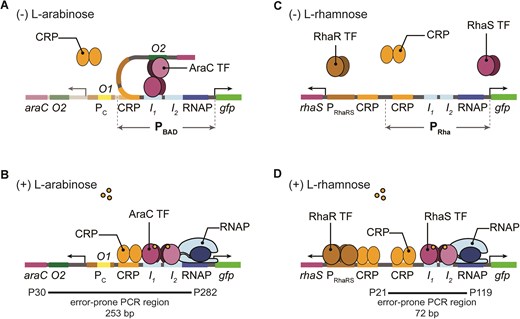
Schematic and known mechanisms of E. coli PBAD and PRha promoters. (A) The PBAD promoter is regulated by TF AraC. In the absence of arabinose, AraC represses transcription by binding at araI1 (I1) and araO2 (O2) creating a DNA loop that prevents RNAP and CRP from binding to PBAD, as well as reducing the expression of araC from the constitutive PC promoter. (B) The presence of arabinose changes the AraC dimer conformation to the activating form and binds to araI1 (I1) and araI2 (I2) while recruiting the RNAP to the −35 and −10 boxes. Full activation of PBAD is achieved when CRP binds. (C) The PRha promoter shares a similar structural arrangement of their binding sites as the PBAD promoter, however, differs in their repression mechanisms. The absence of l-rhamnose results in no binding of TF RhaS. (D) PRha is activated when TF RhaS, expressed from PRhaRS, binds at rhaI1 (I1) and rhaI2 (I2) half-sites, which also recruits the RNAP to the −35 and −10 boxes. Full activation is achieved when the co-activator CRP binds upstream of the rhaI half-sites.
Activation of PRha is controlled by the binding of rhamnose-bound RhaS to the rhaI1 and rhaI2 half-sites. The absence of l-rhamnose results in no binding of RhaS (Fig. 1C). While RhaS can activate transcription independently, full activation is achieved when the co-activator CRP binds upstream of the rhaI half-sites (Fig. 1D). Unlike AraC’s autoregulatory dual activator/repressor role, expression of RhaS from PRhaRS is regulated by RhaR which also responds to rhamnose. Together, the presence of rhamnose triggers RhaR to bind to PRhaRS, co-activated by CRP, and expresses both rhaR and rhaS (Fig. 1D). Subsequently, rhamnose-bound RhaS binds to PRha, co-activated by CRP bound upstream, to activate transcription.
Despite the precise control offered by PBAD and PRha promoters, they are not suitable for certain applications, such as achieving maximum protein expression [13–16]. Instead, these promoters have been utilized to provide titratable expression of the T7 RNAP or LacI protein, which binds to the lacO within the T7 promoter system derived from the T7 bacteriophage, thus reducing leakiness in commercial strains (e.g. BL21-AI from ThermoFisher and KRX Competent Cells from Promega) [2, 3]. Expression levels of PBAD and PRha are orders of magnitude lower than those of T7 promoter systems [14]. While various improvements have been made to enhance the dynamic range, sensitivity, and other characteristics, these improvements have mostly focused on altering other components of the system without modifying the promoters themselves, such as varying TF expression by using different promoters [17, 18], optimizing RBS [16, 19, 20], and altering plasmid copy number [5, 21]. Adjusting expression levels of the corresponding transporter genes, araE or rhaT, can tune the expression strength of PBAD and PRha, respectively [22, 23]. Similarly, tunability of PRha has been achieved in a RhaT-mediated rhamnose transport and catabolism double knockout E. coli strain [6]. On the protein level, an increase in the sensitivity of AraC to arabinose was achieved to reduce its response to IPTG, allowing simultaneous use PBAD and lactose-inducible promoter (PLac) at the protein level [24].
Previous research focusing directly on the characterization and improvements of PBAD and PRha promoters has mainly concentrated on the parts level, isolating short sequence motifs [25–32]. Notably, reduction of basal activity in PBAD has been achieved through the assembly of hybrid promoters that combine the araI half-sites with repressor bindings sites, such as lacO and tetO, inserted within non-native −35 and −10 boxes. This arrangement repressed basal activity through the binding of LacI or TetR repressor but activated with the addition of lactose and arabinose [27, 29]. However, such approaches have resulted in only moderate improvements induced expression strength.
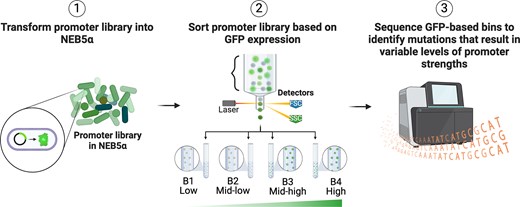
The comprehensive understanding of the regulation and characterization of PBAD and PRha promoters has been achieved through decades of study involving laborious techniques and experiments [10, 11, 31, 32]. While these studies have been essential for the utilization of PBAD and PRha in synthetic biology applications, a more comprehensive assessment using high-throughput methodologies is needed to thoroughly investigate the known binding sites, including the surrounding regions that were most often considered non-functional [33]. Massively parallel reporter assays, such as sort-seq (a workflow characterized by a phenotypic sorting prior to deep sequencing), in combination with statistical methods, can systemically interrogate a library of pooled sequences based on the expressed phenotype, thereby identifying functional sites in the sequence space under a specific condition [34–36]. Previously, we performed sort-seq and successfully elucidated sequence-function relationships in an uncharacterized σ54-based promoter, leading to a 4× improvement in dynamic range compared with the native promoter, as well as the identification of a critical binding site required for regulation [36].
In this study, we extend a similar approach to comprehensively interrogate the PBAD and PRha promoter systems at the nucleotide level to gain a deeper understanding of the TF-binding sites within the promoter regulator sequences. Specifically, we employ sort-seq to map distinct binding patterns in vivo of TFs that contribute to gfp basal and induced expression. We then use these sequence-function maps to identify and design inducible promoters with improved strengths and dynamic ranges while retaining low basal activity. Furthermore, we thoroughly characterize and validate the precise impact of specific mutations for each promoter. Our work provides a nucleotide level map of PBAD and PRha promoters, serving as a valuable guide for engineering complex promoter systems.
Materials and methods
Chemicals and reagents
Q5 High-Fidelity 2X Master Mix (cat. #M0492), Taq 2X Master Mix (cat. #M0270), NEBuilder HiFi DNA Assembly Master Mix (cat. #E2621), DpnI (cat. #R0176), T4 Polynucleotide Kinase (cat. #M0201), and Instant Sticky-end Ligase Master Mix (cat. #M0370) were purchased from New England Biolabs (Ipswich, MA). GeneMorph II Random Mutagenesis Kit (cat. #200550) were purchased from Agilent (Santa Clara, CA). Qiagen Plasmid Miniprep Kit (cat. #27106), QIAquick PCR Purification Kit (cat. #28106), and QIAquick gel purification kit (cat. #28706) were purchased from Qiagen. Sanger sequencing and Next Generation Sequencing (NGS) were outsourced to Azenta Life Sciences, Inc. (Research Triangle Park, NC and South Plainfield, NJ). Primers used in this study were synthesized by Integrated DNA Technologies, Inc. (Coralville, IA).
Equipment
All DNA concentrations and purities and culture turbidities were measured on the DeNovix DS-11+ Spectrophotometer (DeNovix Inc., Wilmington, DE) using microvolume and cuvette absorbance modes, respectively. Optical densities (OD600, absorbance at 600 nm) of bacterial cultures in 45 × 10 × 10 mm (H × W × D) cuvettes (Greiner, cat. #613101) were measured on DeNovix DS-11+ Spectrophotometer (DeNovix Inc., Wilmington, DE). Uninoculated Luria Broth (LB) medium was used as a blank prior to measurement. All cultures were grown in Thermo Scientific™ MaxQ™ 6000 Incubated Stackable Shakers (ThermoFisher Scientific), shaking at 250 rpm, at 37°C.
Biological resources
Bacterial strains and plasmids used in the study are listed in Supplementary Table S1. NEB® 5-alpha Competent E. coli (High Efficiency) (cat. #C2987) and NEB® 5-alpha Competent E. coli (Subcloning Efficiency) (cat. #C2988J) were purchased from New England Biolabs (Ipswich, MA). Electrocompetent ElectroMAX™ DH5α-E Competent Cells were purchased from ThermoFisher Scientific (cat. #11319019). All bacterial strains were grown in liquid or solid Luria Broth (pH 7.0; LB medium) that includes 10 g/l tryptone (VWR, cat. #J859-500G), 5 g/l yeast extract (VWR, cat. #J850-5KG), 10 g/l sodium chloride (VWR, cat. #0241-5KG), and 15 g/l agar for solid (Fisher, cat. #BP1423-500) and supplemented with 100 μg/ml ampicillin (Amp100; VWR, cat. #0339-25G).
For volumes <10 ml, cultures were either grown in 5-ml culture tubes (VWR, cat. #60818-500), 15-ml conical tube (VWR, cat. #89039-664), 50-ml conical tubes (VWR, cat. #89039-658), or 2-ml deep-well 96-well plates (VWR, cat. #89237-526) sealed with breathable rayon film for culture plates (VWR, cat. #60941-086).
Plasmid construction
Plasmid construction and testing were completed in chemically competent NEB5α cells and grown on liquid and solid LB medium Amp100. Plasmid libraries were constructed and tested in electrocompetent ElectroMAX™ DH5α-E cells. Primers are listed in Supplementary Table S2 for plasmid construction, Supplementary Table S3 for library generation, and Supplementary Table S4 for Sanger and NGS sequencing. Plasmids are listed in Supplementary Table S5.
Construction of native promoter plasmids
The pNK93 plasmid was first constructed by amplifying the vector backbone (3176 bp) of pNK25 plasmid [36] and AraC-PBAD (1286 bp) fragment from pJeM1 plasmid (Addgene, cat. #135088) were amplified with Q5® High-Fidelity 2X Master Mix. Once fragment sizes were verified on 0.8% agarose (VWR, cat. #0710-500G), polymerase chain reaction (PCR) products were purified, digested with DpnI to remove the parental template, and then assembled using NEBuilder® HiFi DNA Assembly Master Mix. The ligated mixture was transformed into 25 μl chemically competent NEB5α (subcloning efficiency) using the manufacturer’s instructions. After 1-h recovery at 37°C (250 rpm), 100 μl of the transformed cells were plated on LB Amp100 and incubated at 37°C for ∼18 h. Following transformation, three individual colonies were screened using colony PCR with Taq 2X Master Mix to verify if the desired insert in the correct orientation was present. Positive clones were grown in 5 ml LB Amp100 in 15-ml conical tubes (placed at an angle) overnight at 37°C shaking at 250 rpm for ∼18 h and miniprepped with Qiagen Plasmid Miniprep Kit. Isolated plasmids were verified with Sanger sequencing.
AraC-PBAD and RhaS-PRha plasmids, carrying the PBAD and PRha, respectively, were constructed similarly to pNK93 by HiFi assembly of two PCR fragments. J23101-RBS0015-mCherry (1019 bp) from BASIC_7_J23101-RBS34-mCherry-B0015 plasmid (Addgene, cat. #68141) was inserted into the backbone of pNK93 (4418 bp), resulting in plasmid PBAD. The PBAD plasmid was then used as the vector backbone of PRha plasmid, with the RhaS-PRhaBAD insert (1179 bp) amplified from sfGFP-pBAD plasmid (Addgene, cat. #54519).
Construction of validation mutants
Point mutations were introduced via PCR using Q5® High-Fidelity 2X Master Mix with primers containing the desired mutations listed in Supplementary Table S2. Fragment sizes were verified on 0.8% agarose, purified, and digested with DpnI to remove the parental template. Blunt ends of the fragments were phosphorylated with T4 Polynucleotide Kinase and then ligated with Instant Sticky-end Ligase Master Mix. The ligated mixture was transformed into 25 μl chemically competent NEB5α, screened using colony PCR, miniprepped, and verified with Sanger sequencing.
Promoter analysis in E. coli via flow cytometry
Native promoter and control plasmids were transformed into NEB5α (subcloning efficiency). Individual colonies of each construct were grown in 3 ml LB Amp100 in 5-ml culture tubes overnight at 37°C, shaking at 250 rpm. Overnight cultures were diluted to an OD600 of ∼0.05 in pre-warmed 3 ml LB Amp100 in 15-ml conical tubes (placed at an angle) and grown at 37°C. When the OD600 reached ∼0.1–0.2, 375 μl of culture was transferred to 5-ml culture tubes with 125 μl LB Amp100 or 4× l-rhamnose or l-arabinose concentration of the final working concentration in LB Amp100 and incubated at 37°C shaking at 250 rpm. The median green fluorescent protein (GFP) fluorescence was measured at various timepoints on the Attune NxT [blue solid-state laser (488 nm excitation), an optical filter at 530/30 nm for GFP fluorescence, and 488/10 nm optical filter for side scatter (SSC)]. For each timepoint, 10 μl of each sample was transferred to 500 μl phosphate-buffered saline (PBS; pH 7.4) in 5-ml polystyrene tubes. The median fluorescence intensity of the FITC-A fluorescence of 10 000 events per sample was measured at a flow rate of 12.5 μl/min.
Promoter library generation and assembly
Promoter libraries were generated by random mutagenesis using GeneMorph II Random Mutagenesis Kit. The first round of error-prone PCR (epPCR) was amplified off the native plasmid as the template. The resulting PCR product was purified and used as the starting template for the next round of epPCR. A total of five to seven rounds of epPCR were completed to achieve high mutation rates. The last four rounds of purified epPCR products were gel purified using QIAquick gel purification kit using the manufacturer’s recommendations with minor modifications in the protocol (see [36]) to remove contamination of the plasmid template prior to assembly with the NEBuilder® HiFi DNA Assembly Master Mix into the library vector.
The library vector with the gfp gene underwent two rounds of PCR; the first was amplified from the purified native PBAD and PRha plasmid templates, and the second from the PCR product from the first round of PCR after purification and DpnI digestion. The vector from the second round of PCR was purified and then used as the library vector to minimize the native plasmid used as the PCR template in the transformed library. Similarly, HiFi assembly of the library vector only was prepared and transformed into 25 μl electrocompetent DH5α to calculate the library background of vectors without the insert within the library.
Small-scale library transformation and selection
The last four rounds of epPCR library were assessed prior to generating the final library at a larger scale. Prior to transformation, the HiFi assembly library mix were desalted using a modified method described in [37]. Instead of using a micropipette tip, a 200-μl PCR tube was used to create a conical-shaped well in the agarose and glucose mix. After 90 min on ice, the desalted library was transferred to a clean tube. Then, 1–2.5 μl of the HiFi assembly library was electroporated into 25 μl DH5α per transformation in 1-mm gap cuvettes (VWR, cat. #76102-576), pulsed at 1800 V in BioRad MicroPulser. Following electroporation, 250 μl pre-warmed super optimal medium with catabolic repressor (SOC) medium was added directly into the cuvette, and then transferred into 5-ml culture tube for recovery at 37°C shaking at 250 rpm for 1 h. Prior to antibiotic selection, 20 μl of the recovered library was plated on solid LB Amp100 to estimate the library size. The rest of the transformed library was transferred to a 15-ml conical tube and 2725 μl of liquid LB Amp100 was added for antibiotic counterselection. Cell death and viability were monitored by sampling 20 μl of the library, diluted in 500 μl of PBS (pH 7.4), over time on the flow cytometer based on the cell count within the gated population of the forward scatter (FSC) and side scatter (SSC) dot plot. After about 3 h of antibiotic selection, the cell counts within the gated population of the culture plateaued and was immediately placed on ice to prevent further growth. The selected library culture was mixed with sterile 80% glycerol (final glycerol concentration of 20%) directly into the 15-ml conical tube and then stored at −80°C. The colonies of the plated libraries from the day prior were counted to calculate the transformation efficiency, as well as the vector only background, to ensure that the library size was large enough but contained <1% vector only background in the entire library population. Transformation efficiencies, vector only background, along with library size and average mutation frequencies for various epPCR rounds in the small-scale library analysis are provided in Supplementary Tables S6 and S7.
Small-scale library analysis via flow cytometry
Assessment of the promoter library median GFP distribution was done as described under the “Promoter analysis in E. coli via flow cytometry” in the “Materials and methods” section with modifications described here: overnight cultures of the controls and the different epPCR round libraries were grown overnight at 30°C, shaking at 250 rpm; controls were grown from individual colonies in 3 ml LB Amp100 from transformations plated within 2 days; libraries were thawed on ice (∼15 min) from the −80°C glycerol stocks prepped using the protocol described under the “Small-scale library transformation and selection” in the “Materials and methods” section; and transferred to 50-ml conical tubes containing 15 ml LB Amp100 for growth.
The plasmids isolated from overnight cultures of the tested libraries were harvested by centrifugation at 6800 × g for 10 min. The supernatant was discarded, and the plasmid libraries were isolated to be prepped for NGS, as described in the “NGS sample preparation” in the “Materials and methods” section, to assess the library diversity and mutation frequency of the last four rounds of the epPCR library.
Large-scale library transformation and selection
Once the library round was determined for sort-seq, a total of eight transformations per library were selected, where 20 μl of the desalted HiFi assembly library was combined with 200 μl electrocompetent DH5α cells. After gently mixing, 27.5 μl of the DNA–cell mixture were transferred into pre-chilled 1-mm gap electroporation cuvettes. After 10 min of incubation, the cuvette was placed in the pulser. Immediately after the DNA–cell mixture was pulsed at 1800 V, the cells were recovered in 250 μl of pre-warmed SOC media per transformation directly in the cuvette. Using a sterile disposable ultrafine tip transfer pipet (VWR, cat. #414004019), the cells were transferred into a 5-ml culture tube per transformation. After recovery for 1 h at 37°C shaking at 250 rpm, all recovered cells were pooled into a sterile 50-ml conical tube. To calculate the approximate size of the library, 20 μl of the recovered cells was serially diluted and plated on solid LB medium Amp100 before the antibiotic selection. To start the library selection, 14 ml of LB Amp100 was added to tube with the recovered library and then cell death and viability of the library were monitored as described under the “Small-scale library transformation and selection” in the “Materials and methods” section.
Library sorting
Seed culture and induction
Libraries were started from four 1.6-ml frozen glycerol stocks in 200 ml of LB Amp100 in a 1-l baffled flask at 30°C for ∼15 h at 150 rpm. As controls, the native promoter plasmids were also grown overnight in 10 ml LB Amp100 in 50-ml conical tubes. Overnight cultures were diluted in pre-warmed 100 ml LB Amp100 to OD600 of ∼0.1 to keep the cells in the log phase and grown in 500-ml baffled flasks for ∼30 min at 37°C, 250 rpm. The controls were grown similarly but in a 250-ml baffled flask with pre-warmed 50 ml LB Amp100. Once the OD600 reached ∼0.2, each of the inoculated cultures were split into two baffled flasks (50 ml each for libraries in 250-ml baffled flasks; 25 ml each for controls in 125-ml baffled flasks) in which one was induced with the final concentration of 0.2% (w/v) inducer and the other with no inducer. The induced and uninduced cultures were grown at 37°C for ∼5–6 h, shaking at 250 rpm.
Post-induction prep for sorting
Samples were removed from the incubator and then immediately placed on ice. A sample amount of the cultures (both induced and uninduced) was collected for initial analysis on the flow cytometer and OD600 readings prior to centrifugation. Both induced and uninduced libraries were transferred to pre-chilled 50-ml conical tubes where each condition were aliquoted 40 ml and 10 ml. A total of four tubes were centrifuged at 4°C, 3000 × g, for 10 min. Supernatant was carefully discarded. The tubes with the 40 ml library cultures were saved for future use, while tubes with 10 ml library cultures were resuspended in 10 ml of pre-chilled PBS (pH 7.4) to be used for sorting. Finally, the resuspended libraries were diluted to OD600 of 0.02–0.025 (1:200–1:400) in ice-cold PBS (5-ml tube) to achieve a sorting rate of <8000 events/s on the iSort™ Automated Cell Sorter (blue solid-state laser at 488 nm and 165 mW, optical filters 525/50BP for GFP and 488/10 SSC, 85 μm ceramic nozzle, and fixed sample flow rate of 23 μl/min). The diluted libraries were placed on ice prior to sorting.
Library sorting and post-sort analysis
To set the sorting gates, the uninduced and induced native promoter were used as guides. Because the iSort™ Automated Cell Sorter is a two-way sorter, low (B1) and high (B4) gates were first sorted for the induced library, then the induced middle two gates (B2 and B3) were sorted together, and finally the B1 and B4 gates of the uninduced libraries. Cells were sorted based on the median GFP fluorescence until all bins reached a minimum of 250 000 cells. The total number of cells sorted per bin, percent target of the library, sorting time, and the event rate per second for both libraries are listed in Supplementary Tables S8 and S9. The sorting quality (purity and cross-over) was confirmed for each sorted bin on the Attune NxT flow cytometer. The plasmid library bins, including the unsorted library, were isolated after recovering in 10 ml LB Amp100 medium overnight (where the PBS:LB Amp100 media ratio was at a maximum of ∼1:3). The extracted plasmid libraries were subsequently used to generate PCR amplicons for NGS.
NGS sample preparation
Plasmid libraries of the recovered sorted and unsorted bins were isolated using Qiagen QIAprep Spin Miniprep Kit according to the manufacturer’s recommendations. The region of interest was amplified with Q5® High-Fidelity 2X Master Mix for 10 cycles using assigned primers (listed in Supplementary Table S4) with the annealing region, 6-nt unique barcode sequence, and partial Illumina adapters overhangs from 1000 ng of the extracted plasmids per 50 μl PCR reaction. Six PCR reaction tubes per bin were combined and prepped for gel electrophoresis. The desired PCR amplicon size was excised from 0.7% (w/v) agarose gel in 0.5× Tris-acetate-EDTA (TAE) buffer and gel purified using the Qiagen QIAquick Gel Extraction Kit with slight modifications of the manufacturer’s protocol as described [36]. Additional impurities were removed using the Qiagen QIAquick PCR Purification Kit. To ensure purity and size (∼100 ng loaded per lane), library amplicons with barcodes were pooled and run on a 0.8% agarose gel in 0.5× Tris-borate-EDTA (TBE) (Supplementary Tables S10 and S11 and Supplementary Fig. S1). The final concentrations of the amplicons were normalized to 20 ng/μl in 10 mM Tris–HCl (pH 8.0) with A260/280 at 1.8–2.0 prior to outsourcing to AZENTA Life Sciences using 2 × 250-bp paired-end Amplicon EZ Sequencing service.
NGS preprocessing workflow
Galaxy web-based platform (on the public server at usegalaxy.org and usegalaxy.eu) [38] was used to preprocess the raw FASTQ data. The preprocessing workflow and parameters used are detailed in the “Supplementary material” sections “G–I”. In brief, paired-end reads were first merged using Paired-End read merger (Supplementary Table S12) [39]. Then, the “Barcode Splitter” tool (https://www.hannonlab.org/resources) was used to obtain merged reads with intact 5′ fixed ends and to separate multiplexed bins, if needed (Supplementary Table S13). Prior to mapping, the barcodes and the fixed 5′ and 3′ ends were trimmed using the “Trim sequences” tools (Supplementary Table S14). Reads were mapped against the reference sequence of native promoter using the BBMap tool (Supplementary Table S15) [40]. “Trim sequences” was used again to trim off any overhangs resulted from the mapping (Supplementary Table S16). Reads were converted from BAM to FASTA file format with Samtools fastx tool from the SAMtools software package [41] and then unique reads were obtained using the “Collapse tool”. The FASTA files containing the unique sequences were converted into a tabular format to enable importation into Microsoft Excel for the purpose of counting the occurrence of each nucleotide at every position (Supplementary Table S17). To calculate the nucleotide counts per position, the aligned reads underwent a series of formatting changes using the “Replace” tool (Supplementary Tables S18-S22) and “Convert delimiters to TAB” in Galaxy prior to exporting the reads as a CSV file (https://github.com/bgruening/galaxytools). This file was imported into Microsoft Excel for further processing of the data.
During the conversion from BBMap to FASTA file formats, some of the read alignments were misaligned if deletions were found in the 5′ end. Indications of misaligned sequences were based on the calculated hamming distance between each read and the native sequence using the following syntax in Microsoft Excel (the “Supplementary material” section “H”):
Hypermutated sequences were filtered from the read set using the calculated hamming distance. Reads with a hamming distance >20 between each read and native sequence were removed. The number of reads at each NGS preprocessing steps are shown in Supplementary Table S23 and Supplementary Table S24.
Generation of information footprints and enrichment maps
Information footprints and the enrichment heat maps were calculated as described (“Supplementary material” section “I”, see also Supplementary Table S25) [35, 36, 42]. In brief, the nucleotide occurrence at each position was counted and normalized to the total number of reads in each library. Mutual information between expression bins and bases at each nucleotide position are calculated via the following equation:
where |${{b}_i}$| is the base at the |$i$|th position, |$\mu$| is the expression activity bin, |$f( {{{b}_i},\ \mu } )$| is the joint frequency distribution, and |$f( {{{b}_i}} )$|and |$f( \mu )$| are the marginal frequency distributions. Enrichment values are the log2 ratio of each base’s frequency in the bin of interest normalized to the frequency of the unsorted population (B0). The information footprints and enrichment heat map calculations were completed in Microsoft Excel and then transferred to GraphPad Prism 10.0.2 (232) to generate the plots.
Promoter validations
Validation plasmids in NEB5α were grown overnight at 37°C, shaking at 250 rpm in 3 ml LB Amp100 in 5-ml culture tubes. Overnight cultures were diluted to an OD600 of ∼0.05 in pre-warmed 10 ml LB Amp100 in 50-ml conical tubes and grown at 37°C. Once the OD600 reached ∼0.1–0.2, cultures were transferred either to 5-ml culture tubes or 2-ml deep-well plates for induction. For the initial promoter validation experiment, cultures were induced in 5-ml culture tubes by adding 375 μl of cultures and subsequently inducing with 125 μl LB Amp100 or 4× rhamnose or arabinose to reach the final working concentration in LB Amp100. For dose–response promoter validations, cultures were induced in 2 ml-deep-well plates with 450 μl of cultures and subsequently induced with 150 μl LB Amp100 or 4× rhamnose or arabinose to reach the final working concentration in LB Amp100. Plates were sealed with breathable rayon film to limit evaporation during incubation at 37°C. For all validations, endpoint measurements of the median GFP fluorescence were measured on the flow cytometer. For flow cytometer measurements, 10 μl of each sample were transferred to 500 μl PBS (pH 7.4) in 5-ml polystyrene tubes. The median GFP distribution histograms from flow cytometry experiments were generated with the Attune NxT acquisition software. The median GFP fluorescence and OD600 measurements were averaged and plotted with the standard deviations in GraphPad Prism 10.0.2. All replicates represent biological samples grown from individual colonies.
Results
PBAD and PRha library generation
To identify nucleotide sites that alter gene expression when mutated, promoter libraries were constructed by mutating the upstream regions of the RNAP binding sites, including known binding sites of AraC and RhaS (Fig. 1). The mutagenized region for PBAD, 253 bp in length, includes the araO2, araO1, CRP, and araI1 and araI2 half-sites, while the 97-bp mutagenized region for PRha includes the CRP and the RhaS-binding sites rha1 and rha2. In both promoters, the TF-binding sites partially overlap the −35 box, thus they were included in the mutagenized regions. PBAD and PRha promoters underwent four and five rounds of epPCR, respectively, and were cloned into the vector to drive the expression of the gfp reporter gene in E. coli DH5α (Supplementary Fig. S2-Supplementary Fig. S4). The vector also carries a constitutively expressed mCherry reporter gene to isolate viable cells harboring the library plasmids after sorting. The final library sizes and average mutation rate per position of PBAD and PRha were approximately 661 000 with 5.7% and 583 000 with 6.4%, respectively, based on the transformation efficiencies (Supplementary Fig. S5).
Promoter libraries were sorted based on the median GFP fluorescence under induced (0.2% arabinose or rhamnose) and uninduced (0% arabinose or rhamnose) conditions. Induced libraries were sorted into four expression bins (B1 to B4, ranging from low to high expression) while uninduced libraries were sorted into two expression bins (low, B1, and high, B4) (Supplementary Figs S6 and S7). The promoters of the sorted and unsorted (B0) bins were deep sequenced via NGS and preprocessed to obtain unique reads across all bins for PBAD and PRha (Supplementary Tables S8 and S9). The importance of mutations at each nucleotide position on bin location is quantified by mutual information and relative enrichment [35, 36].
Sort-seq identifies canonical binding sites and mutations that alter promoter response and strength
Our first goal was to identify all sites that affect promoter function. Using information footprints and enrichment heat maps generated for each promoter, we identified all the well-annotated regulatory sites for each promoter at the nucleotide level. Mutual information provides a strong prediction of site-specific effects while the enrichment heat maps are used to determine the specific nucleotide residues. Since mutual information combines data from all four bins to indicate the importance of each location, it compresses the information at each site. Therefore, we use enrichment maps that focus on individual bins to which sequence is the most important.
PBAD
We begin with the PBAD promoter. Under induced (0.2% arabinose) conditions, mutual information values were highest in the araI2- and araI1-binding sites, and were moderate in the CRP and araO2 sites (Fig. 2 and Supplementary Fig. S8). The mutual information values in the araO1 site were not higher than background (Supplementary Fig. S8). These results are consistent with the described mechanism of PBAD positive regulation where arabinose-bound AraC binds to araI1 and araI2, recruiting RNAP, and co-activator CRP binds to its binding site (Fig. 1A). Importantly, we observe differential importance within each binding site, indicating nucleotide positions that are more or less likely to drive the DNA–protein interaction strength. The araI1 sequence, and to a lesser extent the CRP site, is highly conserved, as indicated by the depletion (orange) of mutations in the high gfp bin (B4) (Fig. 2d and Supplementary Fig. S8). Certain mutations in araI2 were enriched (blue) in the high gfp bin (B4), suggesting that this region might be of interest to tune gfp expression. The araO2 was highly enriched with mutations in the TSS distal region when highly expressing gfp, aligning with previous research that destroying araO2 prevents binding of AraC for repression [12, 43]. When uninduced, we observe a similar mutual information and enrichment profile in the araO2 region as in the induced condition; any mutation contributes to increased GFP activity in P43–P48. While it has been reported that negative regulation in the absence of arabinose occurs when AraC is bound to araO2 and araI1 [12], we did not observe an accumulation of mutations in the araI1 site and the mutual information values within the site were low compared with araI2 (Fig. 2d and Supplementary Fig. S9).
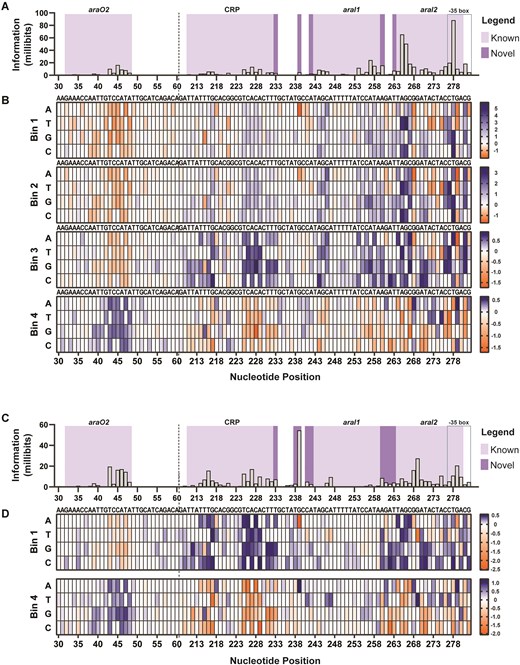
PBAD information footprints and enrichment heat maps under 0.2% arabinose and 0% arabinose. (A, C) Information footprints were generated using mutual information, shown in millibits, to locate specific sites that play a role in modulating GFP expression. The importance of the AraC-binding sites (araO2, araO1, araI1, and araI2), CRP-binding site, and the -35 box are mapped at the nucleotide level under (panel A) induced and (panel C) uninduced conditions. Regions P61-209, which includes araO1, is not shown here to fit in the main figures. The fully mutagenized data are shown in Supplementary Figs S8 and S9. Heat maps depict the sequence enrichment (in blue) and depletion (in orange) at each position for each sorted bin in the (B) 0.2% and (D) 0% conditions. Enriched sequences in the high gfp bin, B4, but depleted in the lowest gfp bin, B1, portray nucleotides that increase gfp, while enrichment in the B1 but depletion in B4 are sequences that decrease gfp.
In the uninduced condition, certain sites showed relatively high mutual information values, displaying a mix of congruence and divergence from the existing literature. We observed high mutual information values within the araO2- and CRP-binding sites. The presence of enriched mutations (blue) within the araO2 sites in both uninduced and induced B4 enrichment heat maps provides additional evidence supporting AraC’s role in the repression of PBAD. Additionally, the depleted mutations (orange) in the CRP binding sites (P216, P227, P231, and P233) in the 0.2% B4 enrichment heat maps match well with the requirement of CRP for full activation of PBAD. Upstream of the araI1 binding site, the data reveal overlapping priorities: aligning with the consensus CRP-binding motif and a proto-promoter site (P213 – ATTTGC – 17 bp gap – TATGCC – P241). Mutations enriched in the 0% B4 heat maps form a sequence matching the canonical σ70 with notable enrichments of A213T, T215G, C218A, G239A, and C241T. Taken together, these mutations show a potential promoter of P213 – TTGTGA – 17 bp gap – TATACT – P241 (mutations bolded) and the same time more closely aligning with the CRP-binding site consensus sequence (P214 – TGTGA – 6-bp gap – TCACA – P229). A similar pattern can be found in the induced condition data, but with much smaller mutual information values due to the promoter being in the ‘on’ state.
Enriched mutations at a location with a significant mutual information value that did not align with consensus sequences were found within and near araI2 (G268A, T271A, C273T, A275T, G279A, A280G, and G282A).
Validation of PBAD promoter variants
Having identified the regulatory sites for both PBAD, we aimed to validate the predicted sequences that outperformed the native sequence based on the information footprint and enrichment heat maps. Sequences were selected based on the enrichment heat maps of the induced (0.2%) bins, while being cognizant of the mutants predicted to raise basal expression in the uninduced (0%) data (Fig. 2 for PBAD). We evaluated individual promoter variants and their respective native promoters in E. coli by flow cytometry under uninduced (0%) and induced conditions (0.2% - l-arabinose (t = 5 h, n = 2).
We start with mutations in araO2:T43A (position 43 mutated from T to A), C45G, A46G, and T47A; as well as a combination construct with araO2 site mutations (termed P39-48): A39G, T43A, C44T, C45G, A46G, T47A, and A48T. These mutations led to a 2.5x to 3.1x increase in GFP expression under the 0.2% condition while also increasing the uninduced expression by 1.7x to 1.9x (Fig. 3A). Although there was an increase in basal expression, the dynamic range of these mutants exhibited 1.4× to 1.8× improvement over the native promoter. The absolute basal expression for these mutants remains low.
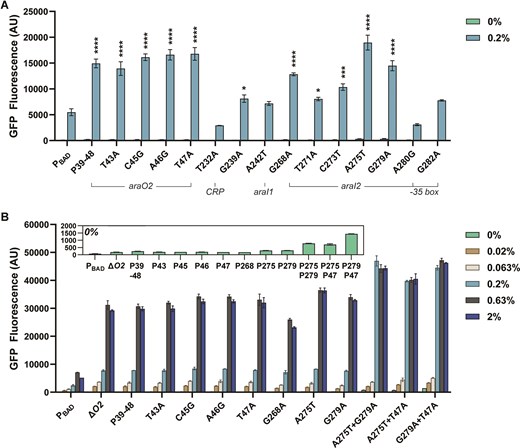
PBAD validations. (A) Sequences picked from the information footprints and enrichment heat maps were validated by flow cytometry. Individual promoters were induced with 0% and 0.2% l-arabinose (w/v) and the median gfp expression was measured after t = 5 h. (B) Single mutant promoters with improved promoter expression strength were combined and assessed after 24 h after induction with a range of l-arabinose (0%, 0.02%, 0.063%, 0.2%, 0.63%, and 2%). Statistical difference of the 0.2% l-arabinose induced samples between native and variants were determined by a two-tailed t-test. Error bars show the SD (n = 2); P-value summary: ****P < .0001, ***P < .001, *P < .05.
Mutations in the araI1 half-site were avoided due to its predicted negative effect on promoter activation; no mutations were enriched in the induced B4 at high information loci. Instead, we chose two mutations located in between CRP and araI1: G239A and A242T. Their dynamic ranges remained unchanged. G239A showed a slight increase in fluorescence levels under both 0% and 0.2% arabinose despite having the most significant mutual information in the 0% information footprint.
Five sites in the araI2 and the overlapping −35 box region with high mutual information values where mutations were enriched in the induced B4 were chosen for validations: G268A, T271A, C273T, A275T, and G279A. These mutations demonstrated improved induced GFP fluorescence, with G268A, C273T, and T271A showing 2.3×, 1.9×, and 1.5× increase, respectively. P275 and P279 exhibited a 3.2× increase in basal fluorescence, with induced GFP fluorescence of 3.5× and 2.6× increase, respectively. We also included G282A, located in the −35 box, which did not show significant improvements.
Furthermore, both T232A and A280G were chosen as negative controls to demonstrate moderated levels of GFP expression. Enrichment heat maps of B4 show that the native sequences of P232 (located in CRP binding site) and P280 (araI2/-35 box) were important in full induction of the promoter. We hypothesized that mutations at P232 and P280 would result in decreased expressed and included to validate mutations in both directions. Both mutants performed as predicted, demonstrating decreased levels of GFP expression.
We further evaluated the promoter responses of the mutated promoters that exhibited a significant increase in fluorescence and induction fold compared with the native promoter to variable amounts of the inducer concentration (0% to 2% arabinose) using half-log dilutions (Fig. 3B). This included all four single nucleotides in araO2, araO2 combined promoter (P39-48), an araO2 deletion (ΔaraO2), and three in araI2 (G268A, A275T, and G279A). We also created three double mutant promoter variants with combinations of A275T, G279A, and T47A. Although these variants had elevated basal expression in Fig. 3A, we were curious whether the combination of the two variants would result in increased induction GFP fluorescence while maintaining the same level of basal expression as to when variants were tested individually.
Dose-response validations are shown in Fig. 3B and were measured at 24 h post-induction (n = 2). All variants located in araO2 showed similar responses to various concentrations of arabinose. Maximum gfp expression was observed at the 0.63% (w/v) arabinose induction concentration which is ∼4× that of the unmutated promoter. The three double mutant promoters increased both the maximum induction fluorescence and sensitivity. At 0.2% (w/v) arabinose induction, these promoters led to 16.2–19.1× more gfp expression over the native promoter and ∼6× that of the maximum PBAD expression at its max (0.63% arabinose). Basal expression of the double mutant promoters also increased but the dynamic ranges of A275T + T47A and G279A + T47A improved by ≥2× over the native promoter. Promoter variant G279A + T47A had the highest basal expression.
Sort-seq identifies canonical binding sites and mutations that alter promoter response and strength – PRha
Similarly, we applied sort-seq to PRha and then validated the predicted sequences with improved performance. Regulatory elements of PRha, rhaI1, rhaI2, and CRP, were identified under induced conditions (Fig. 4A-B). The two half-sites, rhaI1 and rhaI2, as well as the CRP binding site, were in alignment with the literature [32]. Like PBAD, the most proximal RhaS binding site, rhaI2, contributed the most to gfp expression, followed by rhaI1, and then CRP. In the presence of rhamnose, the outer and inner regions of the rhaI half-sites increased in information content, specifically at P57-P62 and P69-P74 in rhaI1 and P89-P93 and P102-P105 in rhaI2. These regions were previously predicted to be where RhaS monomers of each dimer interacted with the DNA at each rhaI half-site [32, 44]. Unlike PBAD, the CRP-binding site of PRha was especially important at P41 in the 0% information footprints (Fig. 4C), where mutation at this site could lead to leaky expression. Although the annotated −35 box was only included in the analysis because it shared overlapping sites with rhaI2, it is interesting to see that the two nonoverlapping sites of the −35 box are not as prominent in contributing to the gfp expression, unlike what we observe with PBAD.
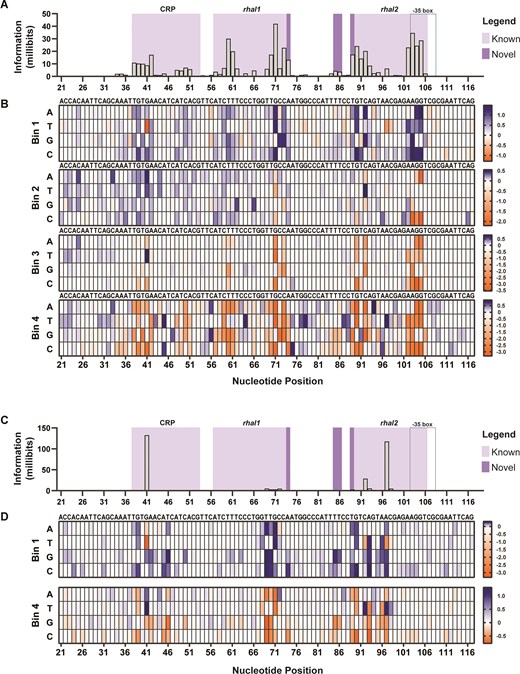
PRha information footprints and enrichment heat maps under 0.2% l-rhamnose and 0% l-rhamnose. (A, C) Information footprints were generated using mutual information, shown in millibits, to locate specific sites that play a role in modulating GFP expression. The importance of the RhaS binding sites (rhaI1, and rhaI2), CRP-binding site, and the −35 box are mapped at the nucleotide level under (panel A) induced and (panel C) uninduced conditions. (B, D) Heat maps depict the sequence enrichment (in blue) and depletion (orange) at each position for each sorted bin in the (panel B) 0.2% and (panel D) 0% conditions. Enriched sequences in the high gfp bin, B4, but depleted in the lowest gfp bin, B1, portray nucleotides that increase gfp, while enrichment in the B1 but depletion in B4 are sequences that decrease gfp. For validation studies, specific sequences of positions signaled with importance in the information footprints were chosen based on the sequence enrichment heat maps.
While analyzing the nucleotide maps, we found high information loci beyond the annotated rhaI half-sites. While AraC binds to direct repeat sequences that are separated by 4 bp to activate transcription, RhaS binds to rhaI1 and rhaI2 inverted repeat sequences separated by 16 bp [32, 44]. Interestingly, our data suggested that both half-sites extend by one nucleotide (P74 and P89 in our nomenclature), each resulting in an 18 bp half-site and shortening the space in between from 16 to 14 bp.
Validations of PRha promoter variants
Initial validations for PRha mutants included eight constructs with a variety of predicted promoter performances, including those we expect to increase promoter strength. Mutations T91G and G94A, within the annotated rhaI2 site, were chosen due to significant mutual information values and high enrichment in the induced B4 and the lack of such features in the uninduced condition, indicating little effect on basal expression. Unlike PBAD, there were fewer sites in RhaS binding regions in PRha that contributed to basal activity, where A97T stood out. A97T was included to demonstrate high basal expression levels since it was highly enriched in B4 of both the induced and uninduced condition. The most unusual mutation, C92T, showed enrichment in the high gfp expression B4 in the uninduced condition while the same mutation was enriched in the induced B1 and B2 and depleted in the higher bins. We also include T84A, just upstream of the rhaI2 site, where the mutation appears to be tolerated, but not preferred.
Promoter variants within the CRP binding site (G41T, A45T, and A45C) were also constructed for analysis. Mutation G41T was chosen due to its unique enrichment pattern where the mutation is severely depleted in the induced and uninduced B1, highly enriched in the induced B3 and uninduced B4, but not in the induced B4. This indicates that this mutation leads to moderate expression levels with higher basal expression. Even though the mutual information at P45 (MI: 2.3 millibits) in the 0% information footprint was lower compared with the other chosen sites, our rationale for including this mutant was primarily because PRha had a better induction fold with its native CRP sequences despite having lower affinity to CRP than the E. coli CRP consensus sequences in a different study [20]. The E. coli CRP consensus sequence and the PRha CRP sequence differ by one base at the underlined base (TGTGA-6 bp-TCACA). Furthermore, of the six non-consensus regions in P43–P47, P45 had the highest information content and contained two mutants enriched in the highest gfp bin but depleted in the lowest gfp bin: A45T and A45C.
In the initial analysis (t = 5 h, n = 2), mutations in the rhaI2 site yielded results expected from sort-seq enrichment patterns (Fig. 5A). High basal expression was observed for C92T and A97T, with the former being overall weak and the latter strong in both 0% and 0.2% rhamnose induction. Mutant promoters with T91G and G94A had low levels of basal expression with slightly but significantly increased expression in the 0.2% induced condition. The T84A mutation shows only a slight reduction in induced expression and no change when uninduced. In the CRP-binding region, G41T resulted in leaky expression and lower gfp expression compared with the native sequence when induced as predicted by enrichment in B2 and B3 (0.2%). The variants at position 45 yielded slightly higher, but not significantly so, GFP output.
![PRha validations. (A) Single mutant promoters were induced with 0% and 0.2% l-rhamnose (w/v) and the median gfp expression was measured after 5 h after induction by flow cytometry. (B) Single mutant promoters with improved promoter expression strength were combined and assessed 24 h after induction with a range of l-rhamnose [0%, 0.02%, 0.063%, 0.2%, 0.63%, 2%]. Statistical difference of the 0.2% l-rhamnose induced samples between native and variants were determined by a two-tailed t-test. Error bars show the SD (n = 2); P-value summary: ****P < .0001, **P < .002, *P < .05.](https://oup.silverchair-cdn.com/oup/backfile/Content_public/Journal/nar/53/7/10.1093_nar_gkaf224/1/m_gkaf224fig5.jpeg?Expires=1749392438&Signature=wCieKQTaIT3VrKqrUFq2UlUlh6~QLOwg6BubrFCqOrjI~dqlYCO78xZ-CzPC-DtWOAE1qppmmDX9wp3w0Kg2Q9YN93lpWVg42jTvQDIMTz~WzSym7p7VEILvnYgZdk03v-dKwBnX3u8hphZtlcWpAj-B6I1mp9X5~D1Q638w5~IBBWL9nI6Kb03xrQPoAdSdcFgXvEn~OXjv7hA989KTmxj3rYU4807RyXqr7KxkTHRPnDT3LMmo9nt42~Qsv7YFaoOsUHDUbuNk-sV2cu5hkhz1vXmzd6UtTuh6iHVg-zz77UsKYXzwGRYo6Itfvu-sCEHVS6OUOPvjqOVnNjsYnA__&Key-Pair-Id=APKAIE5G5CRDK6RD3PGA)
PRha validations. (A) Single mutant promoters were induced with 0% and 0.2% l-rhamnose (w/v) and the median gfp expression was measured after 5 h after induction by flow cytometry. (B) Single mutant promoters with improved promoter expression strength were combined and assessed 24 h after induction with a range of l-rhamnose [0%, 0.02%, 0.063%, 0.2%, 0.63%, 2%]. Statistical difference of the 0.2% l-rhamnose induced samples between native and variants were determined by a two-tailed t-test. Error bars show the SD (n = 2); P-value summary: ****P < .0001, **P < .002, *P < .05.
The best-performing single mutations (A45T, T91G, and G94A) and all two-mutation combinations were evaluated under rhamnose inductions ranging from 0% to 2% (w/v) (Fig. 5B). All constructs retained the low basal expression of the native sequence. The single mutation constructs yielded consistent results at the 0.2% induction condition from initial analysis (Fig. 5A). Of the single mutants, only the G94A mutation yielded significantly higher expression at the 2% induction condition, resulting in a ∼40% increase in fluorescence. All three double mutant promoter variants outperformed the single variants and the native promoter in their fluorescence output by 2.4× when induced with 2% rhamnose over the native promoter while maintaining low basal levels improving their dynamic range.
Discussion
In this work, we explored the nucleotide-level characteristics of two commonly used E. coli promoters, PBAD and PRha, with the aim of increasing their dynamic ranges. Previous investigations into the interactions of AraC and RhaS with their respective binding sites have primarily relied on low-throughput approaches and isolated regulatory components. Here, we employed a high-throughput approach to systematically map multiple functional regulatory sites at the nucleotide level within the local DNA context in vivo. This method allowed us to identify specific sites that contributed to promoter response under induced and uninduced conditions, offering insights into potential sites that increase promoter performance.
Binding site characterization
In our initial findings, we found known binding sites of both promoters, PBAD and PRha, along with subtle differences reported from previous studies. Specifically, we observed that the rhaI half-sites in PRha are better characterized as 18 bp in length, not 17 bp as previously reported in studies that used DNase footprinting assays [32]. This difference likely arises from the nature of DNase footprinting assays, which identifies potential binding sites where the regions are protected by TFs from exonuclease activity in an in vitro environment. In contrast, our sort-seq approach provides information on how different regions contribute to gene regulation by directly linking genotype to phenotype. While DNase footprinting assays identified the half-sites as 17 bp based on protection patterns, our findings suggest that an 18-bp characterization offers a more accurate representation of their functional role.
In PBAD, we confirmed the identification of direct repeat sequences in araI1 and araI2 (TAGCxxxTxxxxCCxxA), as well as the shared sequences between araI1 and araO2 (xAxxxxxxxxxTCCATA) [45]. Furthermore, we confirmed binding of AraC to araI1 direct repeat sequence (xAGCxxxxxxxTCCATA) under induced conditions [31]. Interestingly, under uninduced conditions, the mutual information at the TCCATA motif in araI1 (P254-P259) was unexpectedly low. Instead, we only find P246 and P247 in araI1 and sites outside of the known binding regions such as P238 and P239 located, with significant mutual information when arabinose was absent.
During our search for mutations that improved (or reduced) the dynamic range, we found that many of these mutations were primarily found within the characterized TF-binding sites for both promoters. However, it was surprising that few mutations were observed within the araI1 region of the PBAD promoter, with the native sequences in araI1 appearing largely conserved. Enrichment maps provide information on which elements are necessary to express at the desired level of induction at sites containing information content. When all three mutations within a position are depleted (orange) within a bin, it indicates that the native sequence (white) is the preferred nucleotide for that specific induction level. This was the case in B4 of the induced condition (Fig. 2B). One possible explanation is that while AraC has a higher binding affinity to araI1 than araO2 and araI2 [45, 46], the binding of the second subunit of AraC to the araO2 and araI2 regions determines whether transcription is repressed or activated.
Potential role of inverted repeat sequences in PBAD
Repression mechanisms for PBAD have primarily focused on DNA looping created by binding of AraC to araO2 and the direct repeat sequences of araI1. However, our data indicated a potential role of inverted repeat sequences, particularly P238, P239, P246, and P247, in down-regulating expression. Previous studies have shown that AraC can bind to inverted repeat sequences that overlap the araI1 direct repeat sequence down to the AGC motif of araI2 (P245–P267 in our map). Although direct repeat sequences are more favorable for activation [45], the potential role of invert repeat sequences in repression requires further exploration as it may play a role in influencing the curvature and flexibility of the DNA binding sites that affects the binding specificity [47].
Furthermore, the behavior of intrinsically disordered regions of TFs is influenced by the structural constraints of regions surrounding their binding sites [47, 48]. These intrinsically disordered regions allow flexibility to adopt various TF conformations allowing them to interact with different partner molecules, such as DNA and protein.
P238 and P239 lie upstream of this inverted repeat sequence but complements in sequence with P247 and P246, respectively. While the validation of the G239A promoter exhibited minimal effect on basal expression, despite having the highest mutual information (54.5 millibits) in the 0% condition, the significance of P246 under 0% condition in our data indicated increased basal expression if mutated to a T. However, the consequence of this mutation would most likely destroy the ability to activate transcription. P246, which is the third position of the positive regulating AGC motif of araI1, directly interacts with amino acid residue 212 of the AraC protein, while the 208 residue of AraC contacts the two upstream adjacent sequences [45]. The interactions between P239 and P246 may contribute to maintaining DNA topology, preventing AraC from binding to the positive regulating AGC motif in araI1, while the TCCATA motif recruits AraC with high affinity; however, TCCATA motif only contributes to promoter activation when AraC is in its activating conformation.
Furthermore, in regard to the effects of P239 on basal expression may be only significant in combination with additional mutational sites, implying a synergistic effect with another site or sites. Our previous study found a double mutant promoter to exhibit 4× improvement over the native promoter, whereas no effect was observed with the individual mutations [36]. As noted in results, taken together, the mutations enriched in the uninduced B4 appear to take the form of a σ70 promoter (P213–241).
Promoter variants with improved dynamic range
We then identified nucleotide sites predicted to increase the dynamic range of PBAD and PRha. We obtained three PRha promoter variants, in particular, A45T + G94A, T91G + G94A, and A45T + T91G, that exhibited 2–2.4× improvements in dynamic range over the native promoter, while maintaining low basal levels. For the PBAD combinations, A275T + G279A, A275T + T47A, and G279A + T47A increased the promoter strength nearly 7×. Flow cytometry data revealed monomodal behavior, indicating that the promoter variants titrated expression in single cells rather than affecting on/off behavior (Supplementary Fig. S11). We also observed improved sensitivity in the PBAD variants, with maximum expression elicited at 0.2% arabinose compared with 0.63% arabinose in other constructs and the native sequence. Increase in promoter strength and sensitivity could offer an alternative to the T7 promoter, which is known to be 2–10× stronger than the native PBAD [14], for max production [13]. Although slightly increased basal expression was observed, basal expression can be controlled using glucose in the medium for glucose-responsive catabolite repression. Alternatively, promoters with single mutations located in araO2 exhibited 2× increase in basal expression and 3× increase in induction. Moreover, some PBAD promoter variants exhibited moderate increases in dynamic range without increasing the basal levels, such as G268A and C273T.
For both promoters, the double mutants significantly outperformed the single mutants. This likely reflects changes in the binding affinities of the TFs, maximizing promoter activation. For the PBAD promoter, the double mutants result in maximal expression at 0.2% arabinose concentration, indicating an increase in sensitivity. For the PRha promoter, the double mutants show broadened dynamic range, with continued increasing expression with no signs of saturation even at 2% rhamnose.
While our primary goal was to identify the strongest promoters for our purposes, we also recognize the importance of exploring promoter mutants with moderate strength, as these have been shown to enhance protein production levels [49]. By mixing and matching these findings, we can develop promoters with varying strengths tailored to optimize expression of the protein of interest.
Insights into PBAD basal activity and induction
Our data supported previous reports of repression defective mutations in araO2, araI [25], and the araI2/-35 box overlap [50, 51]. Due to its role in repression via DNA looping, deletion of the araO2 motif led to a 5- to 30-fold increase in basal levels [12]. Analogously, our data showed that single nucleotide substitutions in araO2 exhibited similar elevated levels of basal activity, as well as induction levels, across all promoter variants in araO2. Similarly, araI2 promoter variants exhibited increased basal activity. Promoter variants with the highest increase in basal levels were those located within the TCCATA motifs of araI2 and araO2, specifically promoter variants carrying A275T, G279A, and T47A. These mutations likely affected the binding affinities of AraC at these sites. AraC is ∼100× and ∼10× higher affinity for araI1 and araO2, respectively, compared with araI2 [45, 46]. Replacing the araI2 motif with the araI1 results in constitutive expression in the absence of arabinose [7, 51]. Both P275 and P279 variants lie within the TCCATA (underlined nucleotides) motif located in araI2, while P47 lies the TCCATA (underlined nucleotide) in araO2. Although it is unlikely for the G279A variant to increase the binding affinity of AraC to the TCCATA motif within araI2, a mutation in the same position of TCCATA (underlined) motif at araO2 would be affected. The combination of A275T (araI2) with T47A (araO2) would increase the binding affinity of AraC to the araI2 while lowering the binding affinity at araO2. This would lead to significantly higher levels of basal expression compared with the single mutation variants.
The increased basal fluorescence observed in the combined promoter variant G279A + T47A, nearly doubled compared with A275T + T47A, can be attributed to the significance of P279, located within the four shared base pairs where AraC and RNAP bind [50]. Overlapping binding sites play a critical role in promoter activation by AraC, as they enable AraC to recruit and convert RNAP from the unstable closed complex to the stable open complex, initiating transcription through interaction with the α-subunit of RNAP [52]. Overlapping binding sites have been found in other activating promoters with low affinity binding sites for the σ factor, requiring multiple proteins recruit the σ factor [33]. Although the overlapping binding sites may increase the probability of steric interference, the binding affinities of the TF and the RNAP compensate for this interference [53]. In cases where dual binding sites have different affinities, the site with the higher affinity dominates [53]. Evidence shows both AraC and σ70 of the RNAP can bind to the shared overlapping sequences with araI2 and the nonoverlapping sequences of the −35 box [54]. The PBAD RNAP binding sequence (CTGACG-18-TACTGT) differs from the consensus E. coli RNAP (TTGACA-17-TATAAT), where σ70 contacts the underlined sites of the −35 box motif, TTGACA [55]. In our data, the underlined sites correspond to P279 and P281. G279A mutation at the 3rd position of the −35 box away from the consensus sequence might weaken RNAP binding. However, the promoter activity exhibited higher activation in both basal and induction, suggesting that the same mutation at the same site increases the binding affinity of AraC.
Insights into PRha low basal activity and induction
Similarly, the PRha promoter has a weak RNAP binding site where it only matches the consensus sequence at the underlined sites (AGGTCG-17-TAGACT) and requires RhaS to directly interact with the α-subunit of RNAP to initiate transcription [56, 57]. Like AraC-PBAD, RhaS has a higher affinity to rhaI1 than rhaI2 [26]. Despite the many similarities between the two promoters, our PRha promoter variants generally maintained tight basal activity. We did not validate any sequences in the rhaI2/-35 box overlapped regions, however, our enrichment data contained no enriched sequences in the highest gfp expressing bins of both the 0% and 0.2% conditions (Figs 4C and 3D), whereas PBAD contained enriched mutation sequences in its overlapping region (Fig. 2C and D). Congruently, replacing rhaI2 with rhaI1 did not demonstrate rhamnose independent activation [26].
It was interesting to find that our improved PRha promoter variants containing T91G and G94A matched sequences that were the native sequences of rhaI1 and of another half-site, rhaI6, of another RhaS-dependent promoter, PrhaT, responsible for rhamnose transporter synthesis [58]. RhaS also activates PrhaT by binding to rhaI5 and rhaI6 half-sites [58]. The different rhaI half-sites vary in their binding affinities to RhaS (Supplementary Fig. S10), and it has been shown that replacing rhaI2 with the highest binding affinity half-site, rhaI1, followed by rhaI6, have led to increased induction fold in vivo and in vitro [26]. Similarly, mutating P92 away from the half-site consensus sequences (i.e. C92T) led to a significant reduction in activation. A97T was difficult to find an explanation since it is located six bases upstream of the −35 box. This site and mutation was not found to affect activation of PRha in β-galactosidase assays [32]. However, high expression in both induced and uninduced conditions in our validation results of A97T supports our conclusions derived from information footprints.
This study focused on engineering PBAD and PRha promoters with improved dynamic range with low basal activity in E. coli; however, this approach could be applied to predict critical binding sites and specific sequences in different hosts with high transformation efficiencies. Sort-seq can give us insights and guidance on engineering both existing and uncharacterized promoter systems with desired outcomes.
Acknowledgements
We would like to acknowledge Jada Roth and Sabina Eichhorn for assisting in the various aspects of this project. The graphical abstract was created in BioRender [Kim, N. (2025); https://BioRender.com/u91w539].
Author contributions: Nancy M. Kim (Conceptualization [supporting], Data curation [lead], Formal analysis [lead], Investigation [lead], Methodology [lead], Visualization [lead], Writing—original draft [lead], Writing—review & editing [lead]), Danqia Peng (Investigation [supporting]), and Nicholas R. Sandoval (Conceptualization [lead], Formal analysis [supporting], Funding acquisition [lead], Methodology [supporting], Supervision [lead], Writing—original draft [supporting], Writing—review & editing [supporting])
Supplementary data
Supplementary data are available at NAR online.
Conflict of interest
A provisional patent has been filed on the modified promoter sequences (US 63/599,160).
Funding
This work was supported financially by the National Science Foundation through the CAREER [grant number AN 1847226] programs. Funding to pay the Open Access publication charges for this article was provided by internal funds.
Data availability
Sequencing data have been deposited to NCBI under project number PRJNA1124361.

Comments