


Abstract
The single-cell proteomics enables the direct quantification of protein abundance at the single-cell resolution, providing valuable insights into cellular phenotypes beyond what can be inferred from transcriptome analysis alone. However, insufficient large-scale integrated databases hinder researchers from accessing and exploring single-cell proteomics, impeding the advancement of this field. To fill this deficiency, we present a comprehensive database, namely Single-cell Proteomic DataBase (SPDB, https://scproteomicsdb.com/), for general single-cell proteomic data, including antibody-based or mass spectrometry-based single-cell proteomics. Equipped with standardized data process and a user-friendly web interface, SPDB provides unified data formats for convenient interaction with downstream analysis, and offers not only dataset-level but also protein-level data search and exploration capabilities. To enable detailed exhibition of single-cell proteomic data, SPDB also provides a module for visualizing data from the perspectives of cell metadata or protein features. The current version of SPDB encompasses 133 antibody-based single-cell proteomic datasets involving more than 300 million cells and over 800 marker/surface proteins, and 10 mass spectrometry-based single-cell proteomic datasets involving more than 4000 cells and over 7000 proteins. Overall, SPDB is envisioned to be explored as a useful resource that will facilitate the wider research communities by providing detailed insights into proteomics from the single-cell perspective.

Introduction
Refining the molecular profiles with single-cell resolution enables a systematic delineation of cellular behavior, development, and disease mechanisms (1,2). Recent advances in single-cell technologies have enabled the measurement of various molecular levels across the biological central dogma, including DNAs, RNAs, proteins and metabolites (3). Single-cell transcriptomic technology for quantifying transcription levels of genes is currently the most developed and widely applied method, which is commonly regarded as a surrogate measure of protein expression (4). However, this proxy assumption overlooks the substantial disparity between mRNA and protein levels, due to complex post-transcriptional modifications, RNA/protein degradation and post-translational modifications (5–7). These asynchronous changes become even more pronounced when measured at the single-cell level. In this regard, advancements in single-cell proteomic technology for quantifying protein levels within individual cells are rapidly progressing and hold great promise for direct characterization of protein levels (8,9).
The single-cell proteomics enables the quantification of protein abundance, identification of post-translational modifications and monitoring of proteoform dynamics within individual cells, thereby providing valuable insights into cellular phenotypes beyond what can be inferred from transcriptome analysis alone (10). The technique of single-cell proteomics has been highlighted as the ‘Method to Watch’ by Nature Methods in 2018 (11). ‘As single-cell proteomics emerges, perhaps labs can avoid the need to infer protein levels from mRNA abundances’, denoted in ‘A dream of single-cell proteomics’ technology feature paper of Nature Methods in 2019 (12). More recently, the combination of a nascent sample preparation process with ultra-high resolution mass spectrometry and isobaric labelling strategy has significantly enhanced single-cell proteomics technology. Such automated, high-throughput, and reproducible process can detect thousands of proteins at the single-cell resolution (13,14). Therefore, in September 2021, Nature published a technology feature article entitled ‘single-cell proteomics takes centre stage’ (10). It is anticipated that the new wave of single-cell proteomic technology will have far-reaching implications for biological and clinical research.
There are two primary technical approaches of single-cell proteomics, namely antibody-based approaches and mass spectrometry-based approaches. Antibody-based single-cell proteomic technologies, such as CyTOF and CITE-seq, can enable high-throughput detection of massive cells, but are limited in terms of the number and type of detected proteins (i.e. around 50–100 marker/surface proteins) due to the limitation of high-quality antibodies and labelling strategies (15–20). Mass spectrometry-based single-cell proteomic technologies, such as SCoPE2 and N2, offer complementary advantages, including the detection of a relatively large number of intracellular proteins and independence from antibody availability (14,21–26). Nevertheless, mass spectrometry-based single-cell proteomic technologies inherently suffer from low peptide coverage rates and protein abundance detection bias.
Although the diversity of these methods in the sample preparation, labelling strategy, sequencing technology, and target protein variety provides various aspects of characteristics for single-cell proteomics, the intricate format and fragmented processing procedures of the generated datasets impede the flexibility in re-analyzing such published datasets. In addition, locating relevant single-cell proteomic datasets to enable the downstream research can be challenging and cumbersome due to their dispersion across various platforms, such as ProteomeXchange (a submission portal primarily designed for storing raw mass spectrometry data) (27,28) and some self-host websites (websites that provide download links of the experimental data from wet laboratories such as Slavov Lab) (14). The currently available data repositories solely offer users with functions for data storage, submission and download, but lack the provision of user-friendly processed data in a unified format. This also hinders the systematic benchmarking of current data analysis tools and the development of powerful computational methods tailored for single-cell proteomic data analysis and interpretation.
Till now, there exist some R packages containing single-cell proteomic data, such as the representative package scpdata (29) and HDCytoData (30). The latest version of scpdata package contains 21 datasets generated by mass spectrometry-based single-cell proteomic technologies from 13 publications. However, it lacks an intuitive interface for visualising each dataset, despite this can be achieved by its companion package scp (29,31,32) within R environment. Furthermore, scpdata package only focuses on mass spectrometry-based single-cell proteomic datasets, without involving antibody-based single-cell proteomic datasets. On the contrast, the data package HDCytoData collected 2 flow cytometry datasets and 26 CyTOF datasets for benchmarking purposes, which have been formatted into Bioconductor object formats. However, the datasets contained in HDCytoData are limited in two technologies, mainly CyTOF and only seven publications, and HDCytoData package also has no intuitive visualization module. Additionally, there exists another database dedicated to bulk proteomic data analysis called ProteomicsDB (33,34). Users can search interested proteins on ProteomicsDB to explore the protein information and integrated expressions across tissues. However, for one independent experiment, ProteomicsDB only provides data information and links to raw data, which may pose inconvenience to data users.
In this study, we present SPDB, a comprehensive Single-cell Proteomic DataBase. To date, SPDB integrates 143 single-cell proteomic datasets from 12 antibody-based and mass spectrometry-based technologies, covering >300 million cells and over 8000 different proteins across four distinct species. All the datasets stored in SPDB have undergone processing via standardized pipelines to be assembled into a unified data format. The data exploration module of SPDB provides diverse visualization from the perspectives of cells or proteins, analysis results of datasets, and the comparison between protein levels. Furthermore, the protein exploration module of SPDB provides detailed information of proteins detected within at least one dataset, and enables users to explore corresponding protein expression within associated datasets directly. In summary, SPDB represents the largest-scale comprehensive database tailored for single-cell proteomic data and will lay a solid foundation for promoting the wide application of single-cell proteomics in the fields of cancer research and drug discovery.
Materials and methods
Data collection and organization
We searched previous studies from the NCBI PubMed and Google Scholar with single-cell proteomics related terms and then manually curated all the candidates to confirm the availability of publicly accessible single-cell proteomic data. In addition, we also searched for available single-cell multi-omics data (gene expression + surface protein expression) from PubMed and Google Scholar using the keywords ‘paired single-cell RNA and surface protein sequencing’. The filtered datasets were downloaded from Zenodo (https://zenodo.org/), Mendeley Data (https://data.mendeley.com/), GEO (https://www.ncbi.nlm.nih.gov/geo/) (35) and other associated data repositories, and the corresponding metadata of cells and proteins were retrieved from the original papers and their accompanying supplementary files. After undergoing standardized preprocessing, the corresponding data were assembled into encapsulated objects and then exported as rds files that can be loaded into the R environment to enable the direct access of preprocessed data. When searching and collecting available single-cell proteomic datasets, different levels of datasets properties, such as several broad classes (technology types or species) and narrow classes (diseases or tissues) were recorded, and datasets were organized classificatorily in a hierarchical tree structure based on their main properties for the convenience of filtration and location of interested datasets.
Preprocessing and analysis of antibody-based single-cell proteomic data
Briefly, for single-cell proteomic data generated by antibody-based technologies such as CyTOF, the original fcs files split by samples were imported into the R environment using the flowCore package (https://github.com/RGLab/flowCore) (36), and then data matrix and panel/sample metadata were assembled into an object of the SingleCellExperiment (SCE) class (37) and transformed with the inverse hyperbolic sine (arcsinh) function using the CATALYST package (https://github.com/HelenaLC/CATALYST) (38). To remove debris, doublets or dead cells, specific gating strategies were applied to different datasets following the corresponding instructions in the original papers by using the flowWorkspace package (https://github.com/RGLab/flowWorkspace) (39). Visualization of cells by UMAP dimensionality reduction was performed using the CATALYST package. The downstream clustering analysis of cells was conducted by jointly using the FlowSOM (https://github.com/SofieVG/FlowSOM) (setting xdim = 10, ydim = 10) (40) and ConsensusClusterPlus (https://bioconductor.org/packages/ConsensusClusterPlus/) (setting maxK = 20) (41) package, resulting in flexible clustering number floating from 2 to 20. The whole clustering results for each dataset were stored in the SCE object. Furthermore, on the visualization page displaying interactive plots of antibody-based single-cell proteomic data, to reduce the redundancy of cell metadata, only the medium clustering number 10 and the largest cluster number 20 are kept to visualize.
Preprocessing and analysis of single-cell multi-omics data
For the paired single-cell mRNA expression and surface protein expression data generated by single-cell multi-omics technologies such as CITE-seq and Abseq, the downloaded count matrices of RNA and proteins and cell metadata were imported into R environment. Following the multimodal analysis pipeline of Seurat v4 package (https://satijalab.org/seurat/) (42), the cell quality control according to both gene counts and surface protein counts, standard log-normalization for gene expression, and centered log-ratio (CLR) normalization (setting margin = 2) for surface protein expression were performed sequentially. For downstream analysis, PCA dimensionality reduction was applied to the RNA modality and protein modality respectively, then UMAP-based visualization of the multimodal data was performed with a weighted combination of RNA and protein similarities, while weighted SNN graph-based clustering of cells was performed by using the smart local moving (SLM) algorithm (setting resolution = 1) (43). Finally, to keep unified formats among datasets, the preprocessed data were converted into an object of the SCE class using Seurat function.
Preprocessing and analysis of mass spectrometry-based single-cell proteomic data
In terms of mass spectrometry-based single-cell proteomic data, the peptide-level reporter ion intensities (peptides * cells) resulting from such as MaxQuant (https://www.maxquant.org/) (44) or DIA-NN (https://github.com/vdemichev/DiaNN) (45) softwares were imported into the R environment to conduct subsequent data analysis using the scp framework (https://github.com/UCLouvain-CBIO/scp) (29,32). Following the procedure of scp, the columns (cells) then rows (peptides) of the peptide data were normalized through dividing the relative intensities by the median or mean relative intensities, respectively, and then the peptide matrices were log transformed. Peptides containing >99% of the missing data were removed. Next, peptide-level intensities were aggregated to protein-level intensities by mapping each peptide to its associated proteins and using the robustSummary (46,47) function. The protein data were normalized following the similar strategy with peptide normalization mentioned above. In addition, cells and proteins with more than 99% of the missing values were removed and the missing values in protein data were imputed using the K nearest neighbors (Knn) algorithm with k = 3. Because mass spectrometry-based single-cell proteomics captured the proteome of cells in different runs, batch effects caused by technical variation between runs were removed by the ComBat (48) function. Furthermore, for several mass spectrometry-based single-cell proteomics containing reference channels, such as SCoPE2 (49), the intensities measured for single-cells were normalized by the reference channel intensities in their respective sets to partially correct for between-run variation. Finally, the preprocessed protein data and cell metadata were assembled into an object of the SCE class, followed by visulization with UMAP dimensionality reduction and clustering analysis using the Louvain method (42).
Protein information retrieval
The summary information of proteins, including related genes, functions, sequences, etc., were extracted from the UniProt (https://www.uniprot.org/) (50) database. The antibody information and the correspondence between antibodies and proteins were retrieved from the original papers, UniProt database or several related websites such as abcam (https://www.abcam.com/) and cellsignal (https://www.cellsignal.com/). Then the unified protein names of various antibodies detected in all antibody-based single-cell proteomic data were assigned according to the aforementioned information. After that, for the statistic of protein number, we counted the number of nonredundant proteins detected in at least one dataset. Furthermore, for different clusters or cell types in each dataset, marker proteins with special expression patterns were identified by utilizing the ‘FindAllMarkers’ function from Seurat package (setting min.pct = 0.25, logfc.threshold = 0.25).
Database implementation
SPDB was built with popular web framework Flask (https://github.com/pallets/flask). For the backend of SPDB, we used Python to process all the data flow such as data retrieving. For the frontend webpage of SPDB, we used Jinja2 (https://github.com/pallets/jinja/) html template. The layout and style of most elements on the webpage were arranged with Bootstrap (https://getbootstrap.com/) library. Most of the data visualization functions were developed with Echarts (https://echarts.apache.org/) library. The interaction on the webpage was implemented with the original Javascript (https://www.javascript.com/) and Jquery (https://jquery.com/) library. Nginx (https://www.nginx.com/) was employed as the server to run our web application. The data information or visual information needed for the front-end calls are stored in csv files and parsed by the Flask server. All the data processing flow is completed with the Pandas (51) python package in the server end. Pandas is one of the most powerful python packages built for data analysis and data process. It consists of massive convenient functions and tools used for data retrieving, data format conversion, etc. More detailed introduction to Pandas can be found in https://pandas.pydata.org/. To better comply with and ensure smooth use of the SPDB infrastructure, we advise the following web browsers: Google Chrome, Firefox or Microsoft Edge. In addition, in order to expedite the rendering phase of interactive plots and optimize user experience, we randomly downsampled large-scale data to 10 000 cells.
Results
Overview of SPDB
SPDB is the largest-scale comprehensive database designed for collection, analysis and visualization of diverse single-cell proteomic data, offering researchers a powerful tool to investigate proteomics from the single-cell perspective. In total, SPDB curated 143 single-cell proteomic datasets generated by 6 antibody-based technologies (CyTOF (15), CyTOF-Lec (16), CITE-seq (17), ECCITE-seq (18), Perturb-CITE-seq (19), Abseq (20)) and 6 mass spectrometry-based technologies (T-SCP (22), PlexDIA (23), SCoPE2 (14,24,49), pSCoPE (26), N2 (25), nanoPOTS (21)), including >300 million cells sampled from four different species (i.e. human, mouse, macaque and pig) and 30 tissues (Supplementary Table S1). Over 8000 proteins have been detected in at least one dataset, including over 800 surface proteins and around 7000 intracellular proteins. Notably, there are 90 datasets with respect to 42 distinct disease types, such as COVID-19 (52), HIV (53) and breast cancer (54), which will be conducive for facilitating disease research and drug discovery from the perspective of single-cell proteomics. In addition, these datasets were collected and downloaded from nine different platforms, such as GEO, Zenodo, Mendeley Data, ImmPort (55), FigShare, etc. As a user-friendly web server, SPDB provides a comprehensive range of functionalities including single-cell proteomic data deployment, dataset search and exploration module, protein search and exploration module, data statistic module, as well as a detailed user manual page.
User-friendly data search module
To facilitate users to conveniently access datasets of interest, SPDB offers three data inquiry options: (i) several quick search buttons categorized by species or technology types are arranged on the Home page of SPDB, enabling users to conveniently filter datasets according to their specific interests in terms of species or technologies; (ii) all datasets stored in SPDB have been cataloged on the Data page and entitled with titles corresponding to the original papers, enabling users to browse datasets globally; (iii) eight components, namely publishing time, sample species, tissues, diseases, technologies and technology type, and the number of cells/proteins, are available on the Data page, offering users various options to filter datasets by specifying one or more criteria (Figure 1A).
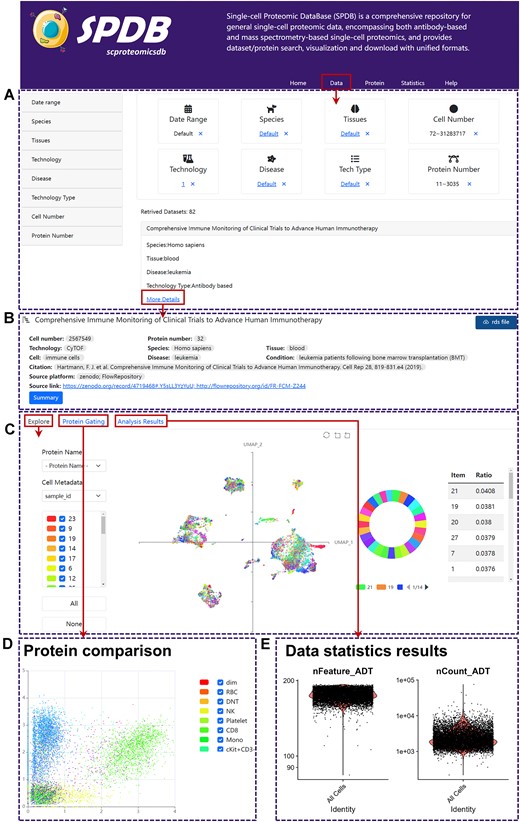
Demonstration of data search and exploration in SPDB. (A) The browse interface and filter components of all collected datasets in SPDB. (B) The data information panel of SPDB. (C) The UMAP visualization panel of SPDB. (D) The protein comparison panel of SPDB. (E) The analysis result panel of SPDB.
Comprehensive data exploration module
SPDB offers researchers with the convenience to comprehensively explore the advanced single-cell proteomic datasets from diverse perspectives. After applying the data filter, users can select one dataset of interest and proceed to the secondary page of the module by clicking the corresponding ‘More Details’ button. From there, users can efficiently explore this dataset from different perspectives (i.e. key information, data visualization, protein comparison). Meanwhile, the processed data in a unified format can be downloaded by clicking the ‘rds file’ button.
Key information of data
Users can visually check various key information of the dataset, encompassing cell number, protein number, sample species, tissue types, major cell types, sample condition or disease, as well as the original download platform and link (Figure 1B). Moreover, by clicking on the ‘Summary’ button, users can access a concise overview of the dataset extracted from the primary research paper.
Data visualization
After accessing the subpanel through the ‘Explore’ option, an interactive UMAP plot of the dataset will be displayed, where each dot presents a cell (Figure 1C). Users have the flexible options to select different levels of cell metadata, such as clustering ID or cell type, or choose proteins of interest to assign discrete or continuous colors to cells, respectively. Meanwhile, the UMAP plot will be accompanied by the corresponding distribution plot of selected cell properties or proteins, providing users with statistical information regarding cell metadata or protein expression. In addition, for some special cell metadata, such as clustering ID and cell type, the tables of marker information will accompany with the UMAP plots.
Protein comparison
By selecting the ‘Protein Gating’ subpanel, users can compare the expression levels of any two available proteins through an interactive scatter plot (Figure 1D). The protein names to mark the x-axis/y-axis of scatter plot and the cell property for dot coloration need to be selected from their respective pick lists, with the scatter plot updating upon clicking the ‘Observe’ button.
Global analysis of data
To facilitate global exploration of the dataset, the analysis results of the dataset, such as heatmap plots depicting protein average expression across samples or clustering ID and boxplots illustrating proteins ranked by non-redundancy scores or average expression levels across samples or clustering ID, can be browsed by choosing the ‘Analysis Results’ subpanel (Figure 1E).
Protein search and exploration module
Except for the dataset search functionality, SPDB also provides the protein search function within the ‘Protein’ panel. There are three ways to search interested proteins. Users can enter the protein name/accession number from UniProt/corresponding official gene symbol of one protein and then click the ‘Show Candidates’ button to retrieve proteins of interest (Figure 2A–C), for which the relevant datasets are available in SPDB. Then, users can click the entry name of proteins to access the secondary page of this module, where they can navigate to the ‘Protein Summary’ tab and retrieve the summary information of proteins such as protein name, families, related gene names, proteomes length and sequence, function, and other key details (Figure 2D). Furthermore, users also can navigate to the ‘Datasets’ tab to access information on datasets detecting the corresponding proteins (Figure 2E). For an interested dataset, a new window will appear to directly visualize the expression level of the queried protein in the UMAP plot after clicking the ‘Scan Expression’ button. Furthermore, by clicking the ‘More Details’ button, users will be redirected to the data exploration page where they can explore the dataset in detail.
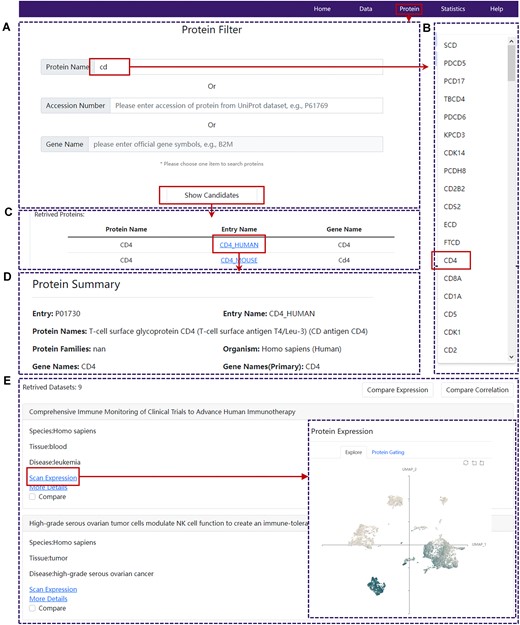
Demonstration of protein search and exploration in SPDB. (A) The protein search page of SPDB. (B) An example of available protein list resulting from fuzzy search. (C) The table of protein candidates detected in at least one dataset. (D) The protein summary panel of SPDB. (E) The browse interface of the related datasets and new pop-up window for one selected dataset.
Data comparison module
After conducting a search for a specific protein of interest on the ‘Protein’ page, users will be able to select two relevant datasets from the ‘Datasets’ tab and execute data comparison functions to investigate the protein expression patterns under different conditions (Figure 3A). By clicking the ‘Compare Expression’ button, a new window will be displayed, presenting two UMAP plots illustrating the expression of the specific protein in distinct conditions (Figure 3B). Moreover, upon selecting the ‘Compare Correlation’ button, users will be redirected to a dedicated webpage that facilitates the comparative analysis of protein correlation patterns across two distinct conditions (Figure 3C).
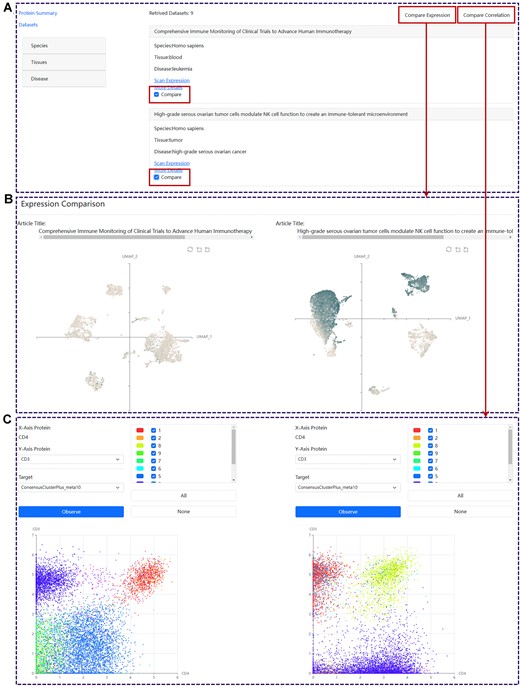
Demonstration of data comparison in SPDB. (A) The browse interface of the related datasets. (B) The comparison of protein expressions under two selected datasets. (C) The comparison of protein correlation patterns under two selected datasets.
Discussion
We present SPDB, a web-based public resource that integrates abundant single-cell proteomic datasets and interactive exploration modules for both datasets and proteins. To the best of our knowledge, SPDB represents the largest-scale single-cell proteomic database and provides access to the largest collection of up-to-date datasets. Overall, SPDB exhibits several innovative features: (i) the current version of SPDB meticulously curates hundreds of single-cell proteomic datasets generated using state-of-the-art or widely used technologies. These datasets are organized in a hierarchical tree structure that takes into account their unique properties, thereby enabling users to efficiently locate and access specific datasets of interest; (ii) SPDB preprocessed single-cell proteomic datasets by following the standardized workflows and stored data in unified data formats along with essential metadata, saving users’ time for data collection and streamlining their downstream analysis; (iii) SPDB offers a comprehensive data exploration module that enables the visualization of datasets through interactive or static plots, providing an intuitive and informative representation of complex information; (iv) SPDB also provides a protein search module, enabling researchers to access concise protein information and locate the datasets with interested proteins detected; (v) additionally, SPDB integrates data comparison module enabling users to explore different expression patterns of interested proteins across datasets, thereby offering valuable insights for researchers.
In summary, we envision that the data resources and features of SPDB will greatly benefit the single-cell proteomics community and foster interest among researchers from diverse backgrounds to advance single-cell proteomics by either developing computational tools or discovering novel biological mechanisms from the proteomic perspective. In the future, by leveraging the extensive collection of single-cell proteomic data stored in SPDB, we aim to develop specialized computational tools, such as cell type annotation, data integration, and drop-out imputation methods, tailored for single-cell proteomics, and integrate newly developed tools into the SPDB platform. Furthermore, we will endeavor to acquire relative gene expression data for proteins in analogous tissues or cellular conditions, enabling users to conduct comparative analysis of protein and gene expression at the single-cell level. Additionally, in response to the rapid advancements and increasing prominence of single-cell proteomics, we will continually maintain and update SPDB by incorporating new related studies and technologies, whilst enhancing its functionality and tool integration.
Data availability
SPDB is freely accessible to users with no registration needed at https://scproteomicsdb.com/.
Supplementary data
Supplementary Data are available at NAR Online.
Acknowledgements
We would like to thank a number of users for reporting bugs and providing constructive feedback. We would also like to thank the researchers for publishing and sharing their data. We thank all the lab members who provided advice on this study.
Funding
National Natural Science Foundation of China [62225109, 62072095]; Fundamental Research Funds for the Central Universities [HIT.BRET.2022003]; National Key R&D Program of China [2022YFF1202101]. Funding for open access charge: National Natural Science Foundation of China.
Conflict of interest statement. None declared.
References
Author notes
The authors wish it to be known that, in their opinion, the first two authors should be regarded as Joint First Authors.

Comments