


Abstract
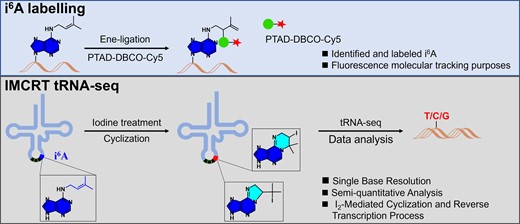
Chemical modifications in RNAs play crucial roles in diversifying their structures and regulating numerous biochemical processes. Since the 1990s, several hydrophobic prenyl-modifications have been discovered in various RNAs. Prenyl groups serve as precursors for terpenes and many other biological molecules. The processes of prenylation in different macromolecules have been extensively studied. We introduce here a novel chemical biology toolkit that not only labels i6A, a prenyl-modified RNA residue, by leveraging the unique reactivity of the prenyl group, but also provides a general strategy to incorporate fluorescence functionalities into RNAs for molecular tracking purposes. Our findings revealed that iodine-mediated cyclization reactions of the prenyl group occur rapidly, transforming i6A from a hydrogen-bond acceptor to a donor. Based on this reactivity, we developed an Iodine-Mediated Cyclization and Reverse Transcription (IMCRT) tRNA-seq method, which can profile all nine endogenous tRNAs containing i6A residues in Saccharomyces cerevisiae with single-base resolution. Furthermore, under stress conditions, we observed a decline in i6A levels in budding yeast, accompanied by significant decrease of mutation rate at A37 position. Thus, the IMCRT tRNA-seq method not only permits semi-quantification of i6A levels in tRNAs but also holds potential for transcriptome-wide detection and analysis of various RNA species containing i6A modifications.
Introduction
RNAs are highly versatile biological macromolecules with a diverse range of cellular functions associated with gene expression, catalysis, environmental stress responses and many human diseases (1). Endeavors in the field of RNA research have led to the discovery of many new types of RNAs and revealed their additional functions and potential therapeutic applications (2), including modulating signaling pathways by circular RNAs (3), RNA epitranscriptomics (4), and RNA nanobiology (5), etc. Advances in technology and the desire to elucidate the high complexity of RNA biology have accelerated the demands for constructing new molecular tools to further understand RNA structures and functions in cellular context (6,7).
In RNA epitranscriptome, >170 naturally occurring chemical modifications have been identified to decorate and diversify various RNAs (8). Among those chemical decorations, the hydrophobic prenyl groups (mainly in i6A analogs introduced by the Mia family enzyme, Figure 1A and B) have been discovered in tRNAs in the early 1990s (9–11). These modifications are usually found in the position 37 of anticodon stem loops with great biological significance in enhancing base pairing specificity, codon recognition fidelity and translational efficiency (12–14). It was recently demonstrated that the prenyl modification of tRNA affects plant root growth (11). In addition, they have been actively involved in a variety of human diseases such as mitochondrial respiratory chain defects, Alzheimer's disease, breast cancer and diabetes (15). Liu and coworkers reported the identity of geranyl modification in bacterial tRNA, as a polyprenyl group, specifically on 2-thiouridine (16–19). This geranyl group has been shown to play crucial roles in base pairing discrimination, preventing frameshifting error, and maintaining translational efficiency and fidelity. The prenyl groups including terpenes compounds have also been known as the fundamental feedstock in a wide range of biological processes that play key roles in metabolism and human diseases. Although tremendous progress about the synthesis and detection of i6A modifications have been made, (20–25) further elucidating the biological significance of these prenyl-modified RNAs remains very challenging due to the lack of genome wide detection and sequencing tools (11). Very recently, the transcriptome-wide mapping of 2-methylthio-i6A (ms2i6A), a common i6A analog, has been achieved through chemoselective bioconjugation of the methylthio group (26). However, there is still a need for more general approaches targeting the prenyl-group to better profile these modifications.
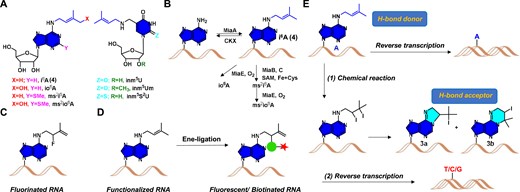
Overview of prenylated RNA residues as well as the labeling and profiling strategy described in this work. (A) Structures of prenylated nucleosides. (B) Plausible biogenetic pathways for prenylated RNAs. (C) Fluorination of i6A-incorporated RNA. (D) Labeling and enrichment methods proposed in this work. (E) Iodine-Mediated Cyclization and Reverse Transcription (IMCRT) method to profile i6A residues in cell.
Antigen-antibody specificity is one of the main methodologies to identify and profile RNA modifications (27). In addition, chemical pulldown methods have been extensively utilized in recent years to study modified residues in RNAs such as hm5C (28,29), f5C (30) and pseudouridine (31), etc. In contrast to using antibodies to recognize specific epitope of antigen, chemical pulldown strategies target defined functionalities on RNAs and employ highly selective chemical probes to tag the RNAs containing these modifications within the complex cell environment. We have previously developed an Ene-ligation strategy to investigate the chemical properties of the prenyl group under biologically mild conditions (32,33). This chemical biology method has great potential in decoding the importance of prenylated RNA residues with the emphasis on the distribution of these modifications in both healthy and diseased cells. This method can also be expanded in investigating the transcriptomic-wide profiling of these lipid-like modifications. Herein, we report a mild 2,3-rearrangement Ene-ligation based strategy (Figure 1C and D) for the fluorescence labeling and detection of prenyl modified RNAs via a σ-rearrangement mechanism (34–37). We also investigated the chemical transformation of the prenyl group in reacting with iodine and utilized this iodine-mediated cyclization and reverse transcription (IMCRT) approach to profile the i6A residues in cellular RNAs with a single-base resolution (Figure 1E).
Materials and methods
General information
All chemicals were purchased from Sigma-Aldrich, Acros, Inno-chem, Macklin Inc, Energy Chemical and were used without further purification. Extra dry solvents, such as 1,4-dioxane, DMF, and THF, were obtained from Inno-chem in sealed bottles over 3 or 4 Å molecular sieves and stored under dried nitrogen. Organic solvents were obtained from Sinopharm Chemical Reagent Co., Ltd (Shanghai, China) and used in reactions, column chromatography and recrystallizations. Milli-Q ultrapure water (resistivity, 18 mΩ) purified through Millipore Milli-Q Advantage A1 purification system was used for all bioconjugation reactions. The reactions were monitored by thin-layer chromatography (TLC) analysis using silica gel (60-Å pore size, F254, Yantai Chemical Industry Research Institute) plates. Compounds were visualized by UV irradiation (λ = 254 nm) and/or spraying TLC stain such as a KMnO4 solution followed by electronic heating. Flash chromatography columns were performed on silica gel (60-Å pore size, 230−400 mesh). HPLC purification were performed using EasyChrom-1000 system with NU3000 serials UV/Vis. detector (Hanbon Sci. & Tech., Jiangsu, China) using an Ultimate® XB-C18 column, 21.2 × 250 mm 5 micron (Welch Materials Inc., Shanghai, China). Separation was achieved by gradient elution from 5% to 70% acetonitrile in water (constant 0.1% formic acid) over 20 min, isocratic elution with 70% acetonitrile from 20 to 25 min, and returned to initial conditions and equilibrated for 5 min. The LC chromatograms were recorded by monitoring absorption at 254 and 220 nm. 1H and 13C NMR spectra were recorded at room temperature on a Bruker spectrometer (AM-600 or AM-400) operating at 600/400 and 150/100 MHz, respectively. Chemical shifts are given in parts per million, and 1H and 13C NMR spectra were referenced using the solvent signal as an internal standard. The following abbreviations are used for the proton spectra multiplicities: s: singlet, d: doublet, t: triplet, m: multiplet, br: broad. Coupling constants (J) are reported in Hertz (Hz). HRMS (TOF) were obtained from the Bruker Micro TOF II Spectrometer using Electro Spray Ionization (ESI). Advion MS (ESI) were obtained from the Expression L (Beijing Bohui Innovation Biotechnology Co., Ltd). LC–MS analysis was obtained from the Bruker Orbitrap LC/MS (Q Exactive™) at Huazhong University of Science and Technology Analytical and Testing Center. UV–visible absorbance measurements were performed with or using UV–visible spectrometer (Lambda365, PerkinElmer, German). Confocal Imaging was performed using a LSM 780 confocal microscope (Zeiss) with a 20× objective at 16-bit depth under non-saturating conditions. EGFP were imaged with a 480 nm (excitation) and a 510 nm (emission) and false-colored green.
Materials
Streptococcus pyogenes (product # M0646), T7 Endonuclease I (product # M0302), Ribonucleotide solution mix (NTPs) and deoxy-ribonucleoside triphosphates (dNTPs) were purchased from New England Biolabs (USA). Transcript Aid T7 High Yield Transcription kit (product # K0441) and Glycogen (product # R0561) were purchased from Thermo Fisher Scientific. Pyrobest™ DNA Polymerase and PrimeSTAR HS DNA Polymerase were purchased from TaKaRa Shuzo Co. Ltd. (Tokyo, Japan). DNA Clean & Concentrator™-5 kit (product # D4014) was purchased from Zymo Research Corp. The DNeasy Blood & Tissue Kit was purchased from QIAGEN. The oligonucleotides at HPLC purity were obtained from TaKaRa company (Dalian, China). The nucleic acid stains Super GelRed (NO.: S-2001) was bought from US Everbright Inc. (Suzhou, China). Thiazolyl Blue Tetrazolium Bromide (MTT, CAS # 298-93-1) were purchased from Sigma-Aldrich Inc. (Shanghai, China). DPBS (CAS # 63995-75-5) was purchased from TCI (Shanghai) Development Co., Ltd.
Polymerase chain reaction protocol
The concentration of DNA or RNA was quantified by NanoDrop 2000c (Thermo Scientific, USA). Polymerase Chain Reaction was conducted using a A300 Fast Gradient Thermal Cycler (Long Gene Scientific Instruments, Hangzhou, China). Briefly, each reaction was performed under conditions of initial denaturation at 94°C for 3 min, followed by 30 cycles of denaturation (94°C for 30 s), annealing (63°C for 30 s) and extension (72°C for 60 s) and a final extension at 72°C for 10 min.
Electrophoresis protocol
Agarose were purchased from Biofroxx (German). 50× Tris-Acetate EDTA (TAE) buffer (40 mM Tris-acetate and 1 mM EDTA, pH 8.0) were purchased from Biosharp (China). 8 μl of each amplification product was separated by gel electrophoresis on 1% agarose. The electrophoresis conditions were as follows: power supply (DYY-6C power supply, Liuyi Biotechnology) was set to 130 V. 1% agarose gels were run at room temperature (25°C) for 20 min and stained with or without GoodView™ (SBS Genentech, Beijing, China). A DNA size marker (1 kb DNA Ladder, TsingKe Biotech, TSJ102, Beijing, China) was used. Gels were analyzed by in-gel fluorescence measurements on a FluorChem® FC3 imager (Alpha Innotech). Fluorescence was measured with a blue light excitation wavelength (475 nm) and a green filter emission (537 nm) and/or a red-light excitation wavelength (632 nm) and a far-red filter emission (710 nm).
Functional probes synthesis
The green fluorescent probe PTAD-DBCO-FITC (8)
A solution of compound PTAD-N3 (10.1 mg, 0.04 mmol) and DBCO-FITC (5.0 mg, 0.01 mmol) in dry N,N-dimethylformamide (DMF, 1.0 ml) under nitrogen was stirred at room temperature overnight. The reaction mixture was purified by RP-HPLC (Separation was achieved using an Ultimate XB-C18 column, 21.2 × 250 mm 5 micron (Welch Materials Inc., Shanghai, China) by gradient elution from 5% to 70% MeCN in water (constant 0.1% formic acid) over 20 min, isocratic elution with 70% MeCN from 20 to 30 min, and returned to initial conditions and equilibrated for 5 min) to give compound PTAD-DBCO-FITC precursor (6.0 mg, 0.006 mmol, 66%, retention time 22 min) as yellow solid. 1H NMR (400 MHz, methanol-d4) δ 8.23 (s, 1H), 7.99 (d, J = 8.0 Hz, 1H), 7.54 (d, J = 8.0 Hz, 2H), 7.45 (s, 2H), 7.29 (d, J = 4.0 Hz, 1H), 7.25–7.23 (m, 3H), 7.29 (t, J = 8.0 Hz, 2H), 7.15 (d, J = 8.0 Hz, 1H), 6.95 (d, J = 8.0 Hz, 1H), 6.86 (d, J = 8.0 Hz, 1H), 6.60 (s, 2H), 6.51 (q, J = 12.0 Hz, 2H), 6.46–6.42 (m, 2H), 5.94 (d, J = 20.0 Hz, 1H), 4.42 (t, J = 16.0 Hz, 1H), 4.36 (t, J = 8.0 Hz, 1H), 3.40–3.30 (m, 2H), 2.24–2.08 (m, 2H), 1.96–1.74 (m, 2H). HRMS (TOF) Calculated for [M + Na]+ = 919.2452, found = 919.2436. The in situ oxidation of the PTAD-DBCO-FITC precursor in N,N-dimethylformamide (DMF) using an equal equivalent of N-bromosuccinimide (NBS) yielded PTAD-DBCO-FITC (8, 10 mM in DMF, stored at -20°C). This product was utilized directly without further purification.
The red fluorescent probe PTAD-DBCO-Cy5 (10)
A solution of compound PTAD-N3 (3.4 mg, 0.0128 mmol) and DBCO-Cy5 (5.0 mg, 0.0064 mmol) in dry CH3CN (1.0 ml) under nitrogen was stirred at room temperature overnight. The reaction mixture was purified by RP-HPLC (Separation was achieved using a Ultimate XB-C18 column, 21.2 × 250 mm 5 micron (Welch Materials Inc., Shanghai, China) by gradient elution from 5% to 70% MeCN in water (constant 0.1% formic acid) over 15 min, isocratic elution with 70% MeCN from 15 to 30 min, and returned to initial conditions and equilibrated for 5 min) to give PTAD-DBCO-Cy5 precursor (6.0 mg, 0.0057 mmol, 90%, retention time 24 min) as blue solid, which was re-dissolved in 0.3 ml of anhydrous N,N-dimethylformamide (DMF) and subsequently treated with an equal equivalent of N-bromosuccinimide (NBS) solution (20 mM in DMF) to formulate a PTAD-DBCO-Cy5 stock solution (10, 10 mM in DMF, stored at -20°C). MS (ESI) Calculated for [M-H]− = 1035.5, found [M-H]− = 1034.7. HRMS (TOF) Calculated for [M-Cl]+ = 1003.4977, found 1003.4964.
Nucleotide i6A triphosphate synthesis
Nucleoside i6A (35 mg, 0.1 mmol) and proton sponge (58 mg, 0.25 mmol) were dissolved in trimethyl phosphate (0.7 ml) and was placed under the ice-water bath. phosphorus oxychloride (33.6 μl, 0.36 mmol) was slowly added and stirred at 0°C for 12 h. A solution of tributylamine (175 μl, 0.72 mmol) and tributyl ammonium pyrophosphate (642 mg) in DMF (2.0 ml) was slowly added and the reaction mixture was stirred at 0°C for 30 min. The reaction was quenched by addition of 1.0 M aqueous TEAB (pH = 7.5, 15 ml). The mixture was diluted with H2O (5.0 ml) and subjected to HPLC purification. Separation was achieved using an Ultimate XB-C18 column, 21.2 × 250 mm 5 micron by gradient elution from 5% to 50% MeCN in water (constant 0.1% formic acid) over 25 min, isocratic elution with 50% MeCN from 25 to 30 min, and returned to initial conditions and equilibrated for 5 min to give i6ATP (10.0 mg, as tributyl ammonium salt, retention time 20 min). 1H NMR (400 MHz, methanol-d4) δ 8.40 (s, 2H), 8.30 (s, 1H), 6.13 (d, J = 4.0 Hz, 1H), 5.40 (t, J = 12.0 Hz, 2H), 4.73 (q, J = 16.0 Hz, 1H), 4.57–4.43 (m, 1H), 4.27–4.26 (m, 2H), 4.20–4.13 (m, 2H). The proton peak of methyl group in prenylated functionality was covered by tributyl ammonium salt in 1H NMR. 31P NMR (162 MHz, methanol-d4) δ -10.47 (d, J = 22.68 Hz, α-P), -11.46 (d, J = 22.68 Hz, γ-P), –24.00 (t, J = 43.74 Hz, β-P). MS (ESI) Calculated for [M-H] − = 574.1, found [M-H] − = 574.2.
Profiling the dynamic of the Ene-ligation between i6A nucleoside and PTAD
The nucleoside i6A (10 mg, 0.03 mmol) was dissolved in a mixture of CD3CN and D2O (0.5 ml, volume-to-volume ratio of 4:1, resulting in a final concentration of 60 mM). Subsequently, 4-phenyl-3H-1,2,4-triazole-3,5(4H)-dione (PTAD, 26 mg, 0.15 mmol, equivalent to 5 times the amount of i6A) was added to the solution (resulting in a final concentration of 300 mM). The reaction mixture was then allowed to stand at room temperature. The 1H NMR spectra were obtained using a 400 MHz 1H NMR instrument with CD3CN/D2O as the solvent.
Fluorescence labeling of i6A in the metabolites of eukaryotic cells
The HeLa cells are first cultured in a six-well plate until they reach a confluence of 70%-80%. Different concentrations of i6A (4) are then added to the DMEM medium, consisting of 100, 200 and 400 μM of i6A. After a 12-h incubation period, all cells are collected, and total RNA is extracted from them.
RNA incorporating i6A was labeled using fluorescein PTAD-DBCO-FITC (8)
In a 1.5 ml Eppendorf tube containing the PTAD-DBCO-FITC precursor (7, 10 ml of a 10 mM solution in DMF), N-bromosuccinimide (1.0 ml of a 100 mM solution in DMF) was added. The mixture was gently vortexed, and the formation of a light-red color was observed. The reagent was kept on ice and immediately used for labeling the i6A-incorporated RNA.
The i6A-incorporated total RNA (10 ml, 20 ng/ml in DEPC water) was incubated with PTAD-DBCO-FITC (8, 10 ml of a 0.1 mM solution), shaken for 30 min at 0°C. The RNA was then analyzed through gel electrophoresis on a 1% agarose gel. The electrophoresis conditions were as follows: power supply (DYY-6C power supply, Liuyi Biotechnology) was set to 130 V. 1% agarose gels were run at room temperature (25°C) for 20 min and stained with or without GoodView™ (SBS Genentech, Beijing, China). A DNA size marker (1 kb DNA Ladder, TsingKe Biotech, TSJ102, Beijing, China) was used. Gels were analyzed by in-gel fluorescence measurements on a FluorChem® FC3 imager (Alpha Innotech). Fluorescence was measured with a blue light excitation wavelength (475 nm) and a green filter emission (537 nm).
RNA containing i6A was labeled using fluorescein PTAD-DBCO-Cy5 (10)
In a 1.5 ml Eppendorf tube, the PTAD-DBCO-Cy5 precursor (9, 10 ml of a 10 mM solution in DMF) was mixed with N-bromosuccinimide (1.0 ml of a 100 mM solution in DMF). The mixture was gently vortexed, and the formation of a light-red color was observed, indicating successful reaction. The prepared reagent was then kept on ice and used immediately for labeling the i6A-incorporated RNA. The i6A-containing total RNA (10 ml, 20 ng/ml in DEPC water) was incubated with the activated PTAD-DBCO-Cy5 (10, 10 ml of a 0.1 mM solution), and the mixture was shaken for 30 min at 0°C to facilitate labeling. Following this incubation, the labeled RNA was analyzed through gel electrophoresis on a 1% agarose gel. The electrophoresis conditions were as follows: power supply (DYY-6C power supply, Liuyi Biotechnology) was set to 130 V. 1% agarose gels were run at room temperature (25°C) for 20 min and stained with or without GoodView™ (SBS Genentech, Beijing, China). A DNA size marker (1 kb DNA Ladder, TsingKe Biotech, TSJ102, Beijing, China) was used. Gels were analyzed by in-gel fluorescence measurements on a FluorChem® FC3 imager (Alpha Innotech). Fluorescence was measured with a blue light excitation wavelength (475 nm) and a green filter emission (537 nm).
The cyclization of nucleoside i6A mediated by iodine
The reactions were conducted in DMSO-d6 to enable in situ NMR characterization without the need for additional purification. i6A (4, 0.15 mmol) was dissolved in DMSO-d6 (0.5 ml), and iodine (0.45 mmol in DMSO-d6) was subsequently added to the solution. The mixture was then stirred at 37°C for 5 min. After this incubation period, the reaction mixture was subjected to 1H NMR, 13C NMR, HPLC, UV and LC–MS analysis.
Prediction of the plausible reaction pathway for iodine-mediated cyclization of nucleoside i6A
All calculations were conducted using the Gaussian 16, Revision B.01 software program. The geometry optimization of the model systems in the gas phase was performed utilizing the B3LYP/BS1 Density Functional Theory (DFT) method, which was augmented with the D3(BJ) version of Grimme's empirical dispersion correction. In this context, BS1 refers to a basis set that combines the SDD for iodine atoms and the 6–31G (d, p) for all other atoms. Frequency calculations were carried out at the same theoretical level to ascertain whether the optimized structures represent minima (absence of imaginary frequencies) or saddle points (presence of a single imaginary frequency) on the potential energy surface. These calculations also provided thermal corrections to the Gibbs free energies. The solvation energy corrections were computed at the B3LYP/BS1 level employing the SMD solvation model for DMSO, based on the gas-phase optimized geometries. Single point energies were calculated using the M062X/BS2 method, which was also augmented with the D3 version of Grimme's empirical dispersion correction. In this case, BS2 denotes a basis set combining the SDD for iodine atoms and the Def2TZVP for all other atoms.
In vitro detection of the efficiency of i6ATP in the T7 RNA polymerase transcription system
The EGFP mRNA sequence was obtained by transcribing under the conditions of i6ATP: ATP ratio of 0: 1, 3: 7, 7: 3, 1: 0 through the in vitro transcription system, and then detected each group of EGFP RNA sequence through iodine (0.5 M) treatment. After processing, the cDNA sequence of EGFP in each group was obtained by reverse transcription. Next, the obtained cDNA sequence was used as a template, and the mutant EGFP gene sequence in each group was obtained by PCR amplification, and cloned into the T vector. Through the amplification of DH5α E. coli., 50 clones were picked from each group and sequenced to detect the mutation. After the mutation site of EGFP gene, and analyze the insertion efficiency of i6ATP.
Comparative analysis of the recognition efficiency of T7 RNA polymerase and RNA polymerase II for i6ATP in eukaryotic cells
T7 RNA polymerase and T7-IRES2-EGFP expression system were expressed in HeLa cells, and RNA was extracted 48 h after transfection, and then the mixture was treated with iodine to cause i6ATP insertion site mutation. Then, the mutant sequences of the two endogenously expressed genes of GAPDH and Notch1 were obtained by reverse transcription, and the mutant gene sequence of EGFP catalyzed by T7 RNA polymerase transcription was obtained. Same as the previous detection process, by detecting the insertion efficiency of i6ATP in the endogenous highly expressed gene GAPDH and the oncogene Notch1 and the insertion efficiency of i6ATP in T7-EGFP. Compare the recognition efficiency of i6ATP by eukaryotic RNA polymerase and the feasibility of using it as a real-time transcriptome marker.
Yeast cell culture and tRNA isolation
The wild-type and MOD5 deletion strains of Saccharomyces cerevisiae were kindly provided by Dr. Jia-Xing Yue from Sun Yat-sen University Cancer Center. The S. cerevisiae cells were cultured in yeast extract–peptone–dextrose (YPD) medium at 30°C until reaching the logarithmic growth phase. For H2O2 treatment, the cells were exposed to 12 mM H2O2 for 1 h before harvesting, as reported previously (38).
Cells were pelleted by centrifugation, and grinded into fine powders using a mortar and and pestle, with the addition of liquid nitrogen. Total RNA was extracted using Trizol (Invitrogen, RN0401) following the manufacturer's instructions. RNAs shorter than 200 nucleotides, primarily consisting of tRNAs, were isolated using the Small RNA clean kit (ZYMO research).
Measurement of i6A levels by mass spectrometry
To determine the levels of i6A in tRNAs, liquid chromatography–tandem mass spectrometry (LC–MS/MS) was performed by Wuhan BioBank in Wuhan, China. Synthesized i6A was used as a standard for this analysis.
IMCRT tRNA-seq library construction
Initially, 10 μg of tRNAs were treated with 0.1 M Tris–HCl (pH 9.0) at 37°C for 45 min to deacylate the tRNAs. Half of the deacylated tRNAs were treated with 0.5 M I2 for 15 min on ice. Following this, saturated Na2S2O3 was added until the solution became colorless, and saturated Na2CO3 was added until it ceased to produce bubbles. Once the reaction was complete, the tRNAs were purified using the RNA Clean & Concentrator Kit (ZYMO Research). Subsequently, both iodine-treated and untreated tRNAs were used for sequencing library construction, following a previously established protocol with some modifications (39). Notably, Induro™ Reverse Transcriptase (NEB, #M0681L) was used instead of TGIRT. The process began with the incubation of deacylated tRNAs with T4 PNK to dephosphorylate their 3′ ends. tRNAs from both samples were then purified using PAGE, followed by the ligation of a 3′ adaptor to the purified tRNAs using T4 RNA Ligase 2, truncated KQ (NEB, M0373L), at 25°C for 3 h. After another round of PAGE purification, the ligated products were reverse transcribed using Induro® Reverse Transcriptase (NEB, M0681L) at 55°C for 16 h in 1x RT buffer (10 mM MgCl2, 10 mM DTT and 75 mM KCl). The resulting cDNA was then purified and circularized using Circligase™-II (Lucigen, #CL9025K). Finally, the libraries were amplified using KAPA HiFi Polymerase (Roche, #KK2602) and sequenced on an Illumina Novaseq 6000 platform. The primer sequences are listed in Supplementary Table S5.
tRNA-seq data analysis
Adaptors and random sequences were trimmed, and low-quality sequences were discarded using Cutadapt software (40,41). The resulting clean reads were then processed using a previously published pipeline to quantify and analyze tRNA expression and modifications (39). The mature tRNA sequences of S. cerevisiae were obtained from GtRNAdb. The analysis was performed using the following parameters:
–cluster –cluster-id 0.90 –min-cov 2000 –max-mismatches 0.1 –remap –remap-mismatches 0.075 –control-condition control
To ensure the quality of our tRNA-seq data, we thoroughly examined several key parameters. These included mapping rate, correlation of samples, coverage of tRNAs, and detection of known tRNA modifications.
To identify the i6A site in tRNAs, the mutation rate with and without I2 treatment was calculated to determine the i6A score. The i6A score is defined as relative possibility of i6A modification at a specific site. A larger mutation rate difference corresponds to a higher score. An i6A score threshold of 1 was set, with scores greater than 1 indicating the presence of i6A modification at the respective site. The score is calculated as follows:
Mt represents the mutation rate with I2 treatment, and Mc is the mutation rate without I2 treatment. To ensure efficient calculation of the i6A score, Laplace smoothing is incorporated. All customized scripts used in this study are available from the corresponding author upon request.
Quantification and statistical analysis
Two-tailed t-tests or Wilcoxon's signed-rank tests were employed for group comparisons. Correlation analyses were conducted using Pearson tests. A P-value of <0.05 was considered statistically significant. Data visualization was accomplished using custom R scripts.
Results and discussion
Prenyl-transformations and the development of new labeling reagents
Over the past few years, we endeavored to create chemical conversions of a wide range of inert (poly)prenylated functionalities (32,33). For example, we found that 4-phenyl-1,2,4-triazoline-3,5-dione (PTAD) reacts with polyprenylated macromolecules in a superfast manner under physiological conditions. Similar reactivity has also been analyzed with the other two reagents including Selectfluor and nitroso derivatives, both have great application potential to study the biological prenyl functionality. The dynamic properties of the prenyl functionality have been extensively explored using our methods (see Supplementary Information (SI), Supplementary Figure S1, S9–S13 for details). We also discovered the pseudo first-order kinetics for the reaction involved prenyl molecule β-caryophyllene with PTAD. The calculated half-life time of 5 min and kinetic constant of 0.956 M−1•s−1 demonstrated the great application potential of our labeling reagents to study prenyl functionalized biomolecules. In addition, we also demonstrated that electron-donating groups on PTAD accelerated the process in a superfast manner (34). Further stability tests showed that both PTAD-labeling reagents and the resulting coupling adduct are relatively inert to the external environment.
With these chemical tools in hand, we first synthesized the i6A nucleoside (4 in Figure 2) through a linear 4-step process in an overall 69% yield (SI, Scheme S1, Supplementary Figure S2–S5), and started to test its compatibility with these labeling reagents. A rapid reaction was observed between i6A (4) and PTAD (5) (Figure 2A) with a clear color change in less than 5 min. The resulting products were monitored by in situ NMR (Figure 2B), confirming that this reaction can take place quickly with good targeting specificity in biocompatible conditions.
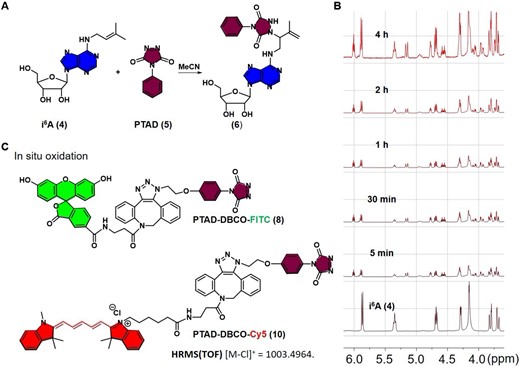
The reactions of i6A (4) with various functionalities. (A) Reaction of i6A (4) with PTAD (5) at room temperature. (B) Proton NMR was used to monitor the reaction of i6A (4, 0.03 mmol, 30 mM) with PTAD (0.15 mmol) in CD3CN/D2O (v/v, 1/1) at room temperature. The rapid reaction resulted in approximately 50% conversion yield within 5 min (peak at 5.5 ppm, triplet, is assigned to alkenyl site in prenyl group of i6A). From top to bottom: 4 h, 2 h, 1 h, 30, 5 and 0 min. (C) Chemical structures of the green fluorescent probe PTAD-DBCO-FITC (8) and the red fluorescent probe PTAD-DBCO-Cy5 (10).
To further expand this method and take advantage of the fluorescence labeling using this chemistry, we constructed two fluorescent probes derived from the structures of PTAD (8 and 10, Figure 2C, and SI, Scheme S2-S3 and Supplementary Figure S6-S8). The strain-promoted click reaction of azido PTAD with FITC-DBCO (SI, Scheme S2 and Supplementary Figure S6-S7) or Cy5-DBCO (SI, Scheme S3 and Supplementary Figure S8) proceeded smoothly to provide fluorescent precursors, followed by the in situ oxidation with N-bromosuccinimide (NBS) to yield fluorescent probes 8 and 10. In the meantime, we synthesized the i6A triphosphates (i6ATP) for its enzymatic incorporation into RNA strands. Based on previous studies, i6ATP was obtained in a linear 2-step process with 30% of isolated yields (SI, Scheme S4, Supplementary Figure S14-S15). All the data were consistent with the literature results. The peaks in the phosphorus NMR spectra at –10.5, –11.5 and –24.0 ppm were assigned to α, γ and β phosphorus atoms respectively, each with a J value of 26.8 Hz.
Fluorescence labeling of i6A in the metabolites of eukaryotic cells
With the two fluorescent labeling reagents and i6A-TP building block in hands, we asked whether i6A nucleoside can be incorporated by RNA polymerases in the process of transcription within eukaryotic cells, and if so can they be recognized and fluorescently labeled (Figure 3). To investigate this, we cultured HeLa cells to 70%-80% confluence in a 6-well plate, followed by adding different concentrations of i6A (4, 100, 200, 400 μM) in DMEM. Subsequently, the CMV-T7 and T7pro-IRES2-EGFP plasmids, as well as their conjugate units (SI, Supplementary Table S1–S3 and Supplementary Figure S16–S23) were transfected respectively in HeLa cells for 36 h before the measurement was taken for the expression of EGFP protein by fluorescence microscopy. As shown in Figure 3A, the expression of green fluorescent protein can only be detected in the presence of CMV-T7 and T7pro-IRES2-EGFP or their integration counterparts, which indicated the successful formation of specific transcripts of the target genes by T7 RNA polymerase in eukaryotic cells.
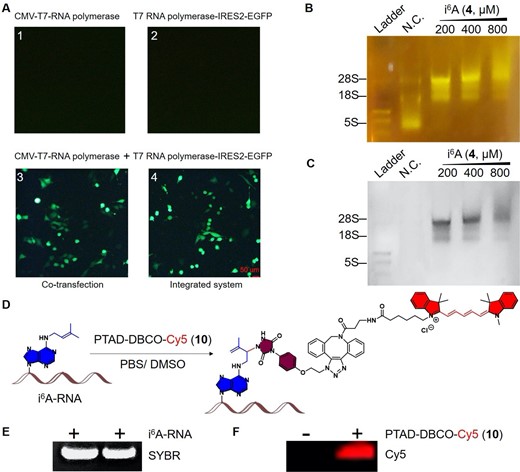
Investigation of the synthesized i6A (4)-incorporated RNAs in eukaryotic cells and its fluorescent labeling. (A) Expression level of EGFP green fluorescent protein initiated by the T7 RNA polymerase transcription system in HeLa cells. A1–A4 represent the transfection of CMV-T7 RNA polymerase, T7pro-IRES2-EGFP, CMV-T7 RNA polymerase with T7pro-IRES2-EGFP, and integrated CMV-T7 RNA polymerase-T7 pro-IRES2-EGFP respectively. Only co-transfection or integrated systems of CMV-T7 RNA polymerase and T7 pro-IRES2-EGFP displayed green fluorescent signals. (B) Detection of the green fluorescent signal in i6A-incorporated RNAs using PTAD-DBCO-FITC (8, 0.1 mM). (C) Goldview dye staining of i6A-incorporated RNAs. (D) Fluorescent labeling of i6A-incorporated RNAs using the well-designed PTAD-DBCO-Cy5 (10, 0.1 mM). (E) Fluorescent labeling assays of RNAs harboring i6A conducted through reverse transcription. ‘-’, without PTAD-DBCO-Cy5 treatment; ‘+’, with PTAD-DBCO-Cy5 treatment. (F) Red fluorescent imaging of PTAD-DBCO-Cy5 (10)-labeled i6A-RNAs in a gel. Bar scale: 50 μm.
For the labeling experiment, HeLa cells were harvested after the verification of cytotoxic study (SI, Supplementary Figure S24) and the total RNAs were extracted 12 h after the transfection, which were subsequently incubated with our PTAD-DBCO-FITC (8) or PTAD-DBCO-Cy5 (10) respectively. After excess washing, the purified RNAs were evaluated for the incorporation of i6A residues, and the overall PTAD-DBCO-FITC (8) fluorescent labeling efficiency was determined by agarose gel electrophoresis (SI, Supplementary Figure S25-S27). Both the modified and the wild-type RNAs appeared to have similar stability with i6A incorporated as observed in Goldview nucleic acid dye staining (Figure 3B–3C). In addition, the rRNA bands representing 5S and 18S were significantly shifted upward compared with the wild-type one. By contrast, no significant change was observed in the rRNA band at 28S. Notably, the fluorescence intensity of the RNAs containing i6A decreased when the level of i6A reached the cytotoxic concentration of 800 μM (Figure 3B, 3C, and Supplementary Figure S25–S27). No fluorescence signal was detected in the control group in comparision to a distinct fluorescence signal observed in the total RNAs incorporated with i6A and treated with PTAD-DBCO-Cy5 (10) probe (Figure 3D–3F). Notably, the direct in-gel fluorescent labeling of i6A-containing transcripts have also been intensively determined (Figure 3E). Our assays indicated that i6A nucleosides could be recognized and used in transcription by RNA polymerase and the resulting RNAs are detectable by our fluorescent probes. Having achieved successful fluorescent labeling, we proceeded to investigate whether chemically inducible sequencing could be accomplished by leveraging the distinct structure of the prenyl functionality.
Development of iodine-mediated cyclisation and reverse transcription (IMCRT) method for i6A profiling
We further examined the prenyl modification on RNAs (35–37) via the addition of I2, a versatile reagent utilized broadly in the cyclisation reaction of a prenyl group (42–44). As expected, the reaction of i6A with optimized concentration of iodine reagent proceeded very smoothly to yield the full conversion of i6A in less than 5 min (Figure 4A–4B). The NMR, mass spectrometry and UV results confirmed the spontaneous formation of the cyclisation adducts 3a or 3b (Supplementary Figure S28–S39).
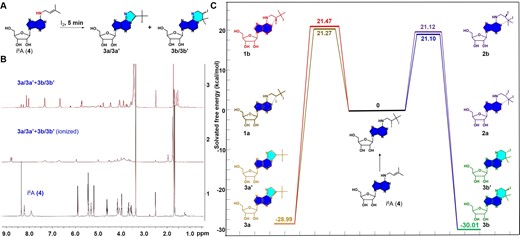
Investigation of the chemical transformations of prenylated nucleoside i6A (4) with Iodine (I2). (A) Reaction of i6A (4, 0.15 mmol) with iodine (0.45 mmol) at room temperature for 5 min. (B) Comparative analysis using proton nuclear magnetic resonance (¹H NMR, DMSO-d6, 400 MHz) for the reaction of i6A (4) and I2 with and without sodium persulfate. Bottom: ¹H NMR spectrum of pure i6A (4). Middle: ¹H NMR spectrum of pure i6A (4) following exclusive treatment with I2. Top: ¹H NMR spectrum of pure i6A (4), initially treated with I2 and subsequently treated with sodium persulfate. (C) DFT calculations for the possible product of the reaction of i6A (4) with I2. All the calculations were performed using the Gaussian 16, Revision B.01 program.
DFT calculations were performed to elucidate the possible reaction pathway and mechanism. The addition of I2 resulted in the spontaneous attachment of di-iodinyl atoms to the double bond of the prenyl group with four potential isomers formed because of the chirality of the products (1a-1b, 2a-2b) (Figure 4C and Supplementary Figure S40 for details). Two plausible reaction pathways have been identified thus far involving the formation of either five-membered or six-membered intermediates through a nucleophilic displacement process. Between the two products, compound 3b/3b’ has been demonstrated to be more abundant based on the extensive NMR studies (37), even though Figure 4C showed very small difference among the activation barriers of the four isomers. As a result, the iodine treatment followed by quenching with sodium persulfate converted i6A from an H-bond donor to a cyclic H-bond acceptor, which might change the enzyme recognition and cause base mutation during reverse transcription (RT) process, suggesting the potential application for the detection of the prenyl functionality in endogenous RNAs at a single-base resolution.
Profiling of artificially incorporated i6A residues in cell
We subsequently applied this IMCRT method to detect i6A modification sites in artificial RNAs. The T7P-EGFP gene (sequence information see Supplementary Tables S4–S5) was utilized as a template for in vitro transcription, employing T7 RNA Polymerase. In the course of cellular metabolism, living HeLa cells were fed with 30% and 70% i6A nucleoside in two groups respectively following the optimized protocol. The resulting EGFP RNA from each experimental group was further treated with I2 (0.5 M). Each EGFP RNA was then reverse transcribed into cDNA followed by PCR amplification. Each amplified EGFP amplicon was next cloned into the T-vector and transformed into DH5α E. coli. A total of 50 clones were picked from each group, followed by high-throughput sequencing and comparing with the native control to determine the sites of mutation on EGFP gene and to analyze the insertion efficiency of i6A (SI, Supplementary Figure S41). The incorporations of i6A into EGFP-mRNA in HeLa cells is randomly via salvage pathway using nucleotides i6ATP. It was found that i6A were settled from head to the middle of the sequences of this EGFP-mRNA (blue color in Supplementary Table S6 in SI). Deep analysis of i6A insertions at specific RNA sites and chemical-induced mutation with I2 treatment showed that we could distinguish the i6A residues from native adenosine sites at single base resolution. As a result, adenosine with prenyl modification displays normal base pairing with thymidine. By contrast, the addition of iodine induced the transformation of i6A to its cyclic form, thereby diminishing the normal base pairing specificity and resulting in a mixture of complementary G/C/U (Figure 5A). The base-mutation rates could be further measured by the sequencing data. It turns out that in the presence of 30% of i6ATP, the resulting A bases were significantly changed (Figures 5B1 and B3), whereas G/C/U displayed statistically minimal effect (Figures 5B2 and B4). By contrast, the I2-treated i6A shows a significant mutation rate, as shown in Figure 5C1 and C2, which demonstrated the feasibility of our method to detect the i6A sites in RNAs. Similar to the contribution of the bisulfite sequencing method to the biological studies of DNA/RNA methylation, this unique IMCRT sequencing strategy could open a new door for the study of prenylated RNA in terms of sequencing, biological function illustration and beyond.
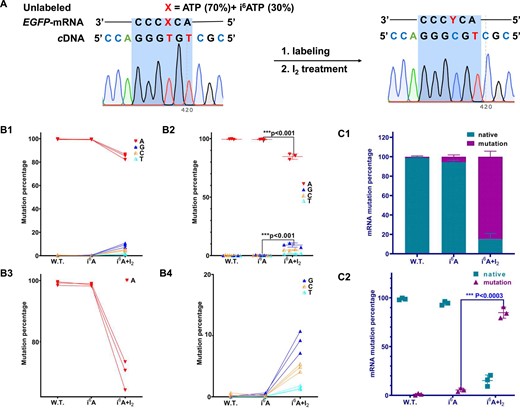
Detection of i6A sites in RNA at a single-base resolution. (A) Detection scheme for i6A modification sites in RNA by employing i6ATP in in vitro studies. Schematic of i6A insertion at a specific RNA site and chemical-induced mutation with I2 treatment. In the graph, ‘X’ denotes a mixture containing 70% molar concentration of ATP and 30% molar concentration of i6ATP. ‘Y’ signifies the reaction product derived from X following treatment with Iodine (I2). (B) Insertion of i6ATP at a specific site of transcribed RNA followed by chemical mutation after I2 treatment. A comparative analysis of i6A-incorporated RNA with and without iodine treatment showed that I2 treatment is a powerful tool for detecting i6A in nucleic acids. (C) Determination of mRNA labeling efficiency by i6ATP under in vitro transcription conditions.
Characterization of i6A modification in yeast tRNAs
In Saccharomyces cerevisiae, Mod5p is responsible for catalyzing the i6A modification at position 37 in six cytosolic (cy) and three mitochondrial (mt) tRNAs. These tRNAs include cy-tRNA-Ser-TGA-1, cy-tRNA-Ser-AGA-1, cy-tRNA-Ser-AGA-2, cy-tRNA-Ser-CGA-1, cy-tRNA-Cys-GCA-1, cy-tRNA-Tyr-GTA-1, mt-tRNA-Tyr-GTA-1, mt-tRNA-Cys-GCA-1 and mt-tRNA-Trp-TCA-1 (45–47). Our mass spectrometry results confirmed that the deletion of MOD5 leads to the complete loss of i6A modification in tRNAs (Figure 6A and Supplementary Figure S42A).
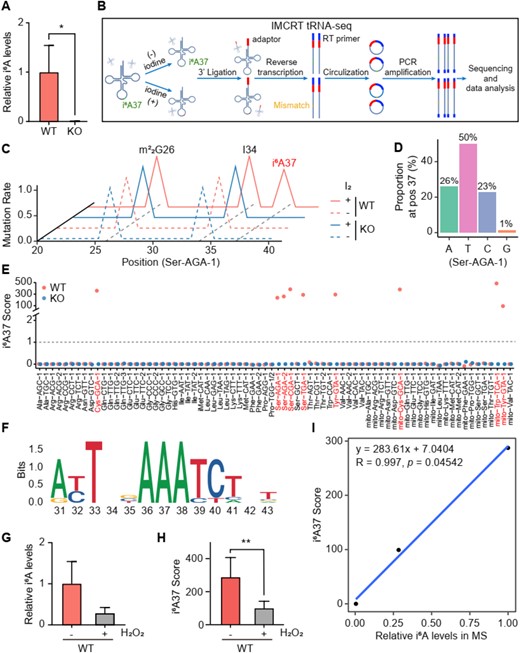
Mapping and quantification i6A sites in yeast tRNAs. (A) Plot showing the relative i6A levels in the wild-type (WT) and Δmod5 (KO) strains as determined by mass spectrometry (MS). (B) Schematic diagram of IMCRT tRNA-seq. Green dots represent i6A37; red dots indicate i6A37 following I2 treatment; yellow dots indicate mutations generated during reverse transcription. (C) Plot showing the mutation rate of cy-tRNA-Ser-AGA-1 from nucleotides 20 to 40 in the WT and KO strains, both with or without I2 treatment. The symbols ‘+’ and ‘-’ indicate with or without I2 treatment, respectively. (D) Plot depicting the mutation of A37 in cy-tRNA-Ser-AGA-1 in the sequencing reads of WT strains after I2 treatment. (E) Plot showing the i6A37 scores of each tRNA in the WT and KO strains, with or without I2 treatment. A dashed line at an i6A37 score of 1 indicates tRNAs with i6A37 modification. (F) Motif enrichment analysis around position 37 in all detected yeast tRNAs with i6A37 modification. (H) Plot showing the relative i6A levels in the WT strains before and after H2O2 (12 mM, 1 h) treatment. (H) Plot showing the average i6A37 scores of i6A37-containing tRNAs in the WT strains, both with or without H2O2 treatment. (I) Graph showing the linear correlation between i6A37 scores and relative i6A levels. Linear regression equation was displayed in the upper left of plot. Error bars in all graph indicate mean ± SD. *P < 0.05; *P < 0.01.
To map i6A sites and quantify their modification levels, we conducted IMCRT tRNA-seq. Gel-purified tRNAs were treated with or without I2 before constructing sequencing libraries (Figure 6B). The quality of these sequencing libraries was assessed using several key parameters. First, over 90% of the total reads uniquely mapped to yeast tRNA sequences (Supplementary Figure S42B). Second, the two biological replicates showed high consistency (Supplementary Figure S42C). Third, approximately 50% of the reads in all samples were full-length cDNA products (Supplementary Figure S42D). Lastly, several known RNA modifications, including m1A, m3C, m1G, and A-I editing (Supplementary Figure S42D), were readily identified based on mutations induced during reverse transcription (48). Collectively, these results confirm the high quality of our IMCRT tRNA-seq data.
Importantly, our IMCRT tRNA-seq enables the accurate identification of all yeast tRNAs with i6A modification. For instance, in wild-type cells, the mutation rate (MR) at A37 in cy-tRNA-Ser-AGA-1 was approximately 0% before I2 treatment (Figure 6C and Supplementary Figure S42E). The MR was increased to 72%, due to the mutation of A to T, C or G (Figure 6D). However, in the MOD5 deletion mutant, MR values remained around 0% both before and after I2 treatment. We calculated an i6A37 score for each tRNA based on the MR at position 37 in all tRNAs. In the wild-type cell, only 9 tRNAs had an i6A37 score greater than 1, corresponding to the previously characterized i6A37-containing tRNAs (Figure 6E and Supplementary Figure S42F). In the MOD5 deletion mutant, the i6A37 scores for these 9 tRNAs dropped to near 0. Furthermore, IMCRT tRNA-seq could distinguish i6A37-containing tRNAs with even a single nucleotide difference, such as between cy-tRNA-Ser-AGA-1 and cy-tRNA-Ser-AGA-2 (Supplementary Figure S42G), a task challenging for northern blotting-based methods (49). Consistent with previous studies, the 9 i6A37-containing tRNAs exhibited a conserved motif around A37 (Figure 6F), featuring three consecutive adenosines from positions 36 to 38 (50–52). Together, these results demonstrate that IMCRT tRNA-seq can accurately identify i6A37-containing tRNAs with single nucleotide resolution.
Next, we conducted IMCRT tRNA-seq experiments on tRNAs extracted from yeast cells cultured under different conditions. Consistent with a previous study, H2O2 treatment resulted in decreased tRNA i6A levels, as detected by mass spectrometry (Figure 6G, SI Supplementary Figure S43) (38). Notably, H2O2 treatment also led to significantly decreases in both MR values and i6A37 scores for i6A37-containing tRNAs (Figure 6H and Supplementary Figure S42H). Moreover, the average i6A37 scores determined by our IMCRT tRNA-seq exhibited a linear correlation with i6A levels as determined by mass spectrometry (Figure 6I). These results strongly suggest that our IMCRT tRNA-seq methodology has the potential to semi-quantitatively assess i6A37 levels of endogenous RNAs.
Conclusion
In summary, we employed Ene-ligation bioorthogonal chemistry and novel PTAD-based fluorescence probes for the direct labeling of i6A-containing RNAs in vitro. We synthesized the i6A triphosphate building block and demonstrated that it can be recognized and incorporated by eukaryotic RNA polymerase during intracellular transcription, allowing for adjustable i6A concentrations and the production of i6A-modified RNA that can be directly labeled by our PTAD-based fluorescent dye (8) and (10). This method enables us to study the functions of i6A and provides a general approach to label fluorescence onto RNAs for molecular tracking based on i6A addition.
We also discovered that iodine-mediated cyclization reactions of the prenyl group occur rapidly, transforming i6A from a hydrogen-bond acceptor to a donor. Leveraging this reactivity, we developed a novel iodine-mediated cyclization and reverse transcription sequencing (termed IMCRT tRNA-seq) method for profiling i6A residues in cellular RNAs. Following established protocols, we demonstrated that IMCRT tRNA-seq accurately identifies tRNAs containing i6A37 with single nucleotide precision, including all yeast tRNAs with i6A modification. Under stress response conditions (eg. H2O2), we observed decreased i6A levels in budding yeast, accompanied by substantial decreases in both the mutation rate at A37 and i6A37 scores. These findings suggest that our IMCRT tRNA-seq technique is not only capable of mapping i6A sites with single nucleotide resolution, but also permits semi-quantification of i6A levels in tRNAs.
In addition to i6A, over 100 RNA modifications have been identified. Accurate mapping and quantification methods are essential for studying their biological roles. While antibodies recognition of some specific modifications like m6A, m1A, m7G and ac4C have been used for mapping, their resolution is typically limited to tens or hundreds of nucleotides due to fragmented RNA sizes. Alternatively, methods combining unique chemical reactivity and detection of mutation/stop caused during reverse transcription have successfully identified a few modifications such as m5C, pseudouridine (Ψ) and ac4C at single-base resolution (53). However, low abundance modifications require increased sequencing depth or pre-library construction enrichment using antibodies, as in m1A-MAP methods. In budding yeast, the high proportion of i6A-containing tRNAs negates the need for enrichment, but detecting i6A in other RNA species might necessitate enrichment using anti-i6A antibodies (54,55).
While there is currently no clear evidence for the presence and distribution of i6A residues across the transcriptome, likely due to the lack of appropriate molecular tools, the question of whether this prenyl modification exists in other RNA species such as mRNA remains open. Nonetheless, i6A residues have been actively implicated in various human diseases, including diabetes, cancer, and neurodegenerative disorders. Moreover, the biological functions of prenyl modifications in both RNA and proteins have gained increasing recognition. For instance, the expression levels of prenylated 2′-5′-oligoadenylate synthetase 1 (OAS1) have been closely associated with the severity of hospitalized SARS-CoV-2 patients, highlighting the potential critical roles of prenylation in the human antiviral defense system (56). Our newly developed chemical biology methods will offer unique toolsets for detecting, profiling, and monitoring i6A residues in both normal and diseased cell environments, facilitating more comprehensive functional studies of this natural modification and shedding light on its implications in various biological processes and pathologies.
Data availability
The genome sequence data that support the findings of this study are available in NCBI GenBank database under accession nos. NC_000012.12 and NC_000009.12. All other data underlying this article are available in the article and in its online supplementary material.
Supplementary data
Supplementary Data are available at NAR Online.
Acknowledgements
Rui Wang thanks the starting fund from Huazhong University of Science and Technology for financial support. ‘One-Hundred-Talents’ Youth Program of Hubei Province is appreciated. Zhipeng Zhou thanks the funds from the National Natural Science Foundation of China [31970552 and 32270098], and the Fundamental Research Funds for the Central Universities (Program No. 2662019PY030). Jia Sheng thanks the financial support from US NIH [GM143749]. Jason Chin is highly appreciated for generous gift of the plasmid. We thank Prof. Sydney Hecht for valuable comments.
Author contributions: R.W. and Z.Z., J.S., L.W. designed the project. S.W., Y.Y.L, H.L.Z., Y.F.G. and J.J.Z. performed compound isolation and structural elucidation under the supervision of R.W., J.S. and S.W., H.L.Z. performed the chemical synthesis of PTAD-based probes. H.L.Z., Y.Y.L. and Y.F.G. conducted bioassays. Y.Y.L. and S.W. conducted NMR spectra measurements. H.L.Z., Y.Y.L., Y.F.G., Y.Y.Z. and L.W. conducted EGFP expression and purification, and some bioinformatic studies. S.S.C. did tRNA-seq, and Y.N.L. analyzed the data. R.W., Z.Z. and J.S. wrote the manuscript, with input from all co-authors.
Funding
National Institute of General Medical Sciences [GM143749]; Fundamental Research Funds for the Central Universities [2662019PY030]; Huazhong University of Science and Technology; National Natural Science Foundation of China [31970552, 32270098]. Funding for open access charge: Huazhong University of Science and Technology.
Conflict of interest statement. None declared.
References
Author notes
The first four authors should be regarded as Joint First Authors.

Comments