


Abstract
The efficiency and outcome of CRISPR/Cas9 editing depends on the chromatin state at the cut site. It has been shown that changing the chromatin state can influence both the efficiency and repair outcome, and epigenetic drugs have been used to improve Cas9 editing. However, because the target proteins of these drugs are not homogeneously distributed across the genome, the efficacy of these drugs may be expected to vary from locus to locus. Here, we systematically analyzed this chromatin context-dependency for 160 epigenetic drugs. We used a human cell line with 19 stably integrated reporters to induce a double-stranded break in different chromatin environments. We then measured Cas9 editing efficiency and repair pathway usage by sequencing the mutational signatures. We identified 58 drugs that modulate Cas9 editing efficiency and/or repair outcome dependent on the local chromatin environment. For example, we find a subset of histone deacetylase inhibitors that improve Cas9 editing efficiency throughout all types of heterochromatin (e.g. PCI-24781), while others were only effective in euchromatin and H3K27me3-marked regions (e.g. apicidin). In summary, this study reveals that most epigenetic drugs alter CRISPR editing in a chromatin-dependent manner, and provides a resource to improve Cas9 editing more selectively at the desired location.
Introduction
Cas9-mediated double-strand break (DSB) induction has become an invaluable tool for genome editing (1,2). Cas9 editing in eukaryotic cells has been optimized in various ways (reviewed in (3,4)). However, one remaining challenge is that the packaging of DNA into chromatin can hinder Cas9 from binding and cutting DNA (5–10). This is particularly the case in heterochromatin, the compacted form of chromatin (5,11–15). Silenced and cytosine-methylated DNA was also found to be relatively refractory to Cas9 editing (13), specifically in plants (16).
Cas9-induced breaks can be repaired by multiple pathways, including nonhomologous end joining (NHEJ), homologous recombination (HR), and microhomology-mediated end joining (MMEJ, also referred to as theta-mediated end joining) (17,18). Each of these pathways can yield different repair products: MMEJ typically results in small deletions, NHEJ can yield either small insertions or scar-less repair, and HR is thought to be essentially error-free (19–21). Thus, the outcome of a Cas9 editing experiment is strongly dictated by the relative activities of these pathways.
Evidence is accumulating that the local chromatin environment affects this pathway balance. For example, DSBs in heterochromatic regions are more frequently repaired by MMEJ than euchromatic regions (15), while contacts with the nuclear envelope can also alter pathway balance (22). Such effects may at least in part be explained by interactions of pathway-specific repair proteins with certain chromatin features such as histone modifications (reviewed in (23,24)). For example, CtIP, an important factor for DNA end resection (a key step in MMEJ and HR), can be specifically recruited to H3K36me3 (25,26). Another example is 53BP1, a key factor in the first steps of NHEJ. This protein is preferentially recruited at sites with H4K20me2 (27–29), but its recruitment is blocked by H4K16 acetylation (30–32).
Together, these findings highlight the importance of the local chromatin context for Cas9 editing, as it can affect (a) the editing efficiency and (b) the balance between repair pathways, and hence the probability of obtaining a desired mutation. For this reason, several studies have explored whether chromatin-modifying drugs may be employed to improve Cas9 editing (reviewed in (18,33–36)). These studies primarily focused on histone deacetylase (HDAC) inhibitors because these drugs are thought to cause decompaction of chromatin. Some HDAC inhibitors appeared to improve Cas9 genome editing, but to variable degrees (33–36). Importantly, because the binding and activity of HDACs varies across the genome (37), this effect may be expected to depend on the local chromatin context. Indeed, the HDAC inhibitor trichostatin A was found to improve Cas9 editing in four loci with low levels of H3K27ac, but much less in two loci with high levels of H3K27ac (35). This suggests that chromatin-modifying drugs may act differently across the genome depending on the local chromatin context. However, in the context of Cas9 editing the available evidence is only anecdotal; systematic analysis of this dependency on chromatin context has been lacking.
Besides HDAC inhibitors, a broad diversity of other chromatin-modifying drugs has been developed. Such drugs are candidates to improve Cas9 editing, but no systematic survey has been reported to our knowledge. It is likely that the effects of these drugs are dependent on the local chromatin context, because all these drugs target specific chromatin proteins that are not uniformly active across the genome.
Here, we report a systematic analysis of the chromatin context-dependent effects of 160 chromatin-modifying drugs on Cas9 editing in human cells. For this we used a previously described reporter that tracks the overall editing frequency and relative activities of MMEJ and NHEJ (15). We inserted this reporter into 19 different genomic locations that together represent all major types of chromatin (15), and then determined the editing efficiency and MMEJ:NHEJ balance in each of these locations after treatment with each of the 160 drugs. We applied a statistical framework to correlate the drug activities with the presence or absence of a wide range of chromatin features. We thus identified many drugs that modulate Cas9 editing and show that in many instances the local chromatin context can affect the impact of drugs on the editing efficiency as well as the MMEJ:NHEJ balance.
Materials and methods
Generation of cell line and cell culture
All the K562 experiments were performed on the earlier established K562#17, which is a clonal cell line of K562 cells (ATCC) stably expressing DD-Cas9 (20,38). In this study, we used a polyclonal cell pool that carries thousands of DSB reporters integrated by thousands of reporters integrated in parallel (TRIP) (GenBank: MW408732). For the screening we selected a clone (clone #5) from this cell pool carrying 19 reporters (15,39). Both the clone and cell pools were cultured in tissue culture flasks in RPMI 1640 (GIBCO) supplemented with 10% fetal bovine serum (FBS, HyClone) and 1% penicillin/streptomycin. Cells were kept at 37°C in a humidified atmosphere containing 5% CO2. For both screens, three separate cryovials of clone #5 cells were cultured separately for two weeks, one for each replicate. The TRIP cell pools were kept in culture for less than two weeks to avoid clonal drift, where, over time, the reporters in fitter cells would outnumber the other reporters (39). We generated TRIP cell pools in RPE-1 p53WT cells (described in the ‘DSB-TRIP pool generation in RPE-1 cells’ section) with endogenously tagged HALO-53BP1 and RPA1-mScarlet2 (40), an inducible Cas9 (40), and polyclonal expression of pLenti-eGFP-OR3-GFP (Neo-VirTech, France) (41). These cells were cultured in DMEM/F12 (1:1) medium with 10% FBS and 1% penicillin/streptomycin.
Guide RNA transfections
To induce DSBs at the 19 sgRNA target sites (all with the sequence 5′ GCCGATGGTGAAGTGGTAAG 3′), per replicate, 30 × 106 clone #5 cells were transfected with the sgRNA plasmid (five nucleofections of 6 × 10⁶ cells), and 6 × 10⁶ clone #5 cells for the control nucleofection (plasmid carrying GFP). For transfections, 6 × 10⁶ clone #5 cells were resuspended in 100 μl transfection buffer (100 mM KH2PO4, 15 mM NaHCO3, 12 mM MgCl2, 8 mM ATP, 2 mM glucose (pH 7.4)) (42). After the addition of 6.0 μg plasmid DNA expressing either LBR2 sgRNA or GFP, the cells were electroporated in an Amaxa 2D Nucleofector using program T-016. Subsequently, the electroporated cells were plated in 10-cm dishes and incubated overnight for the cells to recover. Nucleofection efficiency was estimated by flow cytometry on the GFP transfected samples prior to the screening.
Addition of the epigenetic screening library
104 cells were dispensed in each well of a 96-well plate in a total volume of 80 μl using a Multidrop Combi fluid dispenser (ThermoFisher Scientific). For the drug addition, we combined two 96-well epigenetic drug screening libraries from two commercially available libraries from Selleck Chemicals and Enzo Life Sciences (for list of drugs see Supplementary Table S1). The drugs had stock solutions of 5 mM, 1 mM and 500 μM and were diluted in a step wise process in complete medium with 500 nM final concentration Shield-1 for Cas9 stabilization (Aobious cat. no. AOB1848) (38), and then added to the sgRNA transfected cells, yielding final drug concentrations of 10 μM, 1 μM and 100 nM. All steps were performed using a Microlab STAR liquid handling workstation (Hamilton). Four different control drugs were added to the outer columns of the 96-wells using a HP D300 Digital Dispenser. DNA-PKcs inhibitor NU7441 (Cayman; diluted 1:1000 from 1 mM stock in dimethylsulfoxide (DMSO), final concentration 1 μM) was used as a positive control for NHEJ inhibition and MRE11 inhibitor mirin (diluted 1:1000 from 12.5 mM stock in DMSO, final concentration 12.5 μM) was used as a positive control for MMEJ inhibition. DMSO was used as a negative control (1:1000) and phenylarsine oxide (PAO; 10 μM, 1:1000 from 10 mM stock) was used as a positive toxicity control.
Viable cell count assay
The viable cell count was measured 72 h after the drug addition with a resazurin assay. 20 μl of 5x resazurin was added to the 96-wells plate with the Multidrop Combi fluid dispenser (ThermoFisher Scientific). Plates were shaken and incubated for 3h at cell culture conditions before measuring the fluorescence (560Ex/590Em) on an EnVision Multilabel Plate Reader (PerkinElmer). The lowest fluorescence from the PAO killing control in each replicate was subtracted from all the samples within the sample replicate to standardize the raw values. The viable cell counts per sample were then normalized on the average fluorescence of the control samples (DMSO treated) within each of the six replicates. Cell count viability filters are further explained below in the ‘Analysis of high-throughput sequencing data of the screen’ section.
High-throughput sequencing
After measuring the viable cell count, the cells were processed for PCR. The cells were transferred to 96-well plates suitable for PCR and subsequently centrifuged at 300 g for 5 min. Then, the supernatant was removed prior to the addition of 20 μl DirectPCR Lysis Reagent Cell (Viagen, cat. no. 301-C) supplied with 1:100 10 mg/ml proteinase K (Bioline, cat. no. BIO-37084). The cells were lysed by incubating for 3 h at 55°C and the proteinase K was inactivated for 10 min at 95°C. PCRs were performed in two steps: PCR1 with 10 μl of the crude lysates, 25 μl 2× MyTaq HS Red Mix (Bioline, cat. no. BIO-25048), and plate-specific Illumina PCR indexed primers (TAC0012 and TAC0007, final concentration 1 μM; Supplementary Table S2). PCR2 was performed using 15 μl 2 x MyTaq Red Mix (Bioline, cat. no. BIO-25044) and 5 μl of each PCR1 product with well-specific Illumina PCR indexed primers (TAC0159 & TAC0009, 1 μM; Supplementary Table S2). Each sample was generated with a unique combination of a plate-specific primer (TAC0007) and well-specific primer (TAC0159). PCR1 was carried out using initial 5 cycles of 1 min at 95°C, 15 s at 95°C, 15 s at 55°C and 15 s at 72°C; followed by 10 cycles of 15 s at 95°C, 15 s at 70°C and 15 s at 72°C. PCR2 was performed using one of the initial cycles; followed by 14 of the subsequent cycles. Prior to pooling all the samples, we tested for PCR efficiency variability within a plate. 10 μl of all wells of three different 96-wells plates were loaded on a 1% agarose gel and showed little variability between the samples. 5 μl from each reaction was used to pool the library. Primer dimers were removed by CleanPCR bead purification (CleanNA, cat. no. CPCR-0050) using a 0.8:1 bead:sample ratio. The samples were then eluted in 50 μl and further purified by loading it onto a 2% agarose gel. The PCR product was cut from gel to remove any other undesired products and cleaned with the PCR Isolate II PCR and Gel Kit (Bioline, cat. no. BIO-52060). The isolated samples were sequenced by Illumina MiSeq for screen 1 (14.3 million reads) and by NextSeq Mid for screen 2 (88.4 million reads) which allowed for an average of 477 reads per barcode per sample in screen 1 and 2896 reads in screen 2.
Flow cytometry to assess cell cycle arrest
To generate cell cycle profiles upon drug addition, the DNA content was measured using flow cytometry. 5 × 10⁶ clone #5 cells were transfected with the sgRNA plasmid (5 μg) or a GFP-expressing control plasmid (5 μg) per replicate as described above. The cells were plated in 96-well plates and candidate drugs and Shield-I were added as described above. 72 h after the Cas9 activation and drug addition, viable cell count was estimated as described above. Then, the cells were centrifuged at 300 g for 5 min. The supernatant was removed followed by resuspension in 140 μl Nicoletti buffer (0.1% sodium citrate (pH 7.4), 0.1% Triton X-100, 50 μg/ml propidium iodide (PI)) supplied with 1:100 10 μg/ml RNase A (ThermoFisher Scientific). The DNA content of the samples in the 96-wells plates was measured on the Attune NxT Acoustic flow cytometer (ThermoFisher Scientific) using a 405 nm laser for excitation. Flow cytometry data and cell cycle fractions were analyzed and calculated using FlowJo v10.
TIDE experiments to estimate decitabine-induced changes in indel ratios
To examine DSB repair pathway choice upon treatment with decitabine, we induced DSBs using our sgRNA in clone #5 cells and then added DMSO or 10 μM of decitabine. To assess single-strand template repair (SSTR), we transfected together with the sgRNA a single-stranded oligodeoxynucleotide (ssODN) that served as a template for SSTR. This template was previously characterized and typically leads to a +2 insertion at the sgRNA target site (15). As a negative control, the cells were transfected with a GFP-expressing plasmid. Cas9 was activated by the addition of Shield-1. After 72h, DNA was isolated using 20 μl of DirectPCR Lysis Reagent Cell (Viagen) supplemented with 1:100 10 mg/ml Proteinase K (Bioline). TIDE was performed as described before (43). The sgRNA target site was amplified by PCR (using primers TAC0017 & TAC0018), purified, and subjected to Sanger sequencing (with TAC0018). Sequencing results of the GFP transfected cells and the sgRNA transfected cells were then analyzed using TIDE.
TIDE experiments to estimate total indel frequency in additional heterochromatic loci
To assess drug-induced increases in total indel frequency (TIF) in other genomic loci than the one used in the screen, we selected four additional sgRNAs targeting heterochromatic loci (Supplementary Table S3). Per sgRNA, 106 K562 clone #5 cells were transfected using 2 μg of sgRNA-expressing plasmid. After 12 h, 2 × 10⁴ cells were plated in 96-wells and Shield-1 and drugs (DMSO, PCI-24781 (100 nM), AT9283 (100 nM), resveratrol (10 μM), tubastatin A (10 μM)) were added. 72h later, DNA was isolated using 20 μl of DirectPCR Lysis Reagent Cell (Viagen) and sgRNA target sites were amplified for TIDE analysis as described above (using primers SM8 + 9 (LAD2), SM18 + 19 (LAD7), SM24 + 25 (LAD10) and TAC0200 + 201 (TBX5)). Experiments were performed in five replicates on five different days. The indels were annotated with the most likely repair pathway according to inDelphi (73).
Generation of the pPTK-BC-IPRv2
The pPTK-BC-IPRv2 construct was derived from the pPTK-BC-IPR plasmid (15). A 600 bp gene fragment (TRIP_ANCH3 gBlock) was designed and ordered from IDT containing a 400 bp ANCH3 sequence (NeoVirTech, France), followed by the sgRNA-LBR2 target sequence, an ISce-I site, 20 bp random nucleotides for barcoding, and homology arms left and right of the gBlock. This TRIP-ANCH3 gBlock was Gibson-cloned in a NheI/KpnI digested pPTK-BC-IPR. This construct (pPTK-BC-IPRv2) was used to make the barcoded plasmid libraries as described before (15).
DSB-TRIP pool generation in RPE-1 cells
DSB-TRIP pools were generated as described in (44) with the following modifications. First, p53 was transiently knocked-down to enable efficient DNA nucleofection in RPE-1 cells. For this, 20 nM p53-targeting siRNA (ONtargetPLUS siRNA TP53, L-003329-00-0005, Horizon) was transfected with 2 μl RNAiMAX lipofectamine (ThermoFisher, cat. no. 13778150) in 200 μl of OptiMEM (Gibco, cat. no. 31985062) in a final volume of 2 ml. Three days later, 5 × 10⁶ RPE-1 cells were resuspended in 100 μl electroporation buffer (100 mM Na2HPO4-7H2O, 10 mM KCl, 11 mM MgCl2 and 8 nM ATP (pH 7.75)). Next, 5 μg of pPTK-BC-IPRv2 construct and 5 μg PB transposase-mCherry construct were added and electroporated them using Amaxa 2D Nucleofector (T-023 program). 48 h post-electroporation, RPE-1 cells were sorted for mCherry-positivity to isolate cells that received the plasmid. Then, PB transposase expression was induced by adding of 0.5 μM 4-hydrodytamoxifen (4-OHT). Sixteen hours after, cells were washed twice with medium to get rid of the 4-OHT. The sorted cells were cultured for a week and then again sorted for mCherry-negativity. 1000 mCherry negative cells were plated in 48-well plate in conditioned RPE-1 medium (45% filtered medium from growing RPE-1 cells, 45% complete fresh medium and 10% FBS). This step is important to select for cells that lost any plasmid leftover. After the second sort, cells were expanded and the integrated pathway reporters mapped by inverse PCR.
Integrated pathway reporter mapping in RPE-1 cells by inverse PCR
The genomic location of the integrated reporters in the RPE-1 cell pool were mapped by inverse PCR (44), with the following modifications. First, 20 million cells were lysed overnight in 5 ml lysis buffer (10 mM Tris–HCl pH 8.2, 400 nM NaCl, 2 mM EDTA, 0.6% SDS, 0.1 mg/ml proteinase K and 0.1 mg/ml RNase A (Thermo Fisher, cat. no. 12091-021)). After overnight incubation, 5 ml of saturated NaCl (∼6 M) was added and mixed vigorously for 15 seconds. Then, the solution was spun down for 15 min at 2500 rpm. 9 ml of the supernatant was transferred to a new tube and DNA precipitated by adding 22.5 ml of 96% EtOH and incubation for 10 min on ice. After centrifugation for 10 min 12500 rpm, precipitated DNA was washed with 70% EtOH and then resuspended in 500 μl of ddH2O. Every step from this moment on was done in technical triplicates. 6 μg of genomic DNA were digested with 40 U DpnII (10 U/μl, New England Biolabs, cat. no. R0543L) in a final volume of 100 μl for 16 hat 37°C and the enzyme heat inactivated for 20 min at 65°C. Then, the digested DNA was purified with CleanPCR beads at a ratio of 2:1 beads:sample ratio, eluted in 50 μl of ddH2O and DNA concentration quantified by Nanodrop. Next, 600 ng of digested DNA were self-ligated by 40 U of T4 DNA ligase (5 U/μl, Roche, cat. no. 10799009001) in a total volume of 400 μl at 4°C for 16 h. The self-ligated DNA was purified by phenol:chloroform purification, resuspended in 30 μl of ddH2O, digested by PlasmidSafe ATP-Dependent DNAse (Biosearch technologies, cat. no. E3101K) and purified by bead purification at a 2.4:1 ratio. Then, inverse PCR was performed in three steps using the 2× NEBNext master mix (New England Biolabs, cat. no. M0541L). PCR1 was performed with 5 μl of ligated template and 200 nM of EB0061 and EB0062 primers for 13 cycles at 65°C annealing temperature in a final volume of 25 μl. PCR2 was performed with 1 μl of PCR1 reaction and 200 nM of TAC0007 indexed primer and EB0353 primer for 13 cycles at 62°C annealing temperature in a final volume of 25 μl. The same index was used for all three technical replicates. PCR3 was performed with 1 μl of PCR2 reaction and 200 nM of TAC0009 and TAC0010 primers for 16 cycles at 60°C annealing temperature in a final volume of 50 μl. After PCR3, technical replicates were combined and 5 μl of each sample run in a 1% agarose gel (a smear ranging 300–3000 bp should be visible). Then, the PCR products were bead purified at a 1.8:1 ratio. Purified products were quantified by Nanodrop and pooled in equimolar amounts. Lastly, 2 μg of combined product was digested with 20 U NotI-HF in 100 μl volume to get rid of any original plasmid leftover and the product was bead purified beads at a 2.4 ratio. We sequenced this sample in a MiSeq (Illumina) with paired-ended 150 bp reads with 20% PhiX spike-in.
Analysis of inverse PCR data and chromatin context characterization of RPE-1 cells
The genomic coordinates and chromatin feature scores for each assayed integrated pathway reporter (IPR) in the RPE-1 cell pool were calculated using the pipeline described in (39), using a bin size of 2000 bp for each chromatin feature. A total of 10 chromatin features were used to characterize the chromatin context of the IPRs (Supplementary Table S4, S5) (45,74–76). Of those 10 chromatin features, we generated pA-DamID tracks for three heterochromatic features (H3K27me3 (Diagenode, cat. no. C15410195), H3K9me2 (Active Motif cat. no. 39239) and H3K9me3 (Diagenode, cat. no. C15410193)) following the standard pA-DamID protocol for RPE-1 cells (45). We provide a table with the genomic coordinates and chromatin feature z-scores of the 15 IPRs used in this manuscript in Supplementary Table S6.
Chromatin immunoprecipitation (ChIP) sequencing upon HDAC inhibitor treatment
Per condition, 20 × 106 clone #5 cells were cultured for 16 hin 15 cm dishes in drug-supplied medium (DMSO (1:1000), PCI-24781 (100 nM), or tubastatin A (10 μM)). Then, cells were fixed using 1% formaldehyde and incubated while stirring for 10 min at room temperature. Fixation was stopped by adding 0.15 mM glycine and stirred for 1–2 min. Fixed cells were then pelleted by three consecutive centrifugations (6 min at 500 g) and washes with PBS, and subsequently snap frozen and kept at -80°C until further processing. ChIP was performed as previously described (46,47) with minor modifications. Briefly, cell pellets were thawed on ice, resuspended in lysis buffer 1 (LB1: 50 mM Hepes, 140 mM NaCl, 1mM EDTA, 10% glycerol, 0.5% NP40, 0.25% Tx100, KOH to pH 7.5; 10 × 106 cells/ml) and incubated on ice for 10 min. Nuclei were pelleted at 800 g for 10 min at 4°C. Pellets were resuspended in lysis buffer 2 (LB2: 10 mM Tris, 200 mM NaCl, 1 mM EDTA, 0.5 mM EGTA, HCl to pH 8; 10 × 106 cells/ml), incubated 10 min on ice and centrifuged at 800 g for 10 min at 4°C. Pelleted nuclei were resuspended in lysis buffer 3 (LB3: 10 mM Tris, 100 mM NaCl, 1 mM EDTA, 0.5 mM EGTA, 0.1% Na-DOC, 0.5% lauroylsarcosine, HCl to pH 8; 30 × 106 cells/ml). Nuclei were sonicated for 4 cycles (30s ON, 30s OFF) using the PicoBioruptor (Diagenode). Triton X100 was added to the sheared chromatin at a final concentration of 1% and debris were pelleted for 15 min at 20 000 g at 4°C. The supernatant was then incubated overnight under rotation at 4°C with 50 μl (1.5 mg) of Protein A Dynabeads (Invitrogen), previously incubated with 3 μg of either H3K27ac (acm39133, Active Motif; lot #06921014) or H3K27me3 (C15410195, Diagenode, lot #A0824D) antibody. Beads were then washed 10 times with RIPA-ChIP buffer (50 mM HEPES, 500 mM LiCl, 1mM EDTA, 1% NP-40, 0.7% Na-DOC, pH 7.6), washed once in TBS, reverse cross-linked at 65°C in 500 μl of Elution Buffer (EB: 0.1M NaHCO3, SDS 1%, 200mM NaCl) for 4 h. Upon 30 min treatment with 40 μg RNase A (Life Technologies), 1 h treatment with PK buffer (10 μl 0.5M EDTA, 20 μl 1M Tris–HCl pH 6.5, 40 μg Proteinase K (Invitrogen)), ChIP DNA was purified using phenol/chloroform and precipitated with 0.7 volumes of 2-propanol. Illumina multiplex-sequencing with 51 bp paired-end setup was performed on the NovaSeq 6000 (Illumina) sequencer following manufacture instructions.
Assaying drug effects on IPRs in RPE-1 cells
To determine the effect of specific drugs, 2.5 × 10⁵ cells/well of the generated RPE-1 DSB-TRIP pool were plated in 6-cm dishes and Shield-1 was added (500 nM final concentration) to stabilize Cas9 expression. Doxycycline, normally used to activate Cas9 transcription in these cells, was not used in the experiments since the background Cas9 expression in the iCut RPE-1 cells already allows for cutting efficiencies that are in the range of the DD-Cas9 K562 cells. 24 h after plating the cells, LBR2 sgRNA was transfected as follows. For each individual condition, 4 μl of 20 μM LBR2 crRNA (IDT) were mixed with 4 μl of 20 μM tracrRNA (IDT) and 42 μl nuclease-free duplex buffer (IDT) and incubated for approximately 5 min. 342 μl OptiMEM (ThermoFisher Scientific) were then mixed with 8 μl Lipofectamine RNAiMAX (ThermoFisher Scientific), incubated for approximately 5 min, and then mixed with the crRNA-tracrRNA solution. After 15 min of incubation, 400 μl of the mix was added dropwise to the cells per sample. Drugs (DMSO, PCI-24781 (1, 10, 33, 100 nM), AT9283 (100 nM), tubastatin A (10 μM)) were added directly after transfection. The Shield-1 and drug-supplied medium was refreshed 6 h after transfection. 72 h after transfection cells were harvested. Cell pellets were resuspended in DirectPCR Lysis Reagent as described above. For each sample, three PCR reactions were performed as mentioned in the 'High-throughput sequencing' section using 5 μl of the lysates as input. The experiments were done in three biological replicates on three separate days.
Validation experiments using LBR2-sgRNA/Cas9 ribonucleoproteins (RNPs)
To assemble LBR2-sgRNA/Cas9 RNPs, 2.5 μl of 5 μM of LBR2 crRNA (Supplementary Table S3) were mixed with 2.5 μl of 5 μM tracrRNA (IDT), incubated for 5 min at 95°C and subsequently cooled down to room temperature. Then, 4.8 μl of the cr:tracrRNA (12 pmol) were mixed with 0.17 μl of 61 μM Alt-RTm S.p. Cas9 Nuclease V3 (10.4 pmol; IDT, cat. no. 1081059) and incubated for 15 min at room temperature. Transfections of the assembled RNPs was done using the SF Cell Line 4D-Nucleofector X Kit S (Lonza, cat. no. V4XC-2032). 3 × 10⁵ clone #5 cells were resuspended in 20 μl supplemented nucleofector SF solution and then mixed with the assembled RNPs and 1 μl of 100 μM Alt-R® Cas9 Electroporation Enhancer (IDT, cat. no. 1075915). The cells were then nucleofected in a 16-well Nucleocuvette™ Strip using a 4D-Nucleofector™ and program FF-120. Nucleofected cells were allowed to recover for 10 min in the cuvette, before transferring 2 × 10⁴ cells per 96-well into four different wells. Drugs (DMSO, PCI-24781 (100 nM), AT9283 (100 nM), tubastatin A (10 μM)) were added prior to transfection in a total volume of 100 μl per well. Cells were harvested 72 h after transfection. Lysis and PCR reactions were done as described in the 'High-throughput sequencing' section. The experiments were done in three biological replicates on three separate days and analyzed as described in the 'Analysis of high-throughput sequencing data of the screens' section.
Vorinostat experiments in K562 DSB-TRIP pool cells
The experiments in the K562 DSB-TRIP cell pools were performed as follows in three biological replicates. The TRIP pools (15) consist of two different polyclonal cell populations with each a different set of randomly integrated reporters (pools A and B). 6 × 10⁶ cells from each pool were transfected with 6 μg of LBR sgRNA plasmid as described above and seeded in 10-cm dishes for overnight recovery. Shield-1 and either DMSO (1:1000) or vorinostat (1 μM final concentration, 1:1000 from 1 mM stock in DMSO) were added to start break induction. The samples were collected 72 h after the addition of the drugs and genomic DNA (gDNA) was extracted using the ISOLATE II genomic DNA kit (Bioline, BIO-52067). The samples were then quantified using Nanodrop and 200 ng of gDNA was used in the library PCRs that were performed as described in the ‘High-throughput sequencing’ section. The resulting libraries were purified and quantified with a Qubit fluorometer before being combined and sequenced by NextSeq MID.
Analysis of high-throughput sequencing data of the screens
Analysis of the raw demultiplexed sequencing data was done using our previously reported computational pipeline (39). Briefly, indel size counts were generated for each integration of each well by measuring the distance between constant sequences up- and downstream of the cut site in each reporter sequence read, and linking this to the barcode of that read. The processed data was then filtered and analyzed in R. Several filtering steps were implemented prior to the analysis. As + 1 bp insertions (NHEJ) and -7 bp deletions (MMEJ) were the most important and in general abundant indel reads in our assay, we required each sample to have at least a sum of 30 reads for +1 and –7. Samples with fewer reads were discarded, resulting in 3274 remaining samples (of 3456 total samples), with on average 18.7 IPRs per sample (excluding the PAO samples). To analyze drugs that increase TIF, samples with <25% viable cell counts relative to the DMSO treated controls were removed. This cutoff was more stringent when analyzing the pathway balance (at least 40% of the control viable cell count) due to the importance of the cell cycle in the pathway balance choice, and even higher when analyzing drugs that reduce TIF (at least 70% relative to the control) due to more complex confounding effects (such as transcription or cell cycle). Drug-concentration conditions were discarded when more than one replicate was below the threshold for the given measure. This resulted in 65 samples not passing the 25% filter to analyze TIF increases, 73 samples not passing the 40% filter for the pathway balance (both including the killing control), and an additional 31 samples not passing the 70% filter to analyze decreases in TIF (see Supplementary Tables S7 and S8). The TIF (equation {1}) and MMEJ:NHEJ ratio {2} were only calculated when the replicate passed the viability cutoffs. This made sure we had representative replicates and reliable measurements.
where |$intac{{t}_{reads}}$| is the number of reads with 0 indels, |$tota{{l}_{reads}}$| the number of total reads for that sample and barcode, |$MME{{J}_{reads}}$| the number of 7 bp deletion reads, and |$NHE{{J}_{reads}}$| the number of 1 bp insertion reads.
Z-score calculation and significance calling
To call significant effect at each IPR for all the samples, we used the 24 control wells per replicate (four per plate and six plates per replicate, from two drug plates and three concentrations) to determine the control distribution per IPR per replicate for the TIF and the MMEJ:NHEJ ratio. We then fitted normal distribution to the control data to determine the mean and standard deviation per IPR per replicate. These were then used to calculate z-scores (|${{Z}_{measure}}$|) for the IPRs in all the samples {3}. The z-scores per IPR, drug, concentration and replicate were calculated as follows for both the TIF and the MMEJ:NHEJ balance.
where measure is either TIF or MMEJ:NHEJ and |${{N}_{null}}$| is a normal distribution of the measure fitted with control treated samples (DMSO, n = 24).
To assure reproducibility between replicates and screens, specifically for the samples with an effect, we set up a two-step reproducibility filter. First, IPRs required an absolute z-score > 1.96 (equivalent to P < 0.05) in at least one out of two or two out of three replicates (on average each IPR was present in 2.9 and 2.87 replicates in screen one and two respectively across all the samples). Second, we calculated the combined z-score of the three replicates in each screen using the Stouffer method (48) {4}. We used this |${{Z}_{screen}}$| only to test whether the replicates had the same effect, i.e. the samples required the same sign. We calculated a combined z-score for all the samples as below to obtain the final |${{Z}_{combined}}$| {5}. We then transformed this |$Z$| to a P-value and corrected for multiple testing using the Benjamini–Hochberg correction (49). For the global measurements, we first averaged the values of all the IPRs, and we calculated the z-scores and P-values in the same way. The |${{Z}_{screen}}$| for the screen reproducibility filter was calculated as follows.
where n is the number of replicates in that screen with sufficient reads and viable cell count (between one and three).
The final |${{Z}_{combined}}$| was calculated as follows:
where n is the number of replicates in total (between 2 and 6).
Statistical analyses
The statistical analyses when done are indicated in the text or figure legends.
Chromatin context-dependency analysis
The chromatin context-dependency (CCD) analysis was performed as described previously (50). In brief, we first filtered for drug-concentrations with at least one IPR with a significant effect (Padj< 0.01, based on their |${{Z}_{combined}}$| and Benjamini–Hochberg (BH) adjusted for multiple testing) on either the TIF (n = 81/160) or the pathway balance (n = 89/160). None of the vehicle-treated samples passed this threshold. These drugs were then either qualified as having an increasing, decreasing, mixed or no effect on the TIF or on the pathway balance based on the |${{Z}_{combined}}$|. Increasing drugs would have > 1 IPR with a |${{Z}_{combined}}$| > 1.96 and ≤ 1 IPR with a |${{Z}_{combined}}$| < –1.96. Decreasing drugs would have the inverse. Drug-concentrations with a mixed effect would have ≥ 1 IPR with|$\ {{Z}_{combined}}$| > 1.96 and ≥ 1 IPR with |${{Z}_{combined}}$| < –1.96. Finally, all remaining samples were classified as having no effect.
For the chromatin context-dependency analysis of the drug-induced changes in TIF, we first calculated a TIF ratio (total reads edited over total reads unedited) to bypass the limitation that the TIF values range from 0 to 1. We calculated the |$TI{{F}_{ratio}}$| and then computed the log2 fold-change compared to the control as follows:
where TIF is the average total indel frequency per barcode and drug-concentration and |$TI{{F}_{CTRL}}$| is the average TIF per barcode in the DMSO samples (n = 24). Similar to the |$\Delta lo{{g}_2}( {TI{{F}_{ratio}}} )$|, we calculated the |$\Delta lo{{g}_2}( {MMEJ:NHEJ} )$| using the MMEJ:NHEJ ratio. Then, as described in detail in (50), we performed a principal component regression using available chromatin maps (25 chromatin features in K562 and 10 in RPE-1) and constructed a linear model using the top three principal components (PCs) to predict the |$\Delta lo{{g}_2}( {TI{{F}_{ratio}}} )$| and |$\Delta lo{{g}_2}( {MMEJ:NHEJ} )$|. We then computed the p-value of the correlation of the predicted versus the measured values. After BH correction for multiple testing, we obtained 56 drug-concentrations that had passed the significance threshold of Padj < 0.01 for the TIF and 83 drug-concentrations for the balance (Supplementary Table S9).
Finally, on the drug-concentrations that passed these filters, we performed linear modelling with the |$\Delta lo{{g}_2}( {TI{{F}_{ratio}}} )$| and |$\Delta lo{{g}_2}( {MMEJ:NHEJ} )$| against all the 25 chromatin features separately for K562 data and 10 features for RPE-1. The slope of this model was used as the synergy score. For ease of interpretation, we used the following rules. (i) For the TIF we only focused on drug-concentrations with either a mixed or increasing effect on TIF and a positive synergy score (i.e. positive slope of the linear model). This means that the effect of the drug (here only causing an increase in TIF) increases with the presence of the chromatin feature at the IPR. (ii) For the pathway balance we only looked at samples with an increasing or mixed effect with a positive synergy score, or a decreasing or mixed effect with a negative synergy score. This way we focused on drug-concentrations for which the effect (either shifting the balance towards MMEJ or NHEJ) increases with the presence of the chromatin feature.
Data analysis of experiments with the RPE-1 cell pool
Data processing was done as described for the K562 data above. Additionally, only IPRs with >7000 reads per sample were kept. With these filters, data for 15 IPRs were retrieved. For the chromatin context-dependency analysis, a P-value <0.15 cutoff for the linear modelling prediction (after correcting for multiple testing) was used.
Chromatin composition of assayed genomic loci
The chromatin features for each sgRNA and IPR were processed as reported previously (15) using the coordinates from Supplementary Table S3 for the sgRNAs.
Analysis of ChIP-seq data upon HDAC inhibitor treatment
All ChIP-seq samples were processed using the SPACCa pipeline (available at https://github.com/sebastian-gregoricchio/SPACCa) using default parameters. FASTQ reads were mapped to the reference genome Hg38/GRCh38 using the accelerated version of the Burrows-Wheeler Aligner (BWA-MEM2 v0.5.10 (51)). Reads were filtered based on mapping quality (MAPQ ≥ 20), and duplicated reads were removed. Signal of three biological replicates was averaged per condition using the bigwigAverage function from deepTools (52). Differential peak analyses were performed using DiffBind (53) using the DESeq2 mode and applying a threshold of ±1 for the log2(fold-change) and 0.05 for the false discovery rate (FDR). Genomic snapshots were generated using pyGenometracks (54).
Results
Overview of the reporter system and the design of the screen
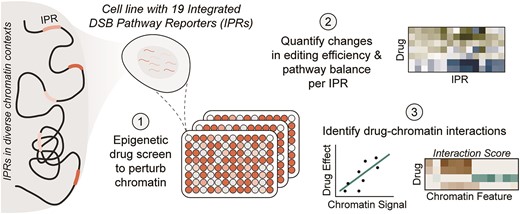
To assess chromatin context-dependent effects of a large set of drugs on Cas9 editing, we developed a screen based on our sequencing-based reporter assay (15). This assay employs a reporter that carries a short sequence that, when it is cut by Cas9, can be repaired by either NHEJ or MMEJ. These repair pathways predominantly produce signature insertions of one nucleotide (+1) or deletions of seven nucleotides (–7), respectively (20). These signature mutations can be used to infer the relative activity of the two pathways (15,20).
We employed a human K562 cell line (clone #5) in which 19 copies of the reporter, each marked by a unique 16-nucleotide barcode, were randomly integrated by PiggyBac transposition (15). We refer to these reporters as integrated pathway reporters (IPRs). Clone #5 also carries a cassette for inducible expression of Cas9 (20). Upon activation of Cas9, accumulation of pathway-specific insertions and deletions (indels) can be determined by high-throughput sequencing. The key advantage of this approach is that the repair outcomes can be monitored in parallel in 19 distinct genomic regions, owing to the unique barcode that marks each IPR.
Importantly, the 19 IPRs are located in highly diverse chromatin environments (15) including transcribed genes and enhancers (euchromatin); H3K27me3-marked heterochromatin; and regions of heterochromatin that interact with the nuclear lamina, replicate late in S-phase, and are marked by H3K9 di- or trimethylation (here referred to as triple heterochromatin (15)) (Figure 1A). There are also four IPRs in a mixed state that cannot be easily attributed to any of the other groups. Importantly, the IPRs are only 640 bp long and generally adopt the chromatin state of their insertion site (15). Thus, they can be used to probe the impact of different chromatin environments on Cas9 editing. As reported (15), the 19 IPRs display reproducible differences in total indel frequency (TIF) and in the relative abundance of MMEJ and NHEJ (MMEJ:NHEJ ratio, calculated as the ratio between the signature indels), which can be attributed to the different chromatin contexts of each IPRs (Figure 1B). Thus, we expected that we should be able to quantitatively detect any effect that a chromatin-modifying drug might have in each of the 19 different contexts (i.e. local effects). Additionally, we can quantify global effects as the average effect across all IPRs.
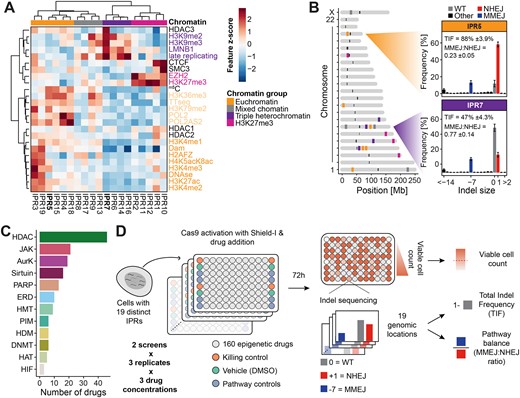
Overview of the reporter system and screen data. (A) Heatmap of the chromatin landscape at the integration sites of the integrated pathway reporters (IPRs) in K562 clone #5 used in this study. Z-scores of 25 chromatin features are indicated for all 19 IPRs. Chromatin features are colored by their type, and IPRs are clustered into chromatin groups based on the chromatin features. IPRs in bold are the two example IPRs depicted in B. Adapted from (15). (B) Left panel: genomic locations of the IPRs, colored by their associated chromatin group. Right panel: indel frequency distributions (in the absence of drug treatment) of two representative IPRs, one in euchromatin (IPR5), and one in heterochromatin (IPR7). (C) Number of drugs per target group in the screen. HDAC = histone deacetylase, JAK = Janus kinase, AurK = aurora kinase, PARP = poly (ADP-ribose) polymerase, ERD = epigenetic reader domain, HMT = histone methyltransferase, PIM = proviral integration site for moloney murine leukemia virus kinase, HDM = histone demethylase, DNMT = DNA methyltransferase, HAT = histone acetyltransferase and HIF = hypoxia inducible factor. (D) Schematic overview of the experimental layout and the readouts of the drug screen.
We assembled a drug library from two commercially available epigenetic drug collections, consisting of 160 drugs in total (Figure 1C, Supplementary Table S1). Among these we included 46 different HDAC inhibitors. Some inhibitors of this class can affect Cas9 editing (33–36), yet HDAC inhibitors greatly vary in their target specificity (e.g. 55). Other tested drugs included inhibitors of Janus kinases (JAK), aurora kinases (AurK), sirtuins, poly (ADP-ribose) polymerase (PARP), epigenetic reader domain-containing proteins (ERD), PIM kinase, histone methyltransferases (HMT), histone acetyltransferases (HAT), DNA methyltransferases (DNMT), histone demethylases (HDM) and hypoxia-inducible factors (HIF). We used a 96-wells automated setup to administer the drug library to clone #5 cells in an arrayed format (Figure 1D). Additionally, 24 separate wells received the vehicle (DMSO solvent) only, serving as negative controls. We also included treatment with mirin (an inhibitor of MMEJ) and NU7441 (an inhibitor of NHEJ) as positive controls. Prior to drug administration, the clone #5 cells were transfected with a single-guide RNA (sgRNA) that targets the IPR sequence, and Cas9 was activated by inhibition of its degron-mediated degradation (38) at the same time as drug administration (Supplementary Figure S1A). 72 h after drug administration we collected genomic DNA and sequenced the IPRs, including their barcode, to quantify the TIF and the MMEJ:NHEJ ratio for each of the 19 IPRs (Figure 1D). We also estimated the number of viable cells in each well to monitor any cytotoxic effects that the drugs might have. We performed this screen twice (with an interval of more than a year), each time in three replicates in which the cells were cultured and transfected separately.
Because the 160 drugs used in this screen have a wide range of effective concentrations and may have concentration-dependent toxic side effects, we tested each drug at three different concentrations (100 nM, 1 μM and 10 μM). We then excluded wells from the analysis that had fewer than 25% viable cells compared to the DMSO-treated control in at least two of the three replicates of either screen. Applying this filter, we removed data for 5, 19 and 48 drugs at 100 nM, 1 μM and 10 μM, respectively (Supplementary Figure S1B–D), while also verifying reproducibility between screens (Supplementary Figure S1B, Supplementary Table S7).
Both the TIF and the MMEJ:NHEJ ratio of the vehicle control samples were highly reproducible between the two screens across the 19 IPRs (Supplementary Figure S1E–G). The variation observed in TIF and MMEJ:NHEJ ratio effect size between replicates was likely due to differences in sgRNA transfection efficiency. As previously observed (15), IPRs in euchromatin typically displayed a higher TIF and a lower MMEJ:NHEJ ratio compared to heterochromatic IPRs (Supplementary Figure S1F-G). For downstream statistical analysis we then converted the drug-induced changes in TIF and MMEJ:NHEJ ratio for each IPR to z-scores, using the 24 vehicle control samples per replicate to estimate null distributions (Supplementary Figure S1H, I). The drug-induced changes in TIF were highly reproducible across all replicates and between screens (Supplementary Figure S1J). Changes in MMEJ:NHEJ ratio varied more, potentially due to intrinsic higher variation, as observed in the control condition (Supplementary Figure S1K, S1G). However, after combining the three replicates of each screen, the local (Supplementary Figure S1L, M) and global (Supplementary Figure S1N-O) significant z-scores for both the TIF and MMEJ:NHEJ ratio correlated strongly between the two screens. We conclude that the results of the screens are sufficiently reproducible, and we therefore combined the z-scores of all replicates into one final z-score for each drug-IPR combination, separately for the TIF and MMEJ:NHEJ scores (see Materials and methods).
Chromatin-perturbing drugs affecting editing efficiency
We first set out to identify the drugs that induced changes in TIF globally, i.e. on average across all 19 IPRs. In total, 15 (14 increased | 1 decreased), 11 (6|5), and 15 (10|5) drugs significantly changed the TIF globally at 100 nM, 1 μM and 10 μM, respectively (Padj. < 0.01) (Figure 2A). Some drugs globally changed TIF across multiple concentrations (e.g. vorinostat at 100 nM and 1 μM). Among the 34 drugs that have a significant global effect at one or more concentrations, 14 are HDAC inhibitors, which is a significant enrichment (Fisher's exact test Padj. = 0.01) (Figure 2B). These 14 HDAC inhibitors all caused a global increase in TIF, although several showed a quantitative dependency on chromatin context (discussed below). Of previously reported HDAC inhibitors (33,35), our screen detected PCI-24781 as one of the strongest hits and trichostatin A showed a weaker effect. Our findings indicate that many different HDAC inhibitors, most of which have not been reported before, are capable of increasing genome editing efficiencies.
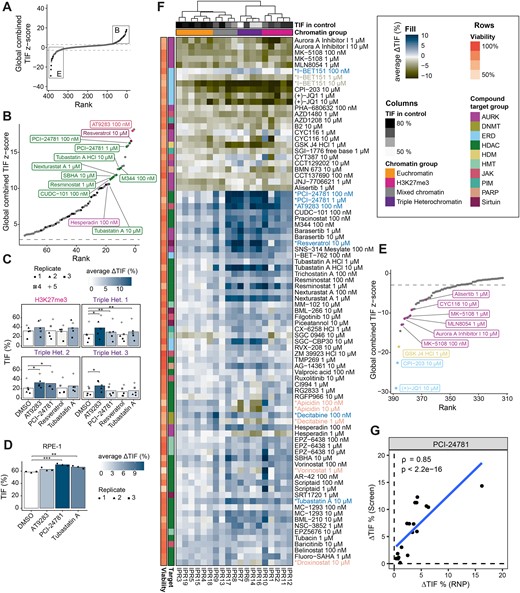
Drugs with strongest effects on TIF. (A) Global (average across all IPRs) change in TIF, ranked from highest increase to strongest decrease. Top and bottom 75 hits are highlighted in panels B and C, respectively. Black dots are samples with a significant global effect (Padj.< 0.01) in both screen replicates, grey dots are non-significant or only significant in one replicate. (B) Overview of the 75 strongest TIF-increasing drugs passing the viable cell count filter. The top 10 significant and reproducible hits are annotated and colored based on their target. Color code in F. (C) Effect of the strongest TIF-increasing drugs in additional heterochromatic loci. Displayed is the TIF of four different heterochromatic genomic loci (one H3K27me3-marked locus and three triple heterochromatin loci) treated with either vehicle, AT9283 (100 nM), PCI-24781 (100 nM), resveratrol (10 μM), or tubastatin A (10 μM). The color gradient indicates the average ΔTIF in percent. Symbols represent the different replicates, and the bar indicates the average TIF. TIFs were compared between DMSO-treated and drug-treated samples using paired t-tests, * indicates p < 0.05, ** P < 0.01. (D) TIF (average across IPRs) of RPE-1 cells treated with DMSO, AT9283 (100 nM), PCI-24781 (100 nM), or tubastatin A (10 μM). TIFs were compared between DMSO-treated and drug-treated samples using unpaired t-tests, ** P < 0.01, ***P < 0.001. (E) Strongest TIF-reducing drugs, included are only drugs with >70% relative viable cell count. (F) Heatmap of the local ΔTIF per IPR of all drugs significantly affecting at least one IPR (Padj.< 0.01). The rows are annotated with the relative viable cell count and drug target. The column annotation contains the chromatin domain and TIF in the control. The rows were clustered based on the average effect across all concentrations of the drug. Drugs discussed in the text that increase, decrease, or with mixed effects on TIF are highlighted in blue, green or orange, respectively. (G) Correlation between PCI-24781 (100 nM) TIF changes across all 19 IPRs in clone #5 in the screen and using Cas9 RNP delivery. Spearman's correlation coefficient (ρ) and P-value (P) are indicated in the figure.
Besides HDAC inhibitors, several other drugs, for which the potential to increase editing efficiency has not been reported before, globally enhanced TIF. Among the strongest hits are resveratrol (a sirtuin inhibitor), AT9283 (an inhibitor of both JAK2/3 and Aurora kinases) and hesperadin (another Aurora kinase inhibitor). These data suggest that a diversity of chromatin-modifying drugs may be used to improve CRISPR editing. However, we note that in this screen the absolute increases in TIF are generally modest. In part, this may be due to the high baseline TIF in vehicle-treated cells, which ranged from ∼50 to 80%. Hence, increases in TIF were not expected to exceed between 20 and 50%, depending on the IPR.
We further examined the effects of four of the strongest TIF-increasing drugs (AT9283, resveratrol, PCI-24781, tubastatin A) in four native genomic sequences (i.e. outside the 19 IPRs) in heterochromatic loci (Supplementary Figure S2A). Heterochromatic loci are generally hard to edit, and treatment with the identified TIF-increasing drugs could provide a simple strategy to increase desired editing outcomes. We used TIDE (43) to determine indel spectra and to estimate the changes in TIF upon drug treatment. AT9283 significantly increased TIF in all three triple heterochromatic loci (on average from 13.6% (LAD10), 21.1% (LAD7), and 24.6% (LAD2) to 26.2% (1.9-fold increase), 32.3% (1.6-fold), and 38.5% (1.6-fold), respectively), and also showed the strongest increase in the H3K27me3-marked locus among the tested drugs (from 31.7% to 39.1% (1.2-fold), Figure 2C). PCI-24781 and tubastatin A had more modest effects that were significant in a subset of the four loci, while resveratrol did not cause an increase in TIF in any locus (Figures 2C, Supplementary Figure S2B).
To test whether the most potent TIF-increasing drugs also increase TIF in another cell type than K562, we generated a pool of retinal pigment epithelial RPE-1 cells with randomly integrated barcoded IPRs, of which 15 could be reliably measured (see Methods). We treated this cell pool with AT9283, PCI-24781, and tubastatin A, and measured the average Cas9-induced editing of the IPRs as before. PCI-24781 and tubastatin A significantly increased TIF in the RPE-1 cells, with PCI-24781 having the strongest effect size (global TIF increase from 58% to 70% (1.2-fold), Figure 2D). These results confirm that the drugs identified here can work across different cell types, although the effect sizes may vary from cell type to cell type.
We further explored whether PCI-24781 already increases TIF at lower concentrations as it has an inhibition constant of 7 nM for HDAC1 (56). We found that PCI-24781 increases TIF only at 33 nM or higher (Supplementary Figure S2C), which match the concentrations at which PCI-24781 increases histone acetylation in cells (56). This suggests that PCI-24781 most likely increases TIF through primary mechanisms. Nevertheless, we cannot rule out that other drugs that were shown to increase TIF in this study act through secondary mechanisms.
For the strongest TIF-decreasing drugs, we observed that decreases in TIF generally correlate with reduced viable cell counts (Pearson's R = 0.63, P < 2.2 × 10⁻¹⁶) (Supplementary Figure S1B, S2D). To limit this potentially confounding factor we increased the viable cell count threshold from 25% to 70% for compounds that showed decreased TIF (Pearson's R = –0.0062, P = 0.9) (Supplementary Figure S2E). Among the drugs that pass this more stringent filter, we found mainly Aurora kinase inhibitors (n = 5), all targeting Aurora kinase A. Aurora kinase A has a role in cell cycle regulation as well as DSB repair (57,58). Both mechanisms could explain the observed phenotype. Besides Aurora kinase A inhibitors, two BRD4 inhibitors caused the strongest global decrease in TIF (Figures 2E, Supplementary Figure S2E). BRD4 inhibitor-mediated decreases in TIF might be attributed to a global decrease in transcription output, which may also result in reduced expression levels of Cas9 (e.g. (59)); or effects on histone eviction (60); or a role of BRD4 in DNA repair (61,62). Drugs that reduce TIF could provide insight into the determinants of TIF and might be further explored to decrease editing efficiency at off-target sites, although choosing a high-fidelity CRISPR nuclease variant or a more specific sgRNA is generally preferred.
We then investigated the chromatin context-dependent effects of the drugs on the IPRs, which revealed several notable patterns. First, the efficiency of editing of the IPRs was generally highest in euchromatin and more variable in heterochromatin (Figure 2F, top row). Second, we observed that many drugs showed complex and IPR-specific changes in TIF, suggesting that drugs interact with the chromatin context in a specific manner. Interestingly, drugs that target the same class of epigenetic regulator (e.g. HDAC inhibitors) often showed similar IPR-specific patterns and clustered together, which is suggesting chromatin-dependencies of these target proteins. Moreover, several drugs showed concentration-dependent effects, with the higher concentrations often leading to a stronger decrease in TIF along with lower cell count (e.g. I-BET-151). These changes can also be chromatin-dependent; e.g. the DNA methyltransferase inhibitor decitabine increases TIF globally at 100 nM but has a mixed effect at 1 μM where it decreases the TIF in triple heterochromatin and increases it in euchromatin (Figure 2F). This mixed effect was also present for three HDAC inhibitors: apicidin, vorinostat and droxinostat (Figure 2F, drugs highlighted in orange). Together, this shows that the effect of chromatin-modifying drugs can be chromatin context-dependent.
TIF-increasing drugs display a diversity of chromatin context-dependencies
We reasoned that the drugs might also increase TIF by altering Cas9 expression levels in clone #5 rather than modifying the chromatin state of the IPRs. Therefore, we repeated the experiments in clone #5 with PCI-24781, AT9283 and tubastatin A using Cas9 ribonucleoprotein (RNP) delivery instead of relying on the Cas9 driven by the integrated expression cassette. We first confirmed that the editing efficiencies upon RNP delivery were higher in euchromatin compared to heterochromatin, reaching almost 100% TIF in some euchromatic IPRs (Supplementary Figure S2F). All three tested drugs increased TIF across most IPRs in the RNP experiment (Figures 2G, Supplementary Figure S2G). However, the changes were more modest compared to the increases with the endogenous Cas9, possibly due to a higher baseline TIF leading to a saturation effect. The drug with the strongest TIF increases in the RNP experiment (PCI-24781) showed highly conserved IPR-specific TIF increases independently of the Cas9 delivery method used (Spearman's ρ = 0.85, P = 2.2 × 10⁻¹⁶, Figure 2G). This indicates that PCI-24781, and potentially more of the identified drugs in here, increase TIF in a chromatin-dependent manner, regardless of the Cas9/sgRNA delivery method.
Visual inspection of Figure 2F suggested that many of the tested drugs have quantitatively different effects across the 19 IPRs. We applied a statistical framework to systematically identify such chromatin context-dependencies (CCDs) of the drug effects on TIF, taking advantage of the fact that for each IPR location the local levels of 25 different chromatin features are known (Figure 1A). Our aim was to first identify the drugs with statistically significant dependency on the overall chromatin composition, and then to identify the individual chromatin features that may explain these dependencies (see Methods) (50). For the first step we used principal component regression. This approach was taken because many chromatin features co-variate, necessitating a dimension reduction approach. This yielded 41 drugs and 56 drug-concentration combinations with significant CCDs (Supplementary Table S9). For each of these drug-concentration combinations we then fitted the log2-fold changes in the TIFratio to each of the 25 chromatin features by standard linear modelling. The slopes of these linear fits provide a measure of the degree to which each chromatin feature can explain the magnitude of the drug effect (Figure 3A–C). We focused on chromatin features with positive slopes, which are candidates to enhance the TIF-increasing effects of a drug (Figure 3A). A total of 22 drugs (28 drug-concentration combinations) exhibited such positive slopes (Figure 3D).
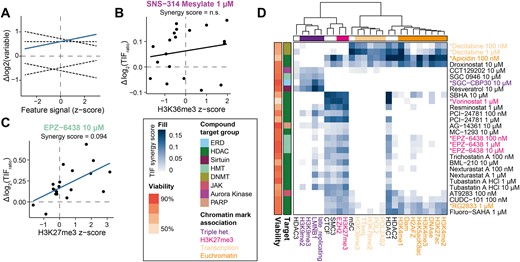
Chromatin context-dependent (CCD) effects for drugs affecting TIF. (A) Example of linear regression analysis of drug effect-chromatin feature synergies. Blue line (significant positive slope) illustrates a positive synergy of a drug with a specific chromatin feature, where at least one IPR has a significant increase in TIF. Dashed black lines illustrate no synergy, a negative synergy or a positive synergy but no increase in TIF. (B) Example of absence of synergy: the treatment with SNS-314 Mesylate has no synergy with H3K36me3. (C) Example of a positive synergy between the Δlog2(TIFratio) after EPZ-6438 treatment and the H3K27me3 chromatin feature. The indicated synergy score represents the slope of the linear model. (D) Heatmap of all the significant positive CCDs. Drugs are annotated by colors based on their protein target and viability (colored bars to the left of the heatmap). Drugs indicated in the text are highlighted by color and asterisk. Chromatin features are color-coded based on their association with chromatin states.
A striking and readily interpretable example of such a positive CCD is EPZ-6438, an inhibitor of the H3K27 methyltransferase EZH2 (Figure 3C). Although this drug enhances TIF at all 19 IPRs (Figure 2F), it preferentially enhances TIF in regions rich in H3K27me3 and EZH2 binding. This is the case for all three tested concentrations (Figure 3D). EPZ-6438 also shows a synergy with regions bound by CTCF or the cohesion subunit SMC3. CTCF and SMC3 have been reported to partially overlap with H3K27me3-marked domains (63,64) and indeed the two IPRs in clone #5 with high CTCF and SMC3 scores overlap with H3K27me3 (Figure 1A). Therefore, this CCD should be interpreted with caution. We suggest that depletion of H3K27me3 by EPZ-6438 facilitates access of Cas9 by locally relaxing the heterochromatic state.
Besides EPZ-6438, several other drugs displayed positive synergies with a set of chromatin features, as can be explored in Figure 3D. Most drugs had significant interactions with H3K27me3 and EZH2, similar to the phenotype observed for EPZ-6438 (e.g. vorinostat; highlighted in pink). Some drugs also displayed synergies with euchromatic features in addition to H3K27me3-synergies (e.g. RG2833, apicidin; highlighted in orange). Moreover, some drugs had positive synergies with only triple heterochromatic features (e.g. SGC-CBP30; highlighted in purple) and one drug (decitabine; highlighted in yellow) had significant interactions only with chromatin marks associated with transcription and euchromatin.
Interestingly, we found that besides the EZH2 inhibitor EPZ-6438 primarily HDAC inhibitors showed positive synergies with H3K27me3 (Figure 4A). This may be related to the mutual exclusivity of H3K27me3 and H3K27ac (65). These HDAC inhibitors could be generally divided into two groups based on their CCD patterns. Some HDAC inhibitors (e.g. PCI-24781, tubastatin A) showed prominent synergy only with heterochromatic marks (H3K27me3-marked and triple heterochromatin). Others (e.g. apicidin, droxinostat, RG2833) enhanced TIF preferentially in regions marked with euchromatic/transcription and H3K27me3 features, but not in triple heterochromatic regions (Figure 4B). Since HDAC inhibitors target HDAC proteins with varying specificities, we wondered whether the observed chromatin dependencies may be explained by HDAC protein specificities. However, a survey of previously characterized HDAC specificities (55) (Figure 4B) did not uncover any obvious link between the specificity of the HDAC inhibitor and the context-dependencies of the TIF effects (Figure 4B). As may be expected, most HDAC inhibitors were more effective in regions bound by HDAC1 (Figure 4B). Nevertheless, as most HDAC inhibitors target multiple HDACs, including ones for which no genome-wide binding maps are available, it is challenging to directly link the observed chromatin synergies to the target proteins of the HDAC inhibitors and their potential underlying mechanisms.
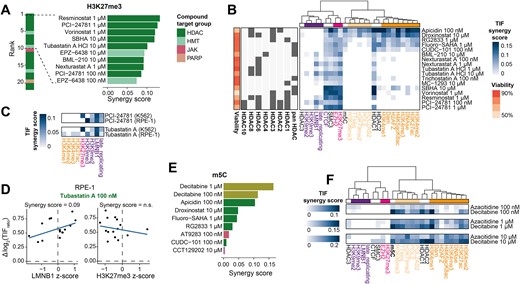
Chromatin context-dependency analysis reveals drugs increasing TIF in specific contexts. (A) Highest positive synergies with H3K27me3, highlighting the top ten drugs with significant interactions. (B) Heatmap of all the significant synergies of HDAC inhibitors with the 25 chromatin features. Row annotation includes relative viable cell count and the HDAC targets for each drug as reported by the manufacturer (SelleckChem). Pan HDAC are general HDAC inhibitors without specific targets, additional HDAC annotations indicate the main targets. Chromatin marks are color-coded as in Figure 3D. (C) Overview of TIF synergy scores of PCI-24781 (100 nM) and tubastatin A (10 μM) in K562 and RPE-1 cells. Only chromatin marks for which data for both cell types were available are shown. (D) Example of the synergy between tubastatin A-induced changes in TIF and a chromatin feature in RPE-1 cells. Shown is the correlation between Δlog2(TIF) and the LMNB1 z-score (left) or H3K27me3 score (right). (E) Same as in A but for m5C, showing all significant positive synergies. (F) All significant synergy scores for the two DNMT inhibitors at 100 nM, 1 μM or 10 μM. Positive slopes of TIF decreases that are typically removed (Figure 3A) are shown here.
Despite these challenges, we sought to gain mechanistic understanding of the HDAC inhibitor-induced chromatin-dependent TIF changes. Therefore, we probed the chromatin marks H3K27ac and H3K27me3 by chromatin immunoprecipitation followed by sequencing (ChIP-seq) upon PCI-24781 or tubastatin A treatment in clone #5. PCI-24781 and tubastatin A both substantially increased H3K27ac levels across the genome, with PCI-24781 affecting approximately four times more loci than tubastatin A (Supplementary Figure S3B, C). These differences between the drugs mirror their potential to increase TIF (Figure 2B, F). We then examined the H3K27ac and H3K27me3 levels flanking the integration sites of the 19 IPRs. We identified an H3K27ac peak with increased signal upon PCI-24781 treatment close to the integration site of IPR10 (∼7.5 kb distance; Supplementary Figure S3D), which is also the IPR with the strongest TIF increase upon PCI-24781 treatment (Figure 2F). This local PCI-24781-induced gain in H3K27 acetylation levels may cause the strong increase in TIF of IPR10 through an increased Cas9 accessibility at this locus. However, we did not find any significantly increased peaks in the vicinity of any other IPRs. Furthermore, the H3K27ac and H3K27me3 levels in the 2 kb region surrounding the integration sites were mostly unchanged and did not correlate with the observed changes in TIF (Supplementary Figure S3E, F). Possibly, the TIF increases by PCI-24781 and tubastatin A are caused by interactions with other unprobed chromatin marks or through more complex or distant H3K27ac or H3K27me3 changes. It is also plausible that the drugs act on other factors such as proteins involved in the DNA repair response. The mechanisms underlying the TIF increases of other drugs than the two investigated here may be drug-specific, given that many of the identified drugs have distinct targets.
We then asked whether the two HDAC inhibitors that we also tested in RPE-1 cells (PCI-24781 and tubastatin A) displayed similar CCDs as observed in K562 cells. Therefore, we repeated the CCD analysis on the drug-induced TIF changes observed in RPE-1. For this analysis we used publicly available chromatin tracks and generated tracks for three additional chromatin marks, totaling a collection of 10 different RPE-1 chromatin features. The CCD analysis showed that both drugs displayed comparable CCDs in the two cell types with some subtle differences (Figure 4C). In both cell types, PCI-24781 and tubastatin A had positive synergies with triple heterochromatic marks like LMNB1 (Figure 4C, D). However, a positive synergy with H3K27me3 was only observed in K562, which can be attributed to the lack of H3K27me3 signal of the IPRs in RPE-1 (Figure 4C, Supplementary Figure S3A). Furthermore, tubastatin A displayed subtle synergies with euchromatic marks in RPE-1, but not in K562.
Another notable finding is that the DNA methyltransferase inhibitor decitabine was the drug with the strongest synergy with 5-methylcytosine (m5C) (Figure 4E, Supplementary Figure S3G). It is possible that m5C impedes interactions of Cas9 with its target sequence, and that decitabine alleviates this effect by removal of m5C. Indeed, some studies found reduced Cas9 editing efficiency in m5C marked sequences (5,13,16) but other reports concluded that m5C does not impede Cas9 binding and cleavage (66,67). We note that the preferential effect of decitabine and another DNA methyltransferase inhibitor azacitidine is not restricted to m5C-marked regions, but also correlates with multiple euchromatic features (Figures 3D, 4F). Visual inspection of Figure 2F confirms that the two DNA methyltransferase inhibitors are among the drugs with the strongest TIF-increasing effect at euchromatic IPRs. Together, these results reveal significant differences in the activities of epigenetic drugs in distinct chromatin contexts.
Effects of epigenetic drugs on MMEJ:NHEJ ratio
We then analyzed how drugs affect the DNA repair pathway balance. Besides the NHEJ inhibitor NU7441, only four drugs significantly increased the MMEJ:NHEJ ratio globally (Figures 5A, Supplementary Figure S4A, Supplementary Table S10). These included two formulations of the PARP-1 inhibitor PJ34 as well as the JAK and Aurora kinase inhibitor AT9283 and the Aurora kinase B inhibitor barasertib.

Various drugs are potent inhibitors of MMEJ. (A) Rank dot-plot of the drugs ranked on their global MMEJ:NHEJ ratio z-score. Black dots are samples with a significant global effect in both screens, grey dots are non-significant or only significant in one screen. Top 5 hits increasing the MMEJ:NHEJ ratio globally are highlighted. Dashed lines indicate significance threshold of Padj < 0.01. (B) Zoom in of A, the bottom 10 hits are highlighted (C) TIDE results of cells treated with decitabine. The shapes represent the different replicates, the mean is indicated by the bar. Asterisks denote p-values based on Benjamini–Hochberg adjusted t-tests, * Padj < 0.05, ** Padj < 0.01. (D) Heatmap of the top 60 drugs altering the MMEJ:NHEJ ratio. Drugs discussed in the text are highlighted by color. (E) Heatmap showing all significant chromatin interactions with the MMEJ:NHEJ ratio fold change (FC). Drugs discussed in the text are highlighted by color. (F) Heatmap of the chromatin interactions with the MMEJ:NHEJ ratio FC upon vorinostat treatment in clone #5 and the IPR pool. (G) Scatter plot demonstrating the synergy between the vorinostat-induced MMEJ:NHEJ ratio change and the H3K27me3 z-score in the single IPR clone and the complete IPR pool. Transparent dots show IPRs of the pool, dots with black stroke show IPRs of the clone. Linear fit is shown as black line with slope and R2 above. Denoted below the fit are Pearson's R and correlation significance.
In contrast, 58 drugs (95 drug-concentration combinations) caused a globally decreased MMEJ:NHEJ ratio (Figure 5B, Supplementary Table S10). Mirin, an inhibitor of MRE11, was used as positive control for the decrease of MMEJ but had only little effect and was not reproduced in all replicates. The large number of drugs decreasing the MMEJ:NHEJ ratio suggests that the NHEJ repair pathway is much more robust than the MMEJ pathway. Because the activity of MMEJ is known to be regulated during the cell cycle and requires passage through mitosis (68,69), we investigated the cell cycle profile for 28 drug-concentration combinations with a significant effect on the MMEJ:NHEJ ratio. While most of the Aurora kinase inhibitors induced a considerable G2 arrest, most drugs targeting other proteins did not substantially alter cell cycle profiles (Supplementary Figure S4B). For these drugs it is likely that the MMEJ:NHEJ ratio is affected through other mechanisms. We hypothesize that MMEJ is more easily perturbed because it is a more complex repair pathway that relies on the resection machinery (21,50,70,71).
Among the drugs with the strongest reduction in the MMEJ:NHEJ ratio were decitabine and azacitidine (Figure 5B). These drugs almost completely blocked MMEJ in all IPRs. Decitabine and azacitidine are cytidine analogues that are incorporated into DNA upon replication and then covalently trap DNA methyltransferase on the DNA (72). We wondered whether this may interfere with resection or DNA synthesis, which are key steps of MMEJ. We therefore investigated whether decitabine could inhibit another resection-dependent pathway, single-strand template repair (SSTR). We tested this by conducting Cas9 editing of the LBR gene in the presence of a single-stranded oligonucleotide template that directs a specific 2 bp insertion (15). We used TIDE (43) to quantify the resulting indel pattern. According to this assay the activities of both MMEJ and SSTR, but not of NHEJ, were significantly reduced in decitabine-treated cells (Figure 5C). This result suggests that decitabine selectively blocks resection-mediated repair, although it does not identify the affected step of this process.
Visual inspection of the changes of MMEJ:NHEJ balance per IPR (Figure 5D) suggested that the changes in MMEJ:NHEJ balance triggered by various drugs may not be uniform across the different chromatin contexts. We therefore subjected the changes in MMEJ:NHEJ ratio to a similar analysis of CCD as described above for TIF changes, except that we now searched for chromatin features that correlate with either increased or decreased MMEJ:NHEJ ratios (Figure 5E). This yielded 43 drugs (65 drug-concentration combinations) with significant CCDs in addition to DNA-PKcs inhibition with NU7441. Strikingly, all these drugs, except for NU7441, preferentially reduce the MMEJ:NHEJ ratio in regions marked by H3K27me3. Many of these are also more effective in the IPRs with higher levels of EZH2, CTCF and SMC3, and HDAC1. This suggests that the MMEJ:NHEJ pathway balance in these regions is easily shifted by a broad variety of perturbations. Among the drugs synergizing with H3K27me3, Aurora kinase inhibitors are enriched (Fisher's exact test Padj. = 6.93 × 10⁻⁴), however their general effect on DNA repair and the cell cycle might be a confounding factor. Additionally, many HDAC inhibitors showed the strongest synergistic effect with H3K27me3 (Supplementary Figure S4C). Interestingly, HDAC inhibitors typically reduced the MMEJ:NHEJ ratio less efficiently in euchromatic regions compared to other effective drugs (Supplementary Figure S4D). Again, this H3K27me3-specific phenotype of HDAC inhibitors might be related to the mutual exclusivity of H3K27me3 and H3K27ac (65). Besides H3K27me3, some drugs showed an additional preference for euchromatic regions rich in regulatory elements, but not in transcribed regions. These drugs included decitabine at lower concentrations (100 nM and 1 μM) and azacitidine, but also a diversity of other drugs with no obvious commonality. Six drug-concentration combinations preferentially reduced the MMEJ:NHEJ ratio in triple heterochromatin (Figure 5E), but again without an obvious pattern in their target specificities.
Although the 19 IPRs in clone #5 covered all major chromatin features, we considered the possibility that they were not fully representative of the genome-wide diversity of chromatin states. This could confound the interpretation of our data. To test whether the results of the 19 IPRs could be generalized to other genomic regions, we employed a previously established polyclonal pool of K562 cells with 675 randomly integrated IPRs, with on average 6.8 IPRs per cell (15). We treated this cell pool with 1 μM vorinostat, an HDAC inhibitor with local MMEJ:NHEJ ratio changes (Figure 5E), and determined the MMEJ:NHEJ ratio in each IPR. Interestingly, we found a correlation between the H3K27me3 and EZH2 scores and the vorinostat-induced changes in MMEJ:NHEJ ratios as observed with clone #5 (Figure 5F, G). The correlations with SMC3 and CTCF, however, could not be observed in the pool. This demonstrates that the synergy of SMC3/CTCF observed in clone #5 is likely caused by coincidental co-occurrence with H3K27me3 and that the true causal feature is H3K27me3. Based on these results we conclude that DSBs in H3K27me3-rich chromatin are susceptible to changes in the MMEJ:NHEJ pathway balance as previously reported (15).
Discussion
The screen presented here provides new information on how drugs alter Cas9 editing efficiency and DNA repair outcomes. In addition to the broad range of drugs and concentrations tested here, a particularly novel aspect of our study is the systematic analysis of the interplay between the drugs and the local chromatin context. For this, we leveraged our multiplexed IPR methodology, in combination with a novel statistical framework to interpret the rich dataset. We recently also applied this CCD analysis to study the dependency of a large number of DNA repair proteins on the local chromatin context (50).
Our results reveal in detail how the effects of many drugs on Cas9 editing efficiency and the repair pathway balance are dependent on the local chromatin context. For example, while the two HDAC inhibitors PCI-24781 and apicidin both on average increase TIF, they do not work efficiently in the same chromatin contexts: PCI-24781 increases TIF in H3K27me3-marked regions and in triple heterochromatin, whereas apicidin increases TIF in euchromatin and H3K27me3-marked chromatin, but decreases TIF in triple heterochromatin. These distinctions may aid researchers in choosing drugs that work best to optimize Cas9 editing of their genomic locus of interest. It is likely that drugs that increase TIF in specific regions are preferable to use over drugs that increase TIF globally, as the latter could potentially increase off-target editing.
Increased editing efficiencies can also be achieved by optimizing the selection of the CRISPR nuclease variant and sgRNA and their respective delivery strategies into cells. However, when this is not feasible or already optimized, the addition of the here identified drugs provide a simple strategy to increase desired editing outcomes. This is particularly true in heterochromatic loci where achieving high editing efficiencies is inherently challenging.
Some of our observations would be worth further exploration. For example, we found that Aurora kinase inhibitors have strikingly diverse effects: Aurora kinase B inhibitors such as hesperadin and barasertib increase TIF (Figures 2B, F) and shift the balance towards MMEJ (Figures 5A, Supplementary Figure S4A), while Aurora kinase A inhibitors such as Aurora A Inhibitor, MK-5108 and SNS-314 Mesylate had the opposite effect (Figures 2E, F, 5B, D). Whether this reflects direct or indirect effects is unclear, but both kinases are involved in DNA repair and cell cycle progression (58). This result could be confounded by the relative selectivity of these drugs for Aurora kinase A and/or Aurora kinase B as many drugs target both kinases at different concentrations. We also found that many Aurora kinase inhibitors had a stronger effect on the repair pathway balance in the presence of H3K27me3. It is possible that Aurora kinases are involved in the repair signaling of DSBs occurring in H3K27me3 regions.
We note that we can only measure the balance between MMEJ and NHEJ, but not the absolute activities of the individual pathways (15). Nevertheless, it seems likely that the drugs that caused a strong reduction of the MMEJ:NHEJ balance act by interfering with MMEJ rather than by enhancing NHEJ. It is interesting that this effect occurs preferentially in H3K27me3-marked regions. We also found that decitabine is a strong inhibitor of SSTR and MMEJ, which are two resection-dependent repair pathways. Decitabine and other potent inhibitors of MMEJ identified in this study might be useful as a research tool to further elucidate DSB repair pathways, or in combination with NHEJ inhibitors to explore synthetic lethality.
We acknowledge that this study has a few limitations. First, the effects on TIF that we observed were modest for most drugs, which is consistent with other drug studies of more limited scope (33,35). The modest effects are at least in part due to the very high baseline editing efficiency of the IPRs, leading to near-saturation of the TIFs in accessible regions and leaving little room for increases (15). Confirming this, we observed less pronounced TIF increases in the RNP experiment where baseline TIF was even higher (Figure 2G), and, conversely, stronger TIF increases when probing genomic triple heterochromatin loci with lower baseline TIFs (Figure 2C; AT2983 could enhance TIF up to 1.9-fold). It is possible that the editing efficiency of other heterochromatic loci is even more enhanced by AT9283 or some of the other identified drugs, which would be valuable for studies of such difficult-to-edit sequences. This will require further testing and optimization. We also note that the described near-saturation of the TIFs might act as a confounding factor throughout this study, both by underestimating the effect-sizes of drugs and interfering with the interpretation of the synergistic effects. To mitigate the latter, we used a mathematically unrestricted TIFratio measure. However, we note that this measure could still be affected by the near-saturation of the TIFs.
Another noteworthy limitation is that the mechanisms by which the drugs that we identified alter TIF or repair pathway balance remain unclear. Many epigenetic drugs have multiple target proteins (e.g. HDAC inhibitors are usually not specific for a single HDAC, see Figure 4B), and their effects on Cas9 cutting or the repair process may also be indirect due to the duration of exposure to the drugs. As such, some drugs may not change TIF or pathway balance by changing the chromatin landscape, but rather by other effects such as perturbing proteins involved in the DNA repair response. However, for practical applications (i.e. improving genome editing efficiency), it may not be essential to understand the underlying mechanism in detail, provided that the drug effects on the treated cells do not permanently change the cells themselves.
It is plausible that some of the identified drugs could potentially also increase TIF by increasing expression levels of endogenous Cas9 cassette or of the sgRNA delivered by plasmid. However, because we validated that PCI-24781 also increases TIF when Cas9 and sgRNA were delivered as ribonucleoprotein, we suggest that the drugs rather increase TIF by altering the chromatin states or affecting the repair process locally around the break sites. We note that an increase in Cas9/sgRNA expression would also likely result in similar TIF increase patterns across the tested IPRs, and not the nuanced chromatin- and drug-specific patterns that we observed. Since the activity of DNA repair proteins varies per chromatin context (50), the observed chromatin-dependent changes here could also be explained by perturbation of DNA repair proteins rather than chromatin proteins. Nevertheless, we suggest that the efficacy of the identified drugs should be validated when using other Cas9/sgRNA delivery methods than the one used in the screen here.
Data availability
Laboratory notebooks and supplementary data are available on Zenodo (https://doi.org/10.5281/zenodo.11103909). Raw sequencing data is available on Sequence Read Archive under BioProject number PRJNA960840. Generated pA-DamID and ChIP-seq data can be found at the Gene Expression Omnibus under accession number GSE248980. Code and supplementary files used as input for the scripts are available on Zenodo (https://doi.org/10.5281/zenodo.11103982).
Supplementary data
Supplementary Data are available at NAR Online.
Acknowledgements
We thank the NKI Genomics, High Throughput Screening, Flow Cytometry, and Research High Performance Computing core facilities for excellent support, and members from our laboratories for inspiring and helpful discussions.
Author contributions: Conceptualization: R.S., M.T., B.v.S.; Data Curation: R.S., M.T., X.V.; Formal Analysis: R.S., M.T., X.V.; Investigation: R.S., M.T., X.V., B.M.; Methodology: R.S., M.T., B.M., X.V., A.F., S.G., B.v.S.; Software: R.S., M.T., X.V., S.G., B.M.; Visualization: R.S., M.T., X.V., S.G.; Resources: A.F., R.L.B., S.G.M.; Writing – Original Draft Preparation: R.S., M.T., B.v.S.; Writing – Review & Editing: R.S., M.T., X.V., B.v.S.; Project Administration: W.Z., R.L.B., R.H.M., B.v.S.; Funding Acquisition: B.v.S.; Supervision: B.v.S.
Funding
ZonMW TOP [91 215 067]; European Research Council (ERC) Advanced Grant GoCADiSC [694466]; Oncode Institute is partly supported by KWF Dutch Cancer Society; S.G.M. is funded by EU/MUR MSCA Young Researcher Fellowship (Next Generation EU). Funding for open access charge: European Research Council (ERC) Advanced Grant GoCADiSC [694466].
Conflict of interest statement. None declared.
Notes
Present address: department of Biosciences, University of Milan “La Statale”, 20133 Milan, Italy
References
Author notes
The first three authors should be regarded as Joint First Authors.

Comments