


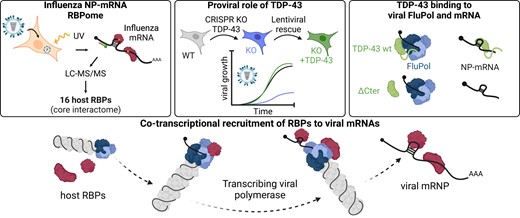
Abstract
Genome-wide approaches have significantly advanced our knowledge of the repertoire of RNA-binding proteins (RBPs) that associate with cellular polyadenylated mRNAs within eukaryotic cells. Recent studies focusing on the RBP interactomes of viral mRNAs, notably SARS-Cov-2, have revealed both similarities and differences between the RBP profiles of viral and cellular mRNAs. However, the RBPome of influenza virus mRNAs remains unexplored. Herein, we identify RBPs that associate with the viral mRNA encoding the nucleoprotein (NP) of an influenza A virus. Focusing on TDP-43, we show that it binds several influenza mRNAs beyond the NP-mRNA, and that its depletion results in lower levels of viral mRNAs and proteins within infected cells, and a decreased yield of infectious viral particles. We provide evidence that the viral polymerase recruits TDP-43 onto viral mRNAs through a direct interaction with the disordered C-terminal domain of TDP-43. Notably, other RBPs found to be associated with influenza virus mRNAs also interact with the viral polymerase, which points to a role of the polymerase in orchestrating the assembly of viral messenger ribonucleoproteins.
Introduction
Influenza A viruses (IAVs) are major human and animal pathogens (1). Infectious virions contain eight viral RNA (vRNA) segments of negative polarity, which together encode 10 major and several auxiliary viral proteins. Each vRNA is encapsidated with the nucleoprotein (NP) and one copy of the viral RNA-dependent-RNA polymerase (FluPol), to form macromolecular complexes called viral ribonucleoproteins (vRNPs). Unlike most RNA viruses, IAVs transcribe and replicate their genome in the nucleus of the host cell. The FluPol transcribes mRNA from vRNA templates, and performs genome replication by the synthesis of complementary full-length RNAs (cRNAs) which in turn serve as a template for the synthesis of vRNAs (2,3). A subset of viral mRNAs are exported to the cytoplasm via the NXF1–NXT1 pathway to be translated into proteins by the host cell translation machinery (4). However, for some transcripts, notably the early unspliced viral mRNAs, the mechanisms for nuclear export remain unclear (5). Newly synthesised vRNP components are re-imported into the host cell nucleus and are assembled together with replicated genomic vRNAs into de novo vRNPs. Late during infection, vRNPs are exported out of the nucleus via the CRM1 export pathway, transported to the plasma membrane and incorporated into progeny virions.
Influenza mRNAs are 5′-capped and 3′-polyadenylated, like cellular mRNAs. However, they are synthesised by the FluPol through a very particular process. Initiation of viral mRNA trancription occurs via a mechanism known as ‘cap-snatching’ whereby the capped 5′ extremities of nascent host RNA polymerase II (RNAPII) transcripts are cleaved by the FluPol and subsequently used as primers to initiate transcription (6,7). Polyadenylation and termination occur at a stretch of five to seven U residues near the 5′-vRNA end, where stuttering of the FluPol occurs and results in the formation of a 3′-poly(A) tail (3). Unlike cellular pre-mRNAs, most of the viral mRNAs are intronless. However, three of the eight vRNA segments, the M, NS and PB2 segments, produce both spliced and unspliced mRNAs, thereby expanding the coding capacity of the viral genome.
In eukaryotic cells, various proteins become associated to mRNAs as they are being transcribed and processed to form mRNA–protein complexes (mRNPs). The associated proteins control the fate of an mRNA, including splicing, polyadenylation, nuclear export, localisation in the cytoplasm, translation efficiency, quality control, stability and decay, and the composition of mRNPs varies depending on the nature and the life cycle step of the mRNA (8,9). Even though the landscape of proteins associated to cellular mRNAs has been explored on a global level (10,11), little is known about the interactome of specific cellular mRNAs (12). Influenza viruses are co-opting the host transcriptional, splicing and nuclear export machineries to ensure efficient viral gene expression. The FluPol is actively recruited to the sites of active RNAPII transcription, and a direct interaction between the FluPol and the RNAPII C-terminal domain was shown to be essential for cap-snatching (7,13,14) and genome replication (15). Mapping of virus–host protein–protein interactions and genetic screens have led to the identification of numerous transcription, splicing and mRNA export factors that are potentially relevant to IAV gene expression, only a small fraction of which have been thoroughly investigated (reviewed in (5)). To date, very little is known about the proteins that are assembled with the viral mRNAs to form viral mRNPs, and how these RNA-binding proteins (RBPs) control the fate of spliced and unspliced viral mRNAs and their delivery to the cellular translational machinery in the cytoplasm.
In this study, we focused on the highly-abundant, intronless viral mRNA encoding the NP protein. We applied a powerful combination of protein-RNA cross-linking and RNA interactome capture using a sequence-specific antisense RNA probe (16), and we identified 51 proteins that directly bind to the NP-mRNA in IAV-infected human cells. By combining our proteomics data with loss-of-function experiments, we uncovered cellular factors important for a productive viral infection, among which the host protein TDP-43 was shown to be recruited to the transcribing viral polymerase by an RNA-independent interaction between FluPol and TDP-43. Overall, our data provide the first insights into influenza mRNP composition and function, and reveal an essential role of the transcribing viral polymerase in recruiting cellular RBPs to viral mRNAs.
Materials and methods
Cells and viruses
A549 (ATCC CCL-185) and HEK-293T cells (ATCC CRL-3216) were grown in complete Dulbecco's modified Eagle's medium (DMEM, Gibco) supplemented with 10% (v:v) fetal calf serum (FCS), 100 U/ml penicillin and 100 μg/ml streptomycin. Madin-Darby Canine Kidney (MDCK) and MDCK-SIAT (17) cells, kindly provided by the National Reference Center for Respiratory Viruses (Institut Pasteur, Paris, France) and by Dr M. Matrosovich (Philipps Universität, Marburg, Germany) respectively, were grown in modified Eagle's medium (MEM) supplemented with 5% FCS, 100 U/ml penicillin and 100 μg/ml streptomycin. STING-37 cells expressing the Firefly luciferase under the control of Interferon-Stimulated Response Elements (18), kindly provided by Dr P.O. Vidalain (CIRI, Lyon), were grown in DMEM supplemented with 5% FCS and 400 μg/ml geneticin. The recombinant viruses A/WSN/33 (WSN), WSN-PB2-2A-Nanoluc, WSN-PB2-Gluc1, WSN-PB2-Strep and WSN-PB2-2A-mCherry were produced by reverse genetics as described in (15,19–21). The recombinant RSV-GFP virus was kindly provided by Dr M.A. Rameix-Welti (22). The human seasonal influenza viruses A/Bretagne/7609/2009 (H1N1pdm09) and A/Centre/1003/2012 (H3N2) serially passaged on A549 cells (23) were kindly provided by Dr C. Demeret (Institut Pasteur, Paris, France).
RNA interactome capture (eRIC)
The eRIC protocol used here was essentially as previously published (16), with the exception that an NP-mRNA-specific capture probe bound to magnetic beads was used in place of a 20 thymidine nucleotides (dT) probe. This is due to the fact that we aimed to specifically capture NP-mRNAs from infected cells, while the original eRIC method was designed to capture all mRNAs indiscriminately by binding to their poly(A) tails. To this end we first set about testing 6 potential single-stranded DNA probes with complementary sequences to different regions within the WSN NP-mRNA. We identified these 6 sequences using the proprietary Biosearch Technologies Stellaris Probe Designer tool (Supplementary File S1). For each probe sequence and a bead only control, a 10 cm dish of 80% confluent A549 cells was infected with WSN at a multiplicity of infection (MOI) of 5 PFU/cell. Cells were incubated for 6 h before being washed in ice cold PBS and UV crosslinked at 254 nm (AnalyticJena Crosslinker). Cells were then scraped from the dishes in PBS and pelleted at 2500 g for 10 min at 4°C. PBS was removed from the pellet and cells resuspended in 1 ml of ice cold lysis buffer (20 mM Tris–HCl pH 7.5, 500 mM LiCl, 1 mM EDTA, 5 mM DTT and 0.5% LiDS). The pellet was incubated on ice for 30 min and then homogenised by serial passage through a 22-gauge syringe followed by a 27-gauge syringe. The resulting lysate was snap frozen and stored at –80°C until thawing at 37°C, addition of RNase inhibitor and incubation at 55°C for 10 min. The lysate was then placed on ice for 5 min and clarified at 8000 g for 10 min at 4°C. At the same time each biotinylated probe to be tested was conjugated to 300 μl of agarose streptavidin beads (ThermoFisher, 20347) by agitating in 500 μl PBS at room temperature for 1 h. After incubation, beads were washed 3 times in 500 μl and resuspended in 300 μl PBS. A bead-only control without any NP probe was also included. The lysate supernatant was incubated with 300 μl of the conjugated streptavidin beads and agitated at room temperature for 1 h before beads, now with bound NP-mRNA, were captured by centrifugation and the lysate was removed. Beads were washed twice in one volume of pre-warmed (37°C) lysis buffer and agitated for 5 min prior to three successive washes with one volume of each of the pre-warmed wash buffers #1 (20 mM Tris–HCl pH 7.5, 500 mM LiCl, 1 mM EDTA, 5 mM DTT and 0.1% LiDS), #2 (20 mM Tris–HCl pH 7.5, 500 mM LiCl, 1 mM EDTA, 5 mM DTT and 0.02% NP40) and #3 (20 mM Tris–HCl pH 7.5, 200 mM LiCl, 1 mM EDTA, 5 mM DTT and 0.02% NP40). Beads were then resuspended in 50 μl of nuclease-free water and RNA was heat eluted at 95°C for 10 min. Eluted RNA underwent cDNA conversion and qPCR to quantify the enrichment of NP-mRNA present for each NP probe when compared to the bead only control.
After a single NP probe sequence was selected on the above optimisation, it was designed for the complete eRIC protocol. Similar to the dT probe in the original eRIC method, our probe alternated between standard nucleic acids and locked nucleic acids (LNA, indicated by a + preceding the modified nucleotide in the following sequence of the NP probe: [+g]aa[+g]ct[+t]ga[+t]ac[+t]ct[+t]ag[+a]tc[+t]), and was conjugated to carboxy beads.
For each condition nine 150 cm2 dishes of A549 cells were grown to 80% confluency. Cells were then washed with PBS and either infected with WSN at a MOI of 5 PFU/cell, or not infected (mock control). Cells were further incubated for 6 h, before media was removed and cells washed with ice cold PBS. Cells were then covered with a minimal layer of ice-cold PBS and either UV crosslinked at 254 nm (AnalyticJena Crosslinker), or left untreated (non-crosslinked control). Cells were scraped from the dishes in PBS and pelleted at 2500 g for 10 min at 4°C. After removal of the PBS from the pellet, cells were resuspended in 15 ml of ice cold lysis buffer and incubated on ice for 30 min before being homogenised by serial passage through a 22-gauge syringe followed by a 27-gauge syringe. The lysate was then snap frozen and stored at –80°C.
The frozen lysate was thawed at 37°C before the addition of RNase inhibitor and incubation at 55°C for 10 min. The lysate was then placed on ice for 5 min before being clarified at 8000 g for 10 min at 4°C. The supernatant was incubated with 300 μl of magnetic beads conjugated to the LNA-NP probe at room temperature for 1 h before beads, now with bound NP-mRNA, were captured on a magnet and lysate was removed. Beads were then washed twice in one volume of pre-warmed (37°C) lysis buffer and rocked for 5 min prior to three successive washes with one volume of each of the pre-warmed wash buffers #1, #2 and #3. Beads were then resuspended in 150 μl of nuclease-free water. A 15 μl aliquot was removed and bound RNA was heat-eluted at 95°C for 10 min and analysed using an Agilent 2100 Bioanalyser. The remaining 135 μl water-bead mix was incubated with 15 μl of RNase cocktail (0.2 μl RNase A/T1 (ThermoFisher, AM2288) in 100 mM Tris–HCl pH 7.5) at 37°C for 30 min. Beads were captured and the supernatant (containing the NP-mRNA interacting proteins) was collected and stored at –80°C for mass spectrometry analysis.
Preparation of total lysates
Cell pellets were resuspended in a lysis buffer composed of Tris–HCl 10 mM, EDTA 1 mM, LiCl 500 mM, DTT 5 mM, LiDS 0.5%. Lysates were homogenised with a seringe caliber 22 and sonicated with a Branson sonicator (Amplitude 80%, 10 s ON / 30 s OFF cycle, 2 times).
SP3 digestion of total lysates and eRIC samples
eRIC elution samples and total lysates were adjusted at SDS 1% final, reduced and alkylated at a concentration of TCEP 5 mM (646547 - Sigma-Aldrich) and chloroacetamide 20 mM (22790 – Sigma-Aldrich) for 1 h incubation under agitation at room temperature. Samples were treated using Single-Pot Solid-Phase-enhanced Sample Preparation (SP3) protocol with Sera-Mag Speed-Beads (65152105050250, 45152105050250 – cytiva) in a 1:1 ratio (v/v) to bound and digest proteins according to (24) with minor modifications. Proteins were digested with sequencing grade modified trypsin (V5111 – Promega) at a ratio of 1:50 (enzyme:protein) or with trypsin/lys-C mixture (V5071 – Promega) at a ratio of 1:25, both at 37°C overnight for eRIC samples and total lysates. Then, the samples were placed on a magnet for 1 min and the supernatant containing peptides was transferred in a new tube. Finally, 200 μl of water were added to the beads, mixed 10 min at room temperature and supernatant was transferred to the same tube. Digested peptides were acidified at 1% with formic acid (FA) before proceeding to a desalting step using the Stage-Tips method as described in (25,26) for eRIC samples or using the AssayMAP Bravo (Agilent) with C18 cartridge (5190–6532, 5 μl bead volume – Agilent Technologies) for total lysates. Elution was performed with ACN 80%, FA 0.1%. Peptide solutions were speed-vac dried. eRIC samples were resuspended in HEPES 100 mM, pH 8.5 for a subsequent TMT labelling and total lysates in ACN 2%, FA 0.1% buffer for LC–MS acquisitions.
Tandem mass tag (TMT) labelling of eRIC samples
For TMT labelling, TMT10plex (90110 - Thermo Scientific) was resuspended with anhydrous ACN and added to each sample with a 8:1 ratio (TMT reagent:peptide). Following a 1 h incubation at room temperature, the TMT was quenched with hydroxylamine at a final concentration of 5% during 15 min at room temperature. Labelled samples were pooled and freeze-dried before resuspension in FA 1%. Samples were desalted using the Stage-Tips method described above.
LC–MS/MS data acquisition
Data were acquired using a nanochromatographic system (Proxeon EASY-nLC 1200 – Thermo Scientific) coupled on-line to a Q Exactive™ HF mass spectrometer (eRIC samples) or to a Q Exactive™ Plus mass spectrometer (total lysates). For each sample, peptides were injected into a reverse phase home-made column (34 cm (eRIC samples) or 49 cm (total lysates), 75 μm ID, 1.9 μm particles, 100 Å pore size, ReproSil-Pur Basic C18—Dr Maisch GmbH) after an equilibration step in solvent A (H2O, 0.1% FA). The column temperature was set to 60°C. Mass spectra were acquired using the Xcalibur software using a data-dependent Top 10 method. For eRIC samples, peptides were eluted with a multi-step gradient: 2–7% of buffer B (ACN 80%, FA 0.1%) over 5 min, 7–23% over 70 min, 23–45% over 30 min and 45–95% over 5 min at a flow rate of 250 nl/min for up to 132 min. Survey scan was set from 300 to 1700 m/z at a resolution of 120 000 and MS/MS scans (fixed first mass 100 m/z) at a resolution of 60 000. The AGC target and maximum injection time for the survey scans and the MS/MS scans were set to 3 × 10⁶, 50 ms and 105, 100 ms respectively. The isolation window was set to 1.2 m/z and normalised collision energy fixed to 28 for HCD fragmentation. We used a minimum AGC target of 2 × 10³ for an intensity threshold of 2 × 10⁴. Unassigned precursor ion charge states as well as 1, 8 and >8 charged states were rejected and peptide match was preferred. Exclude isotopes was enabled and selected ions were dynamically excluded for 30 s. For total lysates, peptides were eluted with a multi-step gradient: 5–25% of buffer B over 95 min, 25–40% over 15 min and 40–95% over 10 min at a flow rate of 250 nl/min for up to 130 min. Survey scan was set from 300 to 1700 m/z at a resolution of 70 000 and MS/MS scans (fixed first mass 100 m/z) at a resolution of 17 500. The AGC target and maximum injection time for the survey scans and the MS/MS scans were set to 3 × 10⁶, 50 ms and 106, 60 ms respectively. The isolation window was set to 1.6 m/z and normalised collision energy fixed to 28 for HCD fragmentation. We used a minimum AGC target of 104 for an intensity threshold of 1.7 × 10⁵. Unassigned precursor ion charge states as well as 1, 7, 8 and > 8 charged states were rejected and peptide match was disabled. Exclude isotopes was enabled and selected ions were dynamically excluded for 45 s.
Mass spectrometry data analysis
Raw data were analysed using MaxQuant software version 1.6.6.0 (total lysates) and 1.6.10.43 (27) using the Andromeda search engine (28). The MS/MS spectra were searched against multi databases: a UniProt Homo sapiens database (20415 entries the 19/10/2019), a Influenza A virus database (11 entries the 07/01/2020) and the Bovin pancreatic ribonuclease (UniProt ID: P61823). Usual known mass spectrometry contaminants and reversed sequences of all entries were included. Andromeda search was performed choosing trypsin as specific enzyme with a maximum number of two missed cleavages. Possible modifications included carbamidomethylation (Cys, fixed), oxidation (Met, variable), Nter acetylation (variable). The mass tolerance in MS was set to 20 ppm for the first search then 4.5 ppm for the main search and 20 ppm for the MS/MS. Maximum peptide charge was set to seven and seven amino acids were required as minimum peptide length. The ‘match between runs’ feature was applied with a maximal retention time window of 0.7 min. One unique peptide to the protein group was required for the protein identification. A false discovery rate (FDR) cutoff of 1% was applied at the peptide and protein levels. The ‘match between runs’ feature was applied. For total lysates, quantification was performed using the XIC-based LFQ algorithm with the Fast LFQ mode as described in (29). Unique and razor peptides, included modified peptides, with at least two ratio count were accepted for quantification. For eRIC samples, quantification was performed using corrected reporter ion MS2 signals. The mass spectrometry proteomics data have been deposited to the ProteomeXchange Consortium via the PRIDE partner repository (30) with the dataset identifiers PXD040783 (eRIC samples) and PXD049316 (total lysates).
Statistical analysis of mass spectrometry data
To find the proteins more abundant in one condition than in another, the intensities quantified using Maxquant were compared. Reverse hits, potential contaminants, and proteins not well identified with a 1% FDR (‘Only identified by site’) were first removed from the analysis. Only proteins identified with at least one peptide that is not common to other proteins in the FASTA file used for the identification (at least one ‘unique’ peptide) were kept. Additionally, only proteins with at least four LFQ intensity values (for total lysates) or six quantified intensity values (for eRIC samples) in one of the two compared conditions were kept for further statistics. After this filtering, intensities of the remaining proteins were first log-transformed (log2). Next, intensity values were normalised by median centering within conditions (section 3.5 in (31)). Missing values were imputed using the impute.mle function of the R package imp4p (32). Statistical testing was conducted using a limma t-test thanks to the R package limma (33). An adaptive Benjamini-Hochberg procedure was applied on the resulting P-values thanks to the function adjust.P of the cp4p R package (34) using the robust method described in (35) to estimate the proportion of true null hypotheses among the set of statistical tests. Total lysates were analysed as described in (36). For eRIC samples, the proteins significantly more abundant in the infected crosslinked condition than in both controls (non-infected crosslinked and infected non-crosslinked) were defined as representing the ‘Core interactome’ (adjusted P-value lower than a false discovery rate (FDR) of 1% and log2(fold-change) higher than 2) and the ‘Expanded interactome’ (adjusted P-value lower than a FDR of 10% and log2(fold-change) higher than 1.5). Protein-protein interaction networks have been determined using the app stringApp (37) of Cytoscape (38). Widths of the edges are function of the ‘experiments’ scores provided by STRING (39). This score reflects the confidence we can have in an interaction from known interactions listed in several experimental databases. Colors are function of the measured log2(fold-change). Enrichment analyses of the proteins of interest were also performed using stringApp. All the proteins identified by MS have been used as background for the enrichment tests. A significantly low P-value means the proportion of proteins related to a term is significantly superior in the considered interactome than in this background.
siRNA-based assays
Small interfering RNAs (siRNAs) (Dharmacon ON-TARGETplus SMARTpools, individual siRNAs and Non-targeting Control pool) were purchased from Horizon Discovery. A549 cells seeded in 96-well plates (104 cells/well) were transfected with 37.5 nM of siRNA, using 0.3 μl of the DharmaFECT1 transfection reagent (Horizon Discovery), and infected at 48 h post-transfection (hpt) with the WSN-PB2-2A-Nanoluc virus (20) at a MOI of 0.001 PFU/cell. Luciferase activity was measured at 24 h post-infection (hpi) using the Nanoluc Luciferase kit (Promega) and a Centro XS3 luminometer (Berthold). Cell viability in the presence of siRNAs was assessed in the same conditions, using the CellTiter-Glo Luminescent Viability Assay kit (Promega). Knockdown efficiency of individual transcripts was quantified by RT-qPCR using SYBR green (ThermoFisher, 4309155) and using the primers listed in Supplementary File S1.
Plasmids
Plasmids pSPICA-Gluc2-TOP3B, pcDNA3.1-Gluc2-RPB1, pCI-WSN-PB1, pCI-WSN-PA, pCI-WSN-PB2-Gluc1, pCI-WSN-PB1-Gluc1/2, pCI-WSN-PA-Gluc1, pCI-Gluc1, pCI-Gluc2 and pCI-PB1-3xFlag were described previously (15,19,40). Plasmids pHMG-PB1, -PB2 and -PA derived from the A/Paris/908/97 (H3N2) virus were described ealier (41).The cDNAs encoding PB1, -PB2 and -PA from the A/Paris/2509/2009 (H1N1pdm09) virus were amplified by RT-PCR and cloned into the pHMG plasmid as described in (41). The PB2 open reading frames (ORFs) from the A/Paris/908/97 and A/Paris/2509/2009 viruses were subcloned instead of the WSN-PB2 sequence in the pCI-WSN-PB2-Gluc1 plasmid. The TDP-43, hnRNPA2B1, hnRNPH1, SF3B4, SF3A3 and PABPC1 open reading frames (ORFs) were obtained from the Human ORFeome resource (hORFeome v3.1) and were subcloned instead of the WSN-PB1 sequence in the pCI-WSN-PB1-Gluc2 and/or the pCI-WSN-PB1-3xFlag plasmid. The pCI-mCherry-NLS-3xFlag, pCI-chANP32A-Gluc2, pCI-ANP32A-Gluc2 and pCI-NP-Gluc1 plasmids were obtained following the same strategy. The V5-tag sequence was added between the TDP-43 sequence and the Gluc2 tag in the pCI-TDP-43-Gluc2 plasmid using annealed oligo-cloning. Site-directed mutagenesis was performed as previously described (13). PCR amplicons corresponding to subdomains of TDP-43 were subcloned instead of the full-length sequence in the pCI-TDP-43-V5-Gluc2 construct. To generate lentiviral plasmids, the V5-tag sequence followed by a Stop codon was introduced upstream of the IRES in the pLVX-IRES-Neo vector (Clontech, Addgene), using annealed oligo-cloning. The wild-type and variant TDP-43 sequences were amplified by PCR and the resulting amplicons were subcloned upstream of the V5-tag sequence in the pLVX-V5-IRES-Neo lentiviral plasmid. The TurboID coding sequence was amplified by PCR using the plasmid 3xHA-TurboID-NLS-pcDNA3 (a gift from Alice Ting, Addgene plasmid # 107171 (42) as a template, and subcloned into the pLVX-TDP-43-V5-IRES-Neo plasmid between the TDP-43 and V5-tag sequences, using NotI and AgeI restriction sites. For CLIP-qPCR experiments, pcDNA-NP and pPolI-NA plasmids from the reverse genetics system for WSN (43) were used. The pcDNA-NA plasmid was generated by PCR amplifying the NA coding region from pPolI-NA and cloning it in place of the NP gene into pcDNA-NP. Primers and plasmid sequences are available upon request.
CLIP-qPCR
The CLIP-qPCR protocol utilised here is essentially as described in (44). Briefly, 4 × 10⁶ HEK-293T cells were seeded in a 10 cm dish and transfected the next day with 5 μg of a plasmid overexpressing a 3xFlag tagged candidate RBP, or mCherry employed as a negative control. At 48 hpt cells were infected with WSN or A/Paris/2509/2009 (H1N1pdm09) at a MOI of 5 PFU/cell and incubated for 6 h. At 6 hpi, the medium was removed and cells were washed with ice cold PBS and covered with minimal ice cold PBS. Each dish underwent UV crosslinking at 254 nm (Uvitec) to covalently bind RBPs to target RNAs. Cells were then scraped, pelleted and lysed in 250 μl of NP40 lysis buffer (HEPES–KOH pH 7.5 50 mM, KCl 150 mM, EDTA pH 8.0 2 mM, NaF 1 mM and NP40 0.5%) on ice for 30 min. Lysates were then clarified and 10% was removed as an input and boiled in Laemmli buffer at 95°C for 10 min prior to western blotting. The remaining 90% of lysate was incubated with anti-Flag antibody (Sigma-Aldrich, F1804) coupled to Protein G Dynabeads (ThermoFisher, 10004D) and incubated on a rotator for 1 h at room temperature. After 1 h of incubation, beads were captured on a magnet, washed five times with 1 ml NP40 lysis buffer and three times with PBS. A fraction (10%) of the beads was removed, resuspended in Laemmli buffer and boiled at 95°C for 10 min prior to western blotting. The remaining 90% of beads underwent proteinase K digestion (ThermoFisher, EO0491) at 55°C for 60 min to release bound RNA, following the manufacturer's instructions. RNA was then isolated from the digestion by TRIzol LS (ThermoFisher, 10296028) and ethanol precipitation.
Alternatively, plasmids encoding viral proteins were transfected at the same time as the RBP- or mCherry-3xFlag expressing plasmids and cells were incubated for 48 h prior to CLIP. To assess the association of RBPs with RNAPII-transcribed viral transcripts, pcDNA3.1-NP or -NA expression plasmids were used. In contrast, for the association with FluPol-transcribed viral transcripts we used 1 μg each of pcDNA3.1-PB2, -PB1, -PA and -NP expression plasmids alongside a pPolI-NA-vRNA expressing plasmid, which constituted a mini-replicon system. Initially HEK-293T cells were transfected with varying amounts of pcDNA3.1-NA or pPolI-NA-vRNA to ascertain which conditions resulted in comparable levels of NA-mRNA. This was important to rule out whether any enrichments that may be observed were simply due to an abundance of the NA transcript in one particular system over another. We settled on 1 μg of pcDNA3.1-NA and 100 ng of pPolI-NA-vRNA as the most comparable in their respective systems. At 48 hpt, UV-crosslinking and subsequent CLIP-qPCR analysis were performed as described above.
Isolated RNA (50 ng) then underwent cDNA conversion using previously described primers specific to WSN or A/Paris/2509/2009 (H1N1pdm09) transcripts (Supplementary File S1), or oligo-dT for cellular genes using the ABI High-Capacity cDNA Reverse Transcription Kit (ThermoFisher, 4368814) following the manufacturer's instructions (45). Quantification of the RNA present in these cDNAs was performed by qPCR using SYBR green (ThermoFisher, 4309155). Individual influenza cDNAs were amplified using a segment specific primer, such as NP.mRNA-Fwd and the adapter-specific primer, such as mRNA-Rev (Supplementary File S1) and a strand-specific RT-qPCR protocol (45). Cellular transcripts were amplified using gene specific primer pairs (Supplementary File S1). Enrichment of RNA levels was determined using the 2−ΔΔCT method (46).
Split luciferase-based complementation assays
The protein complementation assays (PCA) were performed as described previously, either in an infectious context (iPCA (19)) or a in transient expression context (PCA, (13)) with minor modifications. Briefly, HEK-293T cells were seeded in 96-well white opaque plates (Greiner Bio-One, 3 × 10⁴ cells/well), one day before plasmid transfection with polyethylenimine (PEI, Polysciences, Inc., 3 μl of PEI at 1 mg/ml for 1 μg of DNA). Cells were transfected with each indicated Gluc1-P1 and Gluc2-P2 plasmid (total plasmid amount: 150 ng), where P1 and P2 represent proteins or protein subdomains of interest (PCA). Alternatively, cells were transfected with 100 ng of the indicated Gluc1-P1 plasmid and subsequently infected with the WSN-PB2-Gluc1 virus at a MOI of 5 PFU/cell (iPCA), or co-transfected with 25 ng of each of pCI-ANP32A-Gluc2 and pCI-WSN-NP-Gluc1 plasmids (control for RNase A treatment) and subsequently infected with the WSN virus at a MOI of 5 PFU/cell. Samples replacing Gluc1-P1 with Gluc1 or Gluc2-P2 with P2 were used as background controls. The luciferase enzymatic activities were measured using the Renilla Luciferase Assay system (Promega) and a Centro XS3 luminometer (Berthold) at 6 hpi (iPCA) or 24 hpt (PCA). Normalised Luminescence Ratios (NLR) were calculated as described previously (13). When indicated, the cell lysates were split in two halves, one of which was supplemented with RNase A (ThermoFisher, EN0531) at a final concentration of 100 μg/ml for 30 min at 37°C before luciferase activities were measured and analysed as described above.
CRISPR gene knock-down and lentiviral gene rescue
A lentivirus encoding Spy Cas9 was used to generate a stably expressing A549 cell line. Briefly, lentiCas9-Blast (Addgene, 52962) was transfected into HEK-293T cells along with packaging plasmids pΔ8.74 (Addgene, 22036) and pMD2G (Addgene, 12259), using PEI reagent. At 72 hpt the conditionned media, now containing lentiviral particles, was passed through a 0.45 μm-pore size filter and transferred onto A549 cells. At 48 h post-transduction the media was removed and replaced with blasticidin containing media (10 μg/ml) to select for transduced, and thus Cas9-expressing, cells. Cells were then single-cell cloned in 96-well plates and individual clones were assessed for Cas9 expression by western blotting using an anti-Flag antibody as described above. This allowed us to establish a parental A549-Cas9 cell line for all subsequent knock-out experiments. To knock-out TDP-43 expression, we cloned oligos encoding for TDP-43 sgRNAs (Supplementary File S1), taken from the GeCKO v2 library (47), into the lentiGuide-puro plasmid (Addgene, 52963). These plasmids were confirmed by Sanger sequencing before production of lentiviral particles. Lentiviruses were generated in the same way as above, overlaid onto A549-Cas9 cells and selected using puromycin (2 μg/ml). Cells were single cell cloned in 96-well plates and knock-outs (KO-TDP) were determined by western blotting for TDP-43.
To rescue the expression of the wild-type or variant TDP-43 proteins in KO-TDP cells, a series of pLVX-TDP-43-V5-IRES-Neo and pLVX-TDP-43-V5-TurboID-IRES-Neo recombinant lentiviruses was produced. Briefly, 4 × 10⁶ HEK-293T cells were plated in 10 cm dishes, before co-transfection the next day with 15 μg of the pLVX-TDP-43-V5-IRES-Neo plasmid along with 10 and 5 μg of the pΔ8.74 and pMD2.G packaging plasmids, respectively, using PEI as described above. At 72 hpt the conditioned media was passed through a 0.45μm-pore size filter and placed over KO-TDP cells. At 48 h post-transduction, cells were split and cultured in G418 (2 mg/ml) containing media to select for a polyclonal population of transduced, TDP-43-expressing cells. The resulting sub-populations were assessed for TDP-43 expression by western blotting. To assess the proliferation rate of knock-out and rescued cells, cells were seeded in 96-well plates at the density used for viral replication assays (3 × 10⁴ cells/well) and the CellTiter-Glo Luminescent Viability Assay kit (Promega) was used at the indicated time-points.
Proximity labelling
The protocol for TurboID-mediated proximity labelling was an adaptation from the protocol described in (42). Briefly, A549-derived cells were seeded in two 35 cm dishes (106 cells/dish) and infected with the WSN virus at a MOI of 5 PFU/cell. At 5 hpi, the culture medium was replaced with 2 ml of prewarmed (37°C) medium supplemented with 50 μM biotin (Sigma Aldrich, B4501). The cells were incubated at 37°C for 10 min, washed 4 times with 2 ml ice-cold PBS, and dry-frozen at –80°C for at least 1 h 30 min. They were then lysed in 300 μl of RIPA buffer and incubated for 10 min at room temperature on a swinging holder. The duplicate lysates were pooled and centrifuged for 15 min at 16 000 g at 4°C. The supernatants were collected, an aliquot was frozen and the remaining was incubated with 25 μl of magnetic streptavidin beads (ThermoFisher, 88817, pre-washed according to the supplier's recommendations) overnight at 4°C on a rotating wheel. The beads were washed at room temperature using a magnet, twice with 1 ml of RIPA buffer (2 min), once with 1 ml of KCl 1M (2 min), once with 1ml Na2CO3 (30 s), once with 1 ml urea in 10 mM Tris–HCl (30 s), and twice with 1 ml RIPA buffer (2 min). Biotinylated proteins were eluted in 30 μl of 3X Laemmli buffer, 2 mM biotin, 20 mM DTT and incubated at 95°C for 10 min. Lysates and eluates were analysed by western blot.
Co-immunoprecipitation
HEK-293T cells were seeded in 6-well plates (8 × 10⁵ cells/well). The next day they were transfected with 1 μg of pCI-chANP32A-3xFlag, pCI-TDP-43–3xFlag or pCI-TDP-43-ΔCter-3xFlag using the PEI reagent. At 48 hpt, cells were infected with the WSN or WSN-PB2-Strep virus at a MOI of 3 PFU/cell. At 5 hpi, cells were washed once with ice cold PBS, harvested in 500 μl of PBS, pelleted at 4°C for 5 min at 1000 g and lysed in 150 μl of lysis buffer (50 mM Tris–HCl pH 8.0, 300 mM NaCl, 2 mM MgCl2, 0.3% Igepal (Sigma Aldrich, 56741), 1 mM DTT, 1X PIC (Roche, 11873580001), 10% glycerol, 25 U/ml Bensonaze (Merk, 70746) for 2 h at 4°C, and centrifuged at 16 000 g for 15 min at 4°C. The supernatants were collected, an aliquot was frozen and the remaining was incubated with StrepTactin beads (IBA Lifesciences, 2-4090-002) over-night at 4°C. After four washes with 0.5 ml of wash buffer (50 mM Tris–HCl pH8, 150 mM NaCl, 2 mM MgCl2, 0.3% Igepal), protein complexes were eluted twice with 25 μl of Biotin 1X (IBA Lifesciences, 2-1042-025) for 30 min at 4°C. Lysates and eluates were analysed by western blot.
Antibodies, immunoblots and immunostainings
For immunoblots, total cell lysates were prepared in Laemmli buffer. Immunoblot membranes were incubated with primary antibodies directed against the viral proteins HA (GeneTex GTX127357, 1:2000), PB2 (GeneTex GTX125925, 1:5000), PA (GeneTex GTX125932, 1:5000), NA (ThermoFisher, PA5-32238, 1:1000), against A/PuertoRico/8/34 virions (1:10000) (48), against the V5-tag (ThermoFisher, 46-0705, 1:1000), Flag-tag (Sigma-Aldrich F1904, 1:10000), TDP-43 (Proteintech, 10782-2-A:, 1:6000), Histone H3 (Cell Signaling, #9715, 1:1000), Tubulin (Sigma-Aldrich, T5168 – B-5-1-2, 1:10 000) Gaussia luciferase (New England Biolabs, E8023, 1:10 000), and revealed with appropriate secondary antibodies (Sigma Aldrich, A9044 and A9169, 1:10 000) and the ECL 2 substrate (Pierce). The chemiluminescence signals were acquired using the Chemidoc imaging system (BioRad) and a semi-quantitative analysis was performed with the ImageLab software (BioRad).
For immunostaining of TDP-43 during infection, approximately 1.5 × 10⁵ A549 cells were seeded for 24 h on glass coverslips (13 mm diameter, #1.5, Epredia, CB00130RAC20MNZ0) in 24-well plates prior to infection. Cells were infected at a MOI of 1 PFU/cell with the WSN virus and incubated at 4°C for 1 h in order to synchronise the infection. Samples were then fixed at the indicated timepoints by a 10 min 4% PFA treatment, then subjected to 20 min of permeabilisation with 0.2% Triton X-100 and 30 min blocking in 3% BSA. Samples were then incubated for 2h with a dilution of primary antibodies raised against TDP-43 (Cell Signalling Technologies, D9R3L, 1:200) and NP (Abcam, 128193, 1:500) in 3% BSA, and stained for 1 h with the appropriate secondary antibodies conjugated with Alexa Fluor 488 (ThermoFisher, A32723, 1:500) or Alexa Fluor 647 (ThermoFisher, A32795, 1:500). Phalloidin conjugated with Alexa Fluor 555 (ThermoFisher, A30106, 1:400) was added together with the secondary antibodies to stain the actin cytoskeleton and act as a cytosol marker. Lastly, cells were counterstained with Hoechst (Abcam, ab228551, 1:4000) before mounting on slides with ProLong Diamond Antifade Mountant (Invitrogen, P36961). Samples were imaged on a Leica Stellaris SP8 confocal system, with an HC PL APO CS2 63×/1.40 OIL objective, resulting in a pixel size of 180 nm. For each condition, a minimum of 40 cells were imaged across multiple fields of view.
For immunostaining of transiently expressed variants of TDP-43 or small double-stranded RNAs, 105 HEK-293T cells or 7.5 × 10⁴ A549-derived cells, respectively, were seeded on glass coverslips in 24-well plates. For HEK-293T cells, coverslips were pre-treated with poly-lysine (Sigma Aldrich, P8920) The next day, HEK-293T cells were transfected with 500 ng of the indicated plasmids per well using PEI. A549-derived cells were transfected with 500 ng of poly(I:C) (a mix of high and low molecular weight, ratio 1:1, InvivoGen, tlrl-picw and tlrl-pic) using lipofectamine 2000 (ThermoFisher, 11668027). Cells were fixed with 4% PFA (Fisher scientific, 47377) for 20 min, washed with PBS, and incubated with a permeabilisation and blocking solution (PBS 1× with 0.2% Triton X-100, 0.25% fish gelatin, 5% Normal Donkey Serum and 3% Normal Goat Serum) for 20 min. Cells were incubated overnight at 4°C with a primary antibody directed against the V5-tag (ThermoFisher, 46-0705, 1:200) or against small double-stranded RNAs (J2 antibody, Merck, MABE1134, 1:100), and for 1 h at room temperature with an appropriate secondary antibody conjugated to Alexa Fluor 488 (ThermoFisher, A-11029, 1:400) and with DAPI (ThermoFisher, 62248, 1 μg/ml). Antibodies were diluted in a staining solution (PBS, 5% normal donkey serum, 3% normal goat serum, 0.125% fish gelatin, 0.2% Triton X-100). Coverslips were mounted on glass slide with Fluoromount-G (Invitrogen, 00–4958-02) and examined using a Leica TCS SP8 confocal microscope with HC PL APO CS2 40× (1.3) or 63× (1.4) oil objectives. The fluorescence signals were acquired with the LAS X software and analysed with Fiji (ImageJ). Metadata can be provided upon request.
Viral replication assays
Cells were seeded in 96-well plates (3 × 10⁴ cells/well), in triplicates 24 h prior to infection. To assess the accumulation of viral RNA species from infected cells, cells were infected with the WSN virus at a MOI of 3 PFU/cell. Total RNA was isolated from pooled triplicates 5 hpi with RNeasy Mini columns according to the manufacturer's instructions (RNeasy Kits, Qiagen) and strand-specific qPCRs were performed as described previously (45). Briefly, total RNA was reverse transcribed using primers specific for NP- or NA-mRNA, -cRNA and -vRNA or cellular glyceraldehyde 3-phosphate dehydrogenase (GADPH) with SuperScript™ III Reverse Transcriptase (Invitrogen), and quantified using SYBR-Green (Roche) with the LightCyclerR 480 system (Roche). RNA levels were normalised to GAPDH and analysed using the 2−ΔΔCT as described before (46). Alternatively, cells were infected with the WSN-PB2-2A-mCherry virus at a MOI of 0.01 PFU/cell or with the RSV-GFP virus at a MOI of 0.1 PFU/cell. The fluorescence signals were acquired using the Incucyte S3 (Essen Bioscience) every 4 h (10× objective, 5 fields per well) and were analysed using the Incucyte software. To assess the production of infectious viral particles, cells were infected with the WSN virus (0.0003 PFU/cell) or the seasonal H1N1pdm09 and H3N2 viruses (0.003 PFU/cell) in OptiMEM supplemented with 0.8 μg/ml TPCK and 1% BSA. Plaque assays were performed on MDCK cells (WSN and H3N2) or MDCK-SIAT cells (H1N1pdm09) as described in (49).
Interferon response of TDP-KO cell lines
A549-derived cells (Cas9, KO2 and KO2-TDP) seeded in 24-well plates (7 × 10⁴ cells/well) were transfected with 500 ng of poly(I:C) as indicated above, or mock-transfected. Cells were washed with DMEM at 4 hpt and supplemented with DMEM + 10% FCS. Supernatants were collected at 24 hpt and 100 μl were transferred onto reporter STING-37 cells seeded 24 h ahead (3 × 10⁴ cells/well), in white opaque 96-well plates (Greiner Bio-One) pre-treated with poly-lysine (Sigma Aldrich, P8920). STING-37 cells were lysed 24 h later in 40 μl of lysis buffer (8% glycerol (v/v), 1.5 M tris-phosphate pH 8.0, 0.5 mM [(Cholamidopropyl)dimethylammonium)]-1-propanesulfonate, 0.125% (v/v) Triton X100, 0.17 M ThioUrea, 10 mM trans-(1,2-cyclohexanedinitrilo)tetraacetic acid) for 30 min at 25°C under gentle agitation. Luciferase activity was measured following injection of the substrate (0.5 g/l d-luciferin and 0.25 g/l coenzyme A diluted in 100 ml buffer (25 mM tricine pH 7.8, 5 mM MgSO4, 0.5 mM EDTA pH 8.0, 5 mM DTT, 0.5 mM ATP) using a Centro XS3 luminometer (Berthold). As a control, STING-37 cells seeded 24 h ahead (3 × 10⁴ cells/well) were directly transfected with 100 ng of poly(I:C) as indicated above, or mock transfected.
Search for putative TDP-43 binding motifs
A Python script, importing the Selenium library, was developed to systematically download all available influenza A virus sequences (with a length comprised between the ORF and segment lengths) from the Global Initiative on Sharing Avian Influenza Data (GISAID) database and to search for putative TDP-43 binding motifs on the anti-genomic, positive-sense viral RNAs. Sequences exhibiting non-DNA code characters were excluded. A search on six hexameric YG-rich TDP-43 binding motifs (GUGUGU, UGUGUG, UGUGCG, UGCGUG, CGUGUG and GUGUGC) (50) was performed. The script was deposited on Zenodo with the DOI 10.5281/zenodo.10652456.
Statistical analysis of cell-based data
Statistical tests were performed using the GraphPad Prism (v10) software. For CLIP-qPCR and viral PFU data, two-way ANOVA was performed after log10 transformation of the data. For luminescence or fluorescence data, one-way or two-way ANOVA was performed on untransformed data. Dunnett's test was used for multiple comparisons with respect to a reference. Tukey's test was used for multiple comparisons among all data. Sidak's test was used for pairwise comparisons of viral PFU data at distinct time points.
Results
Identification of cellular proteins bound to influenza virus NP-mRNA in human infected cells
To identify the cellular factors that interact directly with the influenza NP-mRNA during infection, we used the enhanced RNA interactome capture method (eRIC) characterized by the use of a locked nucleic acid (LNA)-modified capture probe bound to magnetic beads and the use of stringent capture and washing conditions that reinforce specificity (16) (Figure 1A). In preliminary experiments we tested six biotinylated DNA probes complementary to the NP-mRNA using a streptavidin-based protocol. Only one of the six probes (NP#6) allowed a substantial ∼100-fold enrichment of the NP-mRNA compared to the control (Supplementary Figure S1A), and was selected for the eRIC experiment. Briefly, A549 cells were infected at a high MOI with the A/WSN/33 (WSN) virus. At 6 hpi, when high levels of NP-mRNA accumulate (51), UV-crosslinking was applied to create covalent bonds between RNA molecules and their direct protein binders. An LNA-modified probe NP#6 bound to magnetic beads was added to the cell lysates, and the capture, washes and elution steps of the eRIC method were performed as described previously (16). The proteins co-purified with the viral NP-mRNA were analysed by tandem mass spectrometry (LC–MS/MS) after chemical labelling with tandem mass tag (TMT). Three independent biological replicates were performed. To exclude off-target hits, we applied the eRIC method to non-infected crosslinked and infected non-crosslinked control samples in parallel.
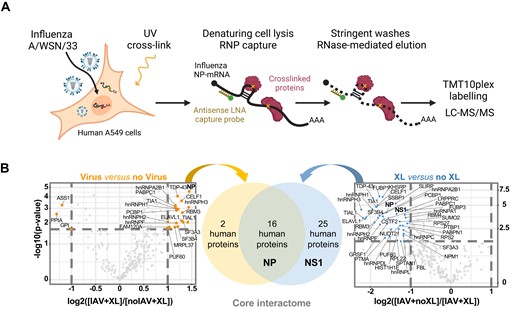
Identification of cellular proteins bound to influenza virus NP-mRNA in human infected cells. (A) Schematic representation of the eRIC approach. Created with Biorender.com. (B) Volcano plots showing the log2 fold change (x axis) and its significance (–log10(P-value)) associated to a False Discovery Rate < 1%, y axis) of each protein (dots) in the eRIC experiments. Left plot: the log2 fold change refers to the enrichment in infected crosslinked (IAV + XL, n = 3) versus non-infected crosslinked (noIAV + XL, n = 3) samples. Right plot: the log2 fold change refers to the enrichment in infected crosslinked (IAV + XL, n = 3) versus infected non-crosslinked (IAV + noXL, n = 2) samples. Orange and blue dots represent proteins enriched in IAV + XL versus noIAV + XL samples, and proteins enriched in IAV + XL versus IAV + noXL samples, respectively. The set of 16 cellular proteins found to be enriched in both comparisons is referred to as the core interactome of the viral NP-mRNA. The viral NP and NS1 proteins are indicated in bold.
Correlation analysis of the mass spectrometry data showed that the independent biological replicates were highly consistent, with Pearson's correlation coefficients higher than 72.1%, 73.2% and 75.2% for infected crosslinked (n = 3), non-infected crosslinked (n = 3) and infected non-crosslinked (n = 2) samples, respectively (Supplementary Figure S1B–D). Moreover, the distribution of peptide intensity values across the different samples was very similar (Supplementary Figure S1E). Using a fold-change (FC) threshold of 2 and a false discovery rate (FDR) threshold of 1%, we found 18 cellular proteins enriched in the infected over the non-infected samples, and 41 cellular proteins enriched in the crosslinked over the non crosslinked samples (Figure 1B and Supplementary File S2). We defined the 16 proteins enriched in both data sets as the high-confidence core interactome (Figures 1B and 2A). When total lysates from both non-infected and infected A549 cells were analysed by mass spectrometry under identical conditions and compared (n = 5), no significant enrichment of the core interactome was observed in the infected samples compared to the non-infected ones (Supplementary Figure S2A). Therefore, the enrichment observed in infected versus non-infected samples upon eRIC likely reflects a specific association with the NP-mRNA. We also defined an expanded NP-mRNA interactome with relaxed thresholds (FC > 1.5 and FDR < 10%), which includes 35 additional cellular proteins enriched in both datasets (Figure 2B and Supplementary File S2). Among these, the GRSF1 (52,53), hnRNPK (54,55), hnRNPA2B1 (56,57), NUDT21 (58) and PABPC1 (59) proteins have already been documented as being involved in the IAV life cycle, supporting the robustness and relevance of our dataset and analysis. Two major viral RNA-binding proteins (RBPs), NP and NS1, were found enriched in our experiments (Figure 1B, FC ≥ 2 and FDR ≤ 1%). The multifunctional NS1 protein was previously shown to be co-immunoprecipitated with viral mRNAs and was proposed to play a role in nuclear export and translation (5). To our knowledge there is little evidence so far for a direct binding of the NP to viral mRNAs. However, our finding is in line with the notion that NP binds to the RNA phosphate-sugar backbone with no sequence specificity (60) and is also consistent with the fact that when NP-vRNA interactions were assessed, approximately 15% of the viral sequence reads aligned to antigenomic positive-sense viral RNAs (61). The viral polymerase subunits were not enriched in our experiments, in agreement with earlier observations that the viral polymerase does not remain bound to viral mRNAs after synthesis is completed (62).
![Characterisation of the NP-mRNA interactome. (A, B) Interaction network among the 16 proteins of the core interactome (A) and the 51 proteins of the expanded interactome (B), according to the STRING database (39). Predicted protein–protein interactions are indicated by grey lines, and line thickness represents the prediction confidence score. The color scales represent the log2 fold changes characteristic of each protein and refer to the enrichment in the infected crosslinked versus non-infected crosslinked condition (border color) or to the enrichment in infected crosslinked versus infected non-crosslinked (center color) samples. A yellow colour in the center corresponds to the minimal positive enrichment value recorded in the [IAV + XL versus noIAV + XL] comparison (21 = 2-fold and 20.59 = 1.505-fold enrichment for the core and expanded interactome, respectively). A yellow colour in the border corresponds to the minimal positive enrichment value recorded in the [IAV + XL versus IAV + noXL] comparison (21 = 2-fold for both the core and expanded interactome). (C, D) Gene Ontology (GO) term, InterPro Domains and UniProt Keywords enrichment analysis on the core (C) and expanded (D) interactome. The graph represents the number of genes corresponding to each indicated category (x axis) and the enrichment P-value (color scale). (E) Venn diagram representing the overlap between the expanded interactome of the viral NP-mRNA and the cellular poly(A)-mRNA interactomes published by Castello et al. (10) and Baltz et al. (11). Proteins are ranked in alphabetical order and are indicated in bold when they belong to the core interactome. Created with Biorender.com.](https://oup.silverchair-cdn.com/oup/backfile/Content_public/Journal/nar/52/12/10.1093_nar_gkae291/1/m_gkae291fig2.jpeg?Expires=1749716598&Signature=LS7FA6VTbrDQAOtLNpxTDUBQrICWqQT0feXTiZnegj-11pLsrTcdEGsvRZ6ZChXhc0GhQ9vsLVyUk6EbU2xsII855N0vd3U05ftoyKpPAi7IJRO7UiHrWXgDP4KEU4sLYQmqupE-VwnYaz2iv-8bgX81nvDYxhmwBAOhY-x6zutQGQ-i2GN6yvRCnGtIaa4HAi8ByFVdfVFZ5xsnhJTUZHkrcIoLjzAMVmU61k~XcDRhPOlmE64ecK4i6PapWEbrnMPLOxFTpHPg72QXJKk9OauPJYRoiL7rwhfU48c6BQVZEZlUTqOZUH86spl5IKDGPNM7AY20mW5LRAN34rSXXg__&Key-Pair-Id=APKAIE5G5CRDK6RD3PGA)
Characterisation of the NP-mRNA interactome. (A, B) Interaction network among the 16 proteins of the core interactome (A) and the 51 proteins of the expanded interactome (B), according to the STRING database (39). Predicted protein–protein interactions are indicated by grey lines, and line thickness represents the prediction confidence score. The color scales represent the log2 fold changes characteristic of each protein and refer to the enrichment in the infected crosslinked versus non-infected crosslinked condition (border color) or to the enrichment in infected crosslinked versus infected non-crosslinked (center color) samples. A yellow colour in the center corresponds to the minimal positive enrichment value recorded in the [IAV + XL versus noIAV + XL] comparison (21 = 2-fold and 20.59 = 1.505-fold enrichment for the core and expanded interactome, respectively). A yellow colour in the border corresponds to the minimal positive enrichment value recorded in the [IAV + XL versus IAV + noXL] comparison (21 = 2-fold for both the core and expanded interactome). (C, D) Gene Ontology (GO) term, InterPro Domains and UniProt Keywords enrichment analysis on the core (C) and expanded (D) interactome. The graph represents the number of genes corresponding to each indicated category (x axis) and the enrichment P-value (color scale). (E) Venn diagram representing the overlap between the expanded interactome of the viral NP-mRNA and the cellular poly(A)-mRNA interactomes published by Castello et al. (10) and Baltz et al. (11). Proteins are ranked in alphabetical order and are indicated in bold when they belong to the core interactome. Created with Biorender.com.
Biological functions of the viral mRNA binding proteins
We performed a Gene Ontology (GO) enrichment analysis of the core and expanded NP-mRNA interactomes, which revealed a strong enrichment for GO terms related to RNA/mRNA metabolic processes and RNA/mRNA splicing (Figure 2C, D and Supplementary File S3) and a strong enrichment of InterPro Domains and UniProt Keywords related to RNA-binding (e.g. IPR000504, KW-0694). The analysis also indicated that the NP-mRNA interactome was enriched in proteins with repeated domains (KW-0677) and with nucleotide-binding domains with an alpha-beta plait structure (IPR012677) (Figure 2C,D and Supplementary File S3). These two categories include heterogeneous nuclear ribonucleoproteins (hnRNPs), which are characterised by repeated RNA-binding domains and overall represent 31% and 24% of the core and the expanded NP-mRNA interactome, respectively. Proteins annotated in UniProt as poly(A)-binding proteins (hnRNPDL, PABPC1, PABPN1, PABPC4, PABP2) or 3′UTR binding proteins (CELF1, ELAVL1, hnRNPD, hnRNPA1, hnRNPA2B1, hnRNPL, KHSRP, LRPPRC, NUDT21, PABPC1, PABPC4, TDP-43, TIA1, TIAL1) are also well-represented. Interestingly, the components of the NP-mRNA interactome are strongly connected to each other in terms of protein–protein interaction (PPI), according to the STRING database (Figure 2A, B, grey lines, and Supplementary File S3). Within the 51 proteins of the expanded interactome, 48 are connected to ≥1 protein and 16 are connected to ≥30 proteins (Supplementary Figure S2B).
We compared the expanded NP-mRNA interactome with two previously published datasets on the global interactome of human poly(A)-mRNAs, in total about 800 proteins with an overlap of 658 common proteins (10,11). Most of the proteins of the NP-mRNA interactome (42 out of 51) are found in both datasets while eight proteins are found in one or the other, and only one, AKR1C1, was not previously identified as a poly(A)-mRNA binding protein (Figure 2E and Supplementary File S3), indicating that the NP-mRNA binders correspond to a specific subset of the cellular poly(A)-mRNA binders. Moreover, a large proportion of the proteins in the expanded and core NP-mRNA interactomes (27 out of 51 and 10 out of 16 proteins, respectively) appear in the list of ∼200 proteins previously identified in the viral RNA-interactome of positive-stranded RNA viruses from three distinct families (63) (Supplementary File S3), suggesting that similar RNA biogenesis pathways are hijacked by divergent viruses.
Identification of viral mRNA binders that promote viral infection
We silenced each of the 16 RBPs from the NP-mRNA core interactome with small interfering RNA (siRNA) pools in order to identify proteins with a pro- or antiviral activity. Non-target (NT) and NUP62-targeted siRNA pools were used as negative and positive controls, respectively (19). As assessed by RT-qPCR, all siRNAs reduced the steady-state levels of their target mRNA by >80% except for hnRNPH3 and TIA1 for which a 60–70% reduction was observed (Supplementary Figure S3A). Most siRNAs did not affect cell viability, and a modest 10–20% reduction of cell viability was observed upon targeting of PUF60, hnRNPA2B1, SF3B4 and SF3A3 (Supplementary Figure S3B). The siRNA-treated A549 cells were infected at a low MOI with a recombinant WSN-PB2-2A-Nanoluc influenza virus carrying a luciferase reporter gene (20), and luciferase activities were measured in cell lysates prepared at 24 hpi to monitor the efficiency of viral replication. The strongest decrease (50–70%) of the luciferase signal compared to the NT control (P ≤ 0.001) was observed with five siRNA pools, targeted to members of the heterogeneous nuclear ribonucleoproteins family (hnRNPA2B1, hnRNPH1, TDP-43) or splicing factors (SF3A3 and SF3B4) (Figure 3A). Upon deconvolution of these five siRNA pools, a 40–90% reduction of the luciferase signal was observed with at least three of the four individual siRNAs (Supplementary Figure S3C), making off-target effects very unlikely and indicating that hnRNPA2B1, hnRNPH1, TDP-43, SF3A3 and SF3B4 promote viral infection.
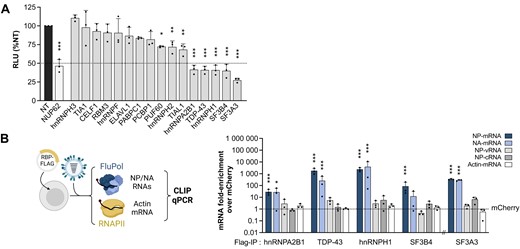
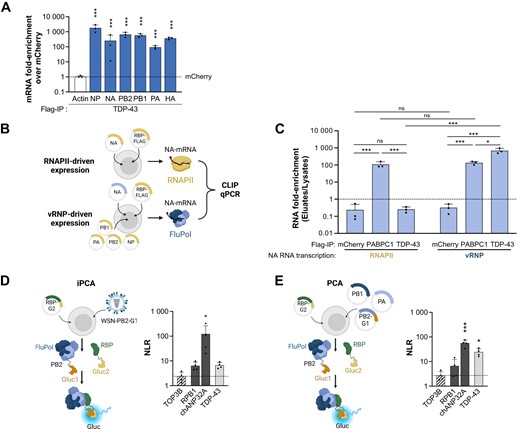
Functional analysis of the NP-mRNA core interactome. (A) Secondary screening of the proteomics hits by siRNA-mediated silencing. A549 cells were treated with control non-target siRNAs (NT, black bar), NUP62 siRNAs (white bar) or siRNAs targeting the indicated RBPs (grey bars) and infected at 48 hpt with the WSN-PB2-2A-Nanoluc virus (0.001 PFU/cell). Luciferase activities were measured in cell lysates prepared at 24 hpi. The data shown (RLU: Relative Light Units) are expressed as percentages (100%: non-target siRNA) and are the mean ± SD of three independent experiments performed in triplicates. *P < 0.05; **P < 0.01; ***P < 0.001 (one-way ANOVA and Dunnett's multiple comparisons test, reference: NT). (B) Validation of viral mRNA-binding proteins. CLIP-qPCR was performed on HEK-293T cells overexpressing one of the candidate RBPs fused to the 3xFlag tag at its C-terminal end (hnRNPA2B1-, TDP-43-, hnRNPH1-, SF3B4-3xFlag) or N-terminal end (3xFlag-SF3A3). The mCherry-3xFlag protein was used as a negative control. At 48 hpt, HEK-293T cells were infected with WSN at a MOI of 5 PFU/cell for 6 h before UV crosslinking, lysis and pulldowns were performed. After the pulldown, RNAs cross-linked to RBPs were eluted from the beads by proteinase K digestion, followed by precipitation of the RNA, cDNA conversion and qPCR. The levels of NP-mRNA, -cRNA, -vRNA, NA-mRNA and actin-mRNA were determined, and the enrichment-folds with the RPBs over the mCherry control (dotted line) were plotted. The X-axis is broken to indicate that the pulldown of 3xFlag-SF3A3 was carried out in a distinct series of experiments. The data shown are the mean ± SD of three independent experiments in triplicates. *P < 0.05; **P < 0.01; ***P < 0.001 (two-way ANOVA after log10-transformation of the data and Dunnett's multiple comparisons test, reference: mCherry). Created with Biorender.com.
We performed Cross-Linking Immunoprecipitation-qPCR (CLIP-qPCR) on this subset of five RBPs to confirm their binding to the viral NP-mRNA. The probe used for eRIC was complementary to both the NP-mRNA and the antigenomic NP-cRNA. However, at 6 hpi NP-mRNAs are considerably more abundant than NP-cRNAs, and therefore the proteins identified upon mass-spectrometry are more likely to represent mRNA-binding factors. HEK-293T cells transiently expressing RBPs fused to a Flag-tag at the C-terminus (except for SF3A3, tagged at the N-terminus) were infected at a high MOI with the WSN virus. The mCherry-Flag fusion protein was used as a negative control (Supplementary Figure S3D). All samples were infected with the same efficiency, as assessed by homogeneous levels of NP expression (Supplementary Figure S3E). As shown in Figure 3B, a significant 10- to 100-fold enrichment of co-immunoprecipitated NP-mRNA (dark blue bars) relative to the mCherry control was observed with hnRNPA2B1, SF3B4 and SF3A3 and a >1000-fold enrichment was observed with TDP-43 and hnRNPH1, which underpins the robustness of our initial RNA interactome capture data. Notably, the same trends were observed for the viral NA-mRNA (Figure 3B, light blue bars). In the same conditions, no enrichment was observed for the similarly abundant (45) genomic NP-vRNA, the antigenomic NP-cRNA or the cellular actin RNA (Figure 3B, light grey, dark grey and white bars, respectively), suggesting a preferential recruitment of this RBP subset to viral mRNAs.
Viral replication is impaired in TDP-43 knock-out cells
We chose to focus on TDP-43, or TAR DNA-binding protein-43, which was initially identified as a repressor of HIV-1 transcription (64) and then found to be involved in the life cycle of several DNA and positive-stranded RNA viruses (65). Mutations that cause misfolding and abnormal oligomerisation of TDP-43 are associated with an expanding spectrum of neurodegenerative diseases (66). There is also increasing evidence for a role of TDP-43 in human cancers (67). Beyond its role as a transcription factor, TDP-43 regulates multiple aspects of mRNA metabolism, including splicing, nucleo-cytoplasmic transport, stability and translation (68). It is an ubiquitous, 414 amino acids long RNA/DNA binding protein with mostly nuclear localisation (69). TDP-43 remains predominantly located within the nucleus of WSN-infected A549 cells at 4, 8 and 18 hpi, as assessed by indirect immunofluorescence (Supplementary Figure S4).
We achieved knock-out of TDP-43 in A549 cells by CRISPR/Cas9 as described in the Materials and methods section. Briefly, lentiviral transduction was used first to establish a clonal cell line that stably expresses the Cas9 enzyme (referred to thereafter as Cas9 cells). In a second step, sgRNA targeting TDP-43 were introduced by lentiviral transduction (Supplementary Figure S5A). Two clonal cell lines expressing two distinct sgRNAs, referred to as KO1 and KO2, showed no detectable TDP-43 levels compared to the Cas9 cells as determined by western blot (Figure 4A, top lane). They were infected at a high MOI with the WSN virus and total cell lysates prepared at 4 and 6 hpi were analysed by western blot. The viral proteins (PB2, HA, NP, NA and NS1) accumulated to lower levels in KO1 and KO2 cells compared to the Cas9 control (Figure 4A and Supplementary Figure S5B), consistent with our initial siRNA-depletion experiment (Figure 3A). Low MOI infections were performed with a recombinant WSN virus expressing the mCherry protein (WSN-mCherry) or, as a control, a recombinant Respiratory Syncytial Virus expressing the GFP protein (RSV-GFP). Cell proliferation was assessed in parallel in the same conditions and did not significantly differ between the KO1/KO2 cells and the Cas9 cells (Supplementary Figure S5C). Real-time monitoring of mCherry or GFP fluorescence revealed a decreased efficiency of multicycle replication of the WSN virus on the KO1 and KO2 compared to the Cas9 cells (Figure 4B), while no difference was observed with the RSV-GFP virus (Figure 4C).
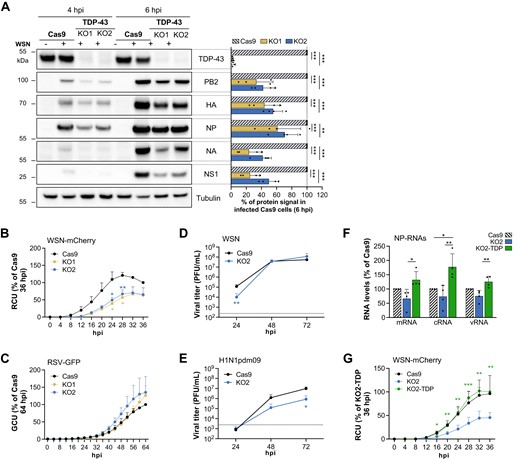
Viral growth is impaired in TDP-43 knock-out cells. (A) Effect of TDP-43 knock-out on the steady-state levels of viral proteins. A549-derived control cells (Cas9) or TDP-43 knock-out cells (KO1 and KO2) were infected with the WSN virus at a MOI of 5 PFU/cell. Total extracts were prepared at 4 and 6 hpi and were analysed by immunoblots using antibodies directed against the indicated proteins. Cropped blots are shown. The measured abundances for TDP-43 and the indicated viral proteins are normalized over the tubulin signal and expressed as percentages (100% : WSN-infected Cas9 cells at 6 hpi). The data shown are the mean ± SD of four independent experiments. **P < 0.01; ***P < 0.001 (two-way ANOVA and Dunnett's multiple comparisons test, reference: Cas9). (B, C) Effect of TDP-43 knock-out on viral growth. Cas9 (black curve), KO1 (yellow curve) and KO2 cells (blue curve) were seeded on 96-well plates, infected with the WSN-PB2-2A-mCherry (B) of RSV-GFP (C) virus at a MOI of 0.01 and 0.1 PFU/cell, respectively, and placed in the Incucyte S3 instrument for real-time monitoring of the fluorescence levels. The data shown (RCU or GCU: Red or Green Calibrated Units) are expressed as percentages of the signal measured on Cas9 cells at the latest time point and are the mean ± SD of three independent experiments performed in triplicates. *P < 0.05; **P < 0.01 (two-way ANOVA with a Dunnett's multiple comparisons test, reference: Cas9). (D, E) Effect of TDP-43 knock-out on the production of infectious influenza viral particles. Cas9 (black curve) or KO2 cells (blue curve) were infected with the WSN (D) or a seasonal H1N1pdm09 (E) virus at a low MOI (0.0003 and 0.003 PFU/cell, respectively). The supernatants were collected at the indicated time-points and viral titers were determined by plaque assay. The data shown are the mean ± SD of three independent experiments in triplicates. Triplicate samples were pooled before titration. Dotted line: viral input. *P < 0.05; **P < 0.01, two-way ANOVA after log10 transformation of the data and Sidak's multiple comparisons test). (F) Effect of TDP-43 knock-out and rescue on the accumulation of influenza virus NP-RNAs. Cas9, KO2 or KO2 cells rescued with the wild-type TDP-43 (KO2-TDP) were infected with the WSN virus at a MOI of 3 PFU/cell. Total RNAs were extracted at 5 hpi and subjected to strand-specific RT-qPCR as described in (45). RNA steady-state levels were normalised to GAPDH and analysed using the 2−ΔΔCT method. The data shown are expressed as percentages (100%: Cas9 cells) and are the mean ± SD of four independent experiments performed in triplicates. *P < 0.05; **P < 0.01; ***P < 0.001 (one-way ANOVA and Tukey's multiple comparisons test). (G) Effect of TDP-43 gene rescue on influenza virus growth. Cas9 (black curve), KO2 (blue curve) and KO2-TDP cells (green curve) were seeded on 96-well plates, infected with the WSN-PB2-2A-mCherry virus at a MOI of 0.01 PFU/cell and placed in the Incucyte S3 instrument for real-time monitoring of the fluorescence levels. The data shown (RCU) are expressed in percentages (100%: KO2-TDP cells at 36 hpi) and are the mean ± SD of five independent experiments performed in triplicates. *P < 0.05; **P < 0.01, ***P < 0.001 (two-way ANOVA and Dunnett's multiple comparisons test, reference: KO2 cells).
Following infection at a low MOI with the WSN virus, plaque assays revealed a 1-log reduction in the yield of infectious viral particles in the supernatants of the KO2 compared to the Cas9 cells at 24 hpi (Figure 4D). Our findings could be extended to other IAV strains. Upon infection with a human seasonal H1N1pdm09 influenza virus (A/Bretagne/7608/2009 or A/Paris/2590/2009), the NP-mRNA was bound by TDP-43 (Supplementary Figure S5D), and a 1-log reduction in the production of viral particles on KO2 was observed at 48 and 72 hpi (Figure 4E). A similar trend was observed with a human seasonal H3N2 virus (A/Centre/1003/2012) (Supplementary Figure S5E).
The TDP-43 protein was then re-expressed in the TDP-43 KO2 clone by lentiviral transduction followed by the selection of antibiotic-resistant polyclonal populations (Supplementary Figure S5A). We examined the effect of TDP-43 knock-out and rescue on the accumulation of NP and NA viral RNAs upon infection at a high MOI, using a strand-specific RT-qPCR protocol (45). As shown in Figure 4F and Supplementary Figure S5F, steady-state levels of m, c and vRNAs showed a consistent trend of reduced levels in KO2 compared to Cas9 cells at 6 hpi, supporting the findings in western blot and multicycle growth assays (Figure 4A-E). They were significantly increased upon rescue with the wild-type TDP-43 cDNA, i.e. in KO2-TDP compared to KO2 cells (Figure 4F and Supplementary Figure S5F). Consistently, upon infection at a low MOI (0.01 PFU/cell) with the reporter WSN-mCherry virus, the fluorescence levels were significantly higher in KO2-TDP compared to KO2 cells and reached similar levels as in Cas9 cells (Figure 4G). When assessed in the same conditions, cell proliferation did not differ between the KO2 cells and KO2-TDP cells (Supplementary Figure S5C). Overall, the data demonstrate that TDP-43 specifically enhances influenza gene expression. Of note, we observed in contrast to previous reports (70) that the knock-out of TDP-43 did not result in a higher level of cytoplasmic dsRNAs in KO2 compared to Cas9 and KO2-TDP cells, as assessed by immunofluorescence microscopy (Supplementary Figure S6A). Moreover, supernatants of poly(I:C)-treated Cas9, KO2 and KO2-TDP cells, when transferred to a reporter cell line which stably expresses the Firefly luciferase under the control of Interferon-Stimulated Response Elements (18), induced similar levels of Firefly luciferase activity (Supplementary Figure S6B), indicating that the Type I Interferon response is not significantly affected by TDP-43 depletion in A549 cells and is therefore not the underlying reason for the observed attenuated growth of influenza virus.
The viral polymerase mediates the recruitment of TDP-43 to viral mRNAs
We asked whether TDP-43 was binding other viral mRNAs beyond the NP- and NA-mRNAs. The TDP-43 CLIP-qPCR samples in Figure 3B were further analysed using qPCR primers specific for the viral PB2-, PB1-, PA- and HA-mRNAs. Each mRNA species showed a significant 100- to 500-fold enrichment upon co-immunoprecipitation with TDP-43 relative to the mCherry control (Figure 5A). The relative efficiency of binding to TDP-43 did not correlate with the reported relative abundance of viral transcripts. For instance, while the HA-mRNA appears to be ∼10-fold more abundant than the PB1- and PB2- mRNAs in several RNAseq datasets, including our own dataset on the same WSN virus as in the present study (71,72) it did not co-immunoprecipitate more efficiently with TDP-43.
TDP-43 binds to the viral polymerase (FluPol). (A) TDP-43 binding to influenza virus mRNAs beyond the NP- and NA-mRNAs. The RNAs co-purified with TDP-43 in the experiments shown in Figure 3B were analysed by RT-qPCR using primers specific for the PB2-, PB1-, PA- and HA-mRNAs. For each mRNA, the enrichment-fold with TDP-43 over the mCherry control (dotted line) was plotted. The data shown are the mean ± SD of three independent experiments in triplicates. The data shown for NP-, NA- and actin-mRNAs are the same as in Figure 3B. *P < 0.05; **P < 0.01; ***P < 0.001 (two-way ANOVA after log10-transformation of the data and Dunnett's multiple comparisons test, reference: mCherry). (B) Schematic representation of the conditions used for RNAPII-driven or vRNP-driven synthesis of the NA-mRNA. HEK-293T cells were co-transfected with the RPB-Flag expression plasmid and a pcDNA-NA expression plasmid (top), to get NA-mRNA transcribed by the cellular RNAPII. Alternatively, HEK-293T were co-transfected with the RPB-Flag expression plasmid, pcDNA-PB1, PB2, PA and -NP plasmids, and a pPolI-NA plasmid that expresses the NA viral genomic RNA (bottom), to get NA mRNA transcribed by the viral polymerase. At 24 hpt, cell lysates were prepared, and CLIP-qPCR was performed as described above (Figure 3B). Created with Biorender.com. (C) Binding of TDP-43 to the influenza NA-mRNA in the two experimental conditions described in (B). HEK-293T cells were transfected with an mCherry-, PABPC1- or TDP-43- 3xFlag expression plasmid, alongside with plasmids allowing the transcription of the NA-mRNA by the cellular RNAPII or the viral polymerase. At 48 hpt, cell lysates were prepared, CLIP-qPCR was performed, and the levels of NA-mRNA, NA-vRNA and actin-mRNA were determined in the lysates and the eluates (Supplementary Figure S7A). The NA mRNA enrichment-folds in the eluates over the lysates were plotted (dashed line: elutate to lysate ratio of 1). The data shown are the mean ± SD of three independent experiments in triplicates. ns: non significant; *P < 0.05; ***P < 0.001 (two-way ANOVA after log10-transformation of the data and Tukey's multiple comparisons test, only the most relevant statistics are shown). (D, E) Cell-based RBP-FluPol binding assays. Schematic representation of the protein complementation assays (iPCA and PCA) based on two subdomains of the Gaussia luciferase, Gluc1/Gluc2 or G1/G2, are shown. HEK-293T cells were transfected with a plasmid encoding the RBP of interest fused to Gluc2 (RBP-Gluc2), and either infected with a recombinant WSN influenza virus expressing a Gluc1-tagged polymerase for iPCA (D) or co-transfected with expression plasmids for a WSN-derived, Gluc1-tagged viral polymerase for PCA (E). An active Gaussia luciferase is reconstituted when a direct RBP-FluPol interaction occurs. Luciferase activities were measured in iPCA cell lysates at 6 hpi (D) or in PCA cell lysates at 24 hpt (E). Normalised Luminescence Ratios (NLRs) were calculated as described in the Methods section. The dotted line represents the NLR measured for the TOP3B protein, which was selected as a stringent negative control based on previously published data (19). The RPB1 and chANP32A proteins were used as positive controls. The data shown are the mean ± SD of four independent experiments performed in triplicates. *P < 0.05, ***P < 0.001 (one-way ANOVA and Dunnett's multiple comparisons test, reference: TOP3B). Created with Biorender.com.
These observations prompted us to further investigate whether the recruitment of TDP-43 to viral mRNAs was dependent on their particular biogenesis by the viral polymerase. To this end, we performed CLIP-qPCR in cells in which viral mRNA is either synthesised by the cellular RNAPII, or the viral RNA polymerase (FluPol) in a non-infectious setting. HEK-293T cells were transfected with a TDP-43-Flag expression plasmid in combination with a RNAPII promoter-driven NA expression plasmid (Figure 5B, top), or with a mix of five plasmids allowing the reconstitution of FluPol within vRNPs that actively transcribe viral NA-mRNAs (Figure 5B, bottom). Both the RNAPII and vRNP conditions resulted in similar accumulation levels of the viral NA-mRNA in the cell lysates before immunoprecipitation, as assessed by RT-qPCR (Supplementary Figure S7A, blue bars). As a negative control, immunoprecipitation of mCherry-Flag was performed and showed no enrichment of NA-mRNA in any of the tested conditions (Figure 5C and Supplementary Figure S7A, B). As a positive control we used the poly(A)-binding protein PABPC1, which was reported to bind influenza virus mRNAs (59) and belongs to our core interactome (Figure 2A). Upon immunoprecipitation of PABPC1-Flag, the NA-mRNA was enriched ∼100-fold both when transcribed by the RNAPII or by the vRNP complex. In sharp contrast, upon immunoprecipitation of TDP-43, a ∼1000-fold enrichment of the NA-mRNA was observed when transcribed from the vRNP complex, whereas no enrichment was observed when transcribed by the RNAPII (Figure 5C and Supplementary Figure S7A,B), suggesting that TDP-43 is recruited by the transcribing viral polymerase onto viral mRNAs. As a specificity control, the same series of samples were analysed for pull-down of actin mRNA, which was enriched upon immunoprecipitation of PABPC1 but not mCherry or TDP-43 (Supplementary Figure S7A, white bars). In agreement with the results shown in Figure 3B, no enrichment of the viral negative-stranded genomic NA-vRNA was observed in any of the tested conditions (Supplementary Figure S7A, dark grey bars).
We aimed at testing the hypothesis that TDP-43 is recruited by the transcribing viral polymerase and subsequently binds the viral mRNA to become assembled into mRNPs. We therefore investigated whether the viral polymerase and TDP-43 are physically interacting during the course of infection, using a split-luciferase based protein complementation assay either in an infectious setting (iPCA), or alternatively in a transient pairwise expression setting (PCA) (Figure 5D, E). Well-documented cellular partners of the viral polymerase, i.e. the human RNAPII large subunit (RPB1) and the chicken ANP32A protein (chANP32A) were used as positive controls (7,73), whereas the TOP3B protein was used as a negative control (19). Briefly, TDP-43 and the control proteins, tagged with the Gaussia luciferase Gluc2 domain at their C-terminal end, were transiently expressed in HEK-293T cells. A Gluc1-tagged polymerase was provided, either by infection at a high MOI with a recombinant WSN influenza virus expressing a Gluc1-tagged polymerase (WSN-PB2-Gluc1) (Figure 5D) or by co-transfection with WSN-PB2-Gluc1, PB1 and PA expression plasmids (Figure 5E). Luciferase activities due to luciferase reconstitution were determined at 6 hpi or 24 hpt, respectively. Normalised Luciferase activity Ratios (NLRs) with respect to background controls were determined as described in (19). The viral polymerase showed a positive interaction signal with TDP-43 as indicated by a mean NLR of 6.7 in the iPCA assays, above the NLR cutoff value of 4.0 previously shown to reduce the chance of false positivity below 2.5%) (19), and a mean NLR of 24.3 in the PCA assay, i.e. ≥5-fold higher than the NLR measured with TOP3B (Figure 5D,E). The NLR measured for RPB1, a direct and essential binder of the FluPol (7) was in the same range as for TDP-43 (Figure 5D,E). Polymerases derived from seasonal influenza viruses (H1N1pdm09 and H3N2 subtypes) showed similar results when their interaction with TDP-43 was investigated using the PCA assay (Supplementary Figure S7C), suggesting that the interaction is conserved and not strain-specific. When the WSN polymerase subunit fused to Gluc1 was PB1 or PA instead of PB2, lower NLRs were measured, which could mean that PB2 is at the interface between the FluPol and TDP-43 or that the highly flexible C-terminal PB2 subdomains allow more efficient luciferase reconstitution (Supplementary Figure S7D).
The C-terminal domain of TDP-43 is essential for binding to both the viral polymerase and the viral NP-mRNA
We investigated which domains of TDP-43 are involved in the physical and functional interplay with the influenza transcriptional machinery, and whether the TDP-43 RNA binding activity is involved. TDP-43 comprises an N-terminal homodimerisation domain (Nter), a central RNA binding domain (RBD) with two RNA recognition motifs, RRM1 and RRM2 (66), and a disordered C-terminal domain (Cter) (Figure 6A). Several mutant TDP-43 proteins were re-expressed in the TDP-43 KO2 clone by lentiviral transduction followed by the selection of antibiotic-resistant polyclonal populations (Supplementary Figure S5A), namely TDP-43 mutants deleted of the N-terminal domain (ΔNter), the C-terminal domain (ΔCter), or both (RBD), the E17R mutant shown to be defective for TDP-43 self-dimerisation (74), the RRM1 mutant F147L-F149L reported to be defective for RNA binding (75) and the M337V mutant reported to have a decreased affinity for G-quadruplex-containing mRNAs (76) (Figure 6A). Importantly, the truncated proteins retained the nuclear localisation domain (NLS, residues 82–98) located just upstream the RBD (77).
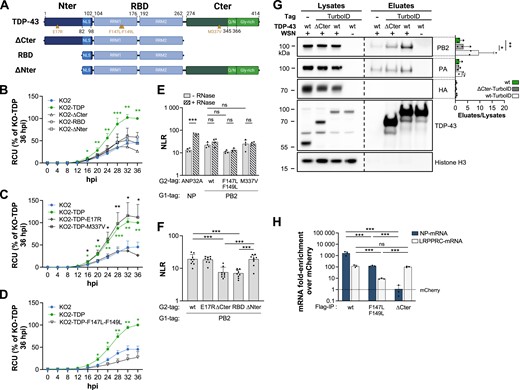
TDP-43 is recruited to viral mRNA via an interaction with the viral polymerase (FluPol). (A) Schematic representation of TDP-43 subdomains and deletion mutants. Nter: N-terminal domain; RBD: RNA-binding domain; Cter: C-terminal domain; NLS: Nuclear Localization Domain; RRM1 and RRM2: RNA Recognition Motifs 1 and 2; Q/N: Glutamine/Asparagine-rich region; Gly-rich: Glycine-rich region. Amino-acid substitutions are indicated. ΔCter: deletion of Cter; ΔNter: deletion of Nter. Created with Biorender.com. (B–D) Effect of gene rescue with wild-type or mutant TDP-43 proteins on viral growth. TDP-43 knock-out (KO2, blue curve) and wild-type (TDP, green curve) or mutant (ΔCter, RBD, ΔNter, E17R, M337V, F147L-F149L, black curves, open symbols) gene rescued cells were seeded on 96-well plates, infected with the WSN-PB2-2A-mCherry virus at a MOI of 0.01 PFU/cell and placed in the Incucyte S3 instrument for real-time monitoring of the fluorescence levels. The data (RCU) are expressed in percentages (100%: KO2-TDP cells at 36 hpi) and are shown as the mean ± SD of five (B, C) or three (D) independent experiments performed in triplicates. The data in (B, C) and in Figure 4G were generated in parallel, however for increased readability they were represented in three separate graphs, with the KO2 (blue curve) and wild-type gene rescue cells (green curve) being used as a common reference in all graphs. *P < 0.05; **P < 0.01 (two-way ANOVA and Dunnett's multiple comparisons test, reference : KO2 cells). (E) RNase sensitivity of the interaction between TDP-43 and FluPol. Split-luciferase-based PCA was performed in HEK-293T cells transiently expressing the indicated wild-type (wt) or mutant TDP-43 proteins fused to Gluc2 and WSN-PB2-Gluc1, PB1 and PA. As an RNase-dependent interaction control, the cellular ANP32A protein (fused to Gluc2) and viral NP protein (fused to Gluc1) were co-expressed. After 24 hpt, cell lysates were split in two halves which were supplemented with RNase A (hatched bars) or not (solid bars) and incubated for 30 min at 37°C prior to luciferase activity measurement. The data shown are expressed as NLR and are the mean ± SD of four independent experiments performed in triplicates. ***P < 0.001; ns: non significant (two-way ANOVA and Tukey's multiple comparisons test, only the most relevant statistics are shown). (F) Mapping of TDP-43 binding domain to the FluPol. Split-luciferase-based PCA was performed as in Figure 5E. The indicated wt or mutant TDP-43 proteins tagged with Gluc2 were transiently co-expressed with WSN-PB2-Gluc1, -PB1 and -PA. The data shown are the mean ± SD of nine independent experiments performed in triplicates. ***P < 0.001 (one-way ANOVA and Tukey's multiple comparisons test, only the most relevant statistics are shown). (G) Proximity labelling of TDP-43 in WSN-infected cells. KO2 cells were rescued with TurboID-fused TDP-43, either wt or ΔCter. KO2 cells rescued with untagged wt TDP-43 were used as a control. Proximity labelling based assays were performed on cells infected with the WSN virus at a MOI of 5 PFU/cell (+) or mock-infected (–). At 5 hpi, cells were treated with 50 μM biotin for 10 min. Cell lysates were prepared and biotinylated proteins were purified on Streptavidin-beads. Lysates and eluates were analysed by western blot. The measured abundances of PB2, PA and HA proteins are expressed as eluate to lysate ratios and as the mean ± SD of three independent experiments. *P< 0.05; **P < 0.01 (two-way ANOVA with a Tukey's multiple comparisons test). (H) Binding of TDP-43 mutants to the influenza NP-mRNA. HEK-293T cells transiently expressing the indicated wt or mutant TDP-43 proteins fused to 3xFlag, or the mCherry-3xFlag protein, were infected with the WSN virus at a MOI of 5 PFU/cell. At 5 hpi cell lysates were prepared and CLIP-qPCR was performed. The Flag-tagged proteins were detected by western blot (Supplementary Figure S11C), and the levels of NP-mRNA and LRPPRC-mRNA were determined in the lysates (Supplementary Figure S11D) and in the eluates (this figure). The mRNA enrichment-folds over the mCherry control (dotted line) were plotted. The data shown are the mean ± SD of three independent experiments in triplicates. ns: non significant; ***P < 0.001 (two-way ANOVA after log10-transformation of the data and Tukey's multiple comparisons test, only the most relevant statistics are shown).
Comparable steady-state protein levels were confirmed across the various transduced cell populations by western blot, using an antibody specific for TDP-43 or the V5 C-terminal tag fused to TDP-43 (Supplementary Figure S8A and S9A), except for the TDP-43 RBD mutant which accumulated at higher levels. Immunofluorescence staining with the anti-V5 antibody revealed a homogeneous proportion of stained cells with a predominantly nuclear staining except for the TDP-43 RBD and F147L-F149L mutants in which case an enhanced cytoplasmic localisation was observed (Supplementary Figure S8B and S9B). All investigated TDP-43 mutants (ΔNter, RBD, ΔCter, TDP-E17R, TDP-F147L-F149L) failed to rescue mCherry expression during WSN PB2-2A-mCherry infection as compared to the KO2 cells (Figure 6B-D, black curves), except for the M337V mutant (Figure 6C, crossed-circle symbols). Overall, the data demonstrate that TDP-43 specifically enhances influenza virus growth, and that all three domains of the protein, as well as homodimerisation (TDP-E17R) and RNA-binding (TDP-F147L-F149L) are essential to its proviral action.
We used split-luciferase assays to test the effect of TDP-43 mutations or deletions on its binding to the viral polymerase. When expressed transiently in HEK-293T cells, the TDP-43 variants fused to the V5-tag and the Gluc2 domain at their C-terminal extremity accumulated at a slightly lower (ΔNter) or similar level compared to wild-type TDP-43 as monitored by western blot (Supplementary Figure S10A). Nuclear localisation was confirmed upon immunostaining with an anti-V5 antibody (Supplementary Figure S10B).
Either in the transient expression setting (Figure 6E, PCA) or the infectious setting (Supplementary Figure S10C, iPCA), the interaction signals measured between TDP-43 and the viral polymerase were not significantly affected by the presence of the F147L-F149L or M337V mutation, suggesting that TDP-43 RNA binding activity is not essential for this interaction. To investigate the potential need for bridging RNA molecules, the assay was performed in the presence or absence of exogenous RNaseA (Figure 6E and Supplementary Figure S10C, hatched compared to solid bars). For the control ANP32A-NP interaction which is described to be RNase-sensitive (78), a significant increase of the interaction signal was observed upon RNase treatment. In contrast, for the FluPol-TDP-43 protein pair, the interaction signal was not significantly affected by the presence of RNase A, irrespective of whether the wild-type or F147L–F149L protein was expressed. Overall, our data show that the interaction of TDP-43 with the viral polymerase is largely RNA-independent.
When TDP-43 deletion mutants were investigated for binding to the viral polymerase in the PCA assay, the ΔCter and RBD variant showed significantly decreased interaction signals compared to the full-length TDP-43, but not the ΔNter or the E17R mutants (Figure 6F). This demonstrates that the interaction between TDP-43 and the viral polymerase does not involve the N-terminal domain of TDP-43, and suggests that the interaction is mediated primarily by its disordered C-terminal domain. We sought to confirm these findings in an infectious context, using a recombinant WSN virus encoding a PB2 protein fused to the Strep-tag at its C-terminal end and an affinity-based purification protocol shown to purify the strep-tagged FluPol (79). Upon infection of HEK-293T cells, we could detect co-purification of the endogenous and overexpressed full-length TDP-43, but not the ΔCter variant (Supplementary Figure S11A). Low amounts of TDP-43 were co-purified, and the same was observed with the chANP32A protein used as a positive control. This prompted us to use a TurboID-based proximity labelling approach, more suitable for the detection of weak or transient protein-protein interactions. TurboID is a highly active biotin ligase that converts biotin into biotin–AMP, a reactive intermediate that covalently labels proximal proteins (42). To this end, the wild-type TDP-43 and ΔCter deletion mutant were fused to TurboID and re-expressed in the TDP-43 KO2 clone by lentiviral transduction (Supplementary Figure S11B-C). The resulting cell populations KO2-TDP-TurboID and KO2-ΔCter-TurboID, in parallel with the KO2-TDP cells as a control, were infected with the WSN virus at a high MOI. At 5 hpi, biotin was added to the culture medium for 10 min before cell lysates were prepared, and biotinylated proteins were purified with streptavidin beads. Lysates and eluates were analysed by western blot. As shown in Figure 6G, the viral PB2 and PA proteins were detected in the eluates, unlike the viral HA protein or cellular Histone H3. PB2 enrichment over the background in the eluates was significantly higher in the KO2-TDP-TurboID compared to the KO2-ΔCter-TurboID samples (Figure 6G, upper panel). For PA the enrichment-folds were weaker, however the same trend was observed. These proximity labelling data are consistent with the protein complementation data shown in Figure 6F and support the conclusions that, in an infectious context, the interaction between TDP-43 and the viral polymerase is mediated by the C-terminal domain of TDP-43 and the PB2 subunit of the polymerase.
We then asked whether the ΔCter deletion mutant of TDP-43 was still able to bind the NP-mRNA. To this end, it was tested in parallel with the wild-type TDP-43 and RRM1 mutant F147L-F149L in CLIP-qPCR experiments. The ΔCter was efficiently immunoprecipitated, as assessed by western blot (Supplementary Figure S11D). The viral NP-mRNA, and the cellular LRPPRC-mRNA reported as being bound by TDP-43 in several independent studies (80–82), were quantified in the lysates (Supplementary Figure S11E) and the eluates (Figure 6H). Upon immunoprecipitation of the wild-type or F147L-F149L mutant TDP-43, the NP-mRNA was enriched ∼1000- and ∼100-fold, respectively (Figure 6H, blue bars), and the LRPPRC-mRNA was enriched ∼100 and ∼10-fold, respectively (Figure 6H, grey bars), compared to the mCherry control. This shows that the F147L-F149L mutant retains ∼10% of the wild-type RNA binding activity in this cell-based assay, although it was reported to be totally defective for RNA binding upon in vitro assays (75,83). Most interestingly, upon immunoprecipitation of the ΔCter deletion mutant of TDP-43, the LRPPRC-mRNA was enriched ∼100-fold compared to the mCherry control, similar to what observed with the wild-type TDP-43 protein, whereas no enrichment was observed for the viral NP-mRNA control (Figure 6H, ΔCter). These data clearly demonstrate that the C-terminal domain of TDP-43 is essential both for binding to the viral polymerase as shown above (Figure 6F, G), but also for binding to the NP-mRNA. Taken together with the fact that TDP-43 binds NP-mRNA preferentially when it is synthesised by the viral polymerase (Figure 5C), our findings point to a role of the viral polymerase in recruiting TDP-43 to the mRNPs, through a direct, RNA-independent interaction with its C-terminal disordered domain.
Discussion
The RBPome of influenza virus mRNAs has so far been unexplored. Over twenty studies of viral RNA-host cell interactions on a proteome-wide scale have been published in the last decade, however they were almost entirely conducted on single-stranded, positive-sense (ss+) RNA viruses, and most recently on SARS-CoV-2 (reviewed in (63)). The genomic vRNA of ss+ viruses also functions as a mRNA, as opposed to influenza and other negative-sense RNA viruses for which genomic vRNAs and mRNAs are distinct, complementary species. To our knowledge, so far only one study has investigated viral RNA-host protein interactions in influenza virus-infected cells on a proteome-wide scale, using the viral cross-linking and solid-phase purification or VIR-CLASP approach to allow the pull-down and identification of cellular proteins that associate with the incoming genomic vRNAs (84). We provide here the first characterisation of host proteins interacting with a specific influenza virus mRNA, namely the NP-mRNA, during infection. Among the 51 proteins from the influenza NP-mRNA interactome, 27 belong to a set of ∼200 proteins reported to be present in the vRNA interactomes from three families of ss + RNA viruses (Coronaviridae, Togaviridae, and Flaviviridae) (63) (Supplementary File S3). This observation suggests that specific mRNA processing pathways are hijacked by a very wide range of evolutionarily distant viruses. Intriguingly, 14 proteins from our influenza NP-mRNA interactome, including TDP-43 and hnRNPA2B1, are found among the ∼700 proteins reported to bind the incoming genomic vRNAs (84) (Supplementary File S3). However, in subsequent CLIP-qPCR experiments we could not confirm binding of TDP-43 or hnRNPA2B1 to genomic vRNAs in influenza virus-infected cells at 6 hpi. This discrepancy could possibly be due to methodological differences between the VIR-CLASP study and ours (e.g. 4SU-labelled viral genomes versus unlabelled RNAs, a MOI of 1000 versus 5 PFU/cell, UV cross linking at 1 hpi versus 6 hpi, respectively).
Our experimental workflow was designed to maximise the signal-to-noise ratio, by applying (i) the low background eRIC method (16) with a single optimised LNA-modified capture probe; (ii) differential analyses with respect to both mock-infected and non-crosslinked control samples in order to eliminate proteins bound non-covalently to beads or RNA (16) and (iii) stringent statistical and fold-change cutoff values to define a core and an expanded interactome of 16 and 51 proteins, respectively. The high validation rate by CLIP-qPCR, with all five proteins of a selected subset of the core interactome being confirmed to bind viral positive-stranded mRNAs, but not the similarly abundant viral negative-stranded genomic RNAs, supports the accuracy and specificity of our dataset. The use of a single oligonucleotide probe likely reduced the chances for off-target mRNPs, but may have resulted in the purification of only a subfraction of NP-mRNPs in which the complementary sequence was accessible. For instance, the fact that our NP-mRNA interactome contains only one translation factor (EIF4B) and no ribosomal proteins may result from the fact that our probe targeted the NP coding sequence, presumably difficult to access in a transcript undergoing active translation. A probe targeting non-coding sequences might capture a distinct set of mRNPs. Besides, a limitation of our study as well as most studies published so far is that they are limited to a single time-point, and do not separate nuclear from cytoplasmic RNAs. Synchronised infections, crosslinking at various time points or inhibition of viral replication at specific stages of infection, in conjunction with cell fractionation, will be needed to document precisely the temporal and spatial dynamics of viral RNA interactomes.
The NP-mRNA interactome reported here encompasses mostly nuclear RBPs with known or potential roles in mRNA transcription (e.g. TDP-43, PUF60, TIAL1), splicing (e.g. SF3B4, TDP-43, hnRNPH1), transport (e.g. ELAVL1, hnRNPA1), stability (e.g. GRSF1, TDP-43, ELAVL1, hnRNPA2B1) or translation (e.g. PABPC1). Five proteins, GRSF1, hnRNPK, hnRNPA2B1, NUDT21 and PABPC1, were previously documented as being involved in the IAV life cycle. GRSF1 and PABPC1 were found to bind the 5′ UTR of viral mRNAs including the NP-mRNA and to stimulate their translation (52,53,59,62,85), further supporting the robustness of our dataset. The hnRNPK protein was previously shown to bind the viral M1-mRNA and to regulate its splicing jointly with the NS1-BP protein (54,55). Our data suggest that hnRNPK also regulates the fate of unspliced viral mRNAs such as the NP- and NA-mRNAs. The NUDT21 protein was found to interact with the influenza PA-X protein and to contribute to its RNase activity towards host RNAs (58). The depletion of hnRNPA2B1 was reported in two independent studies to induce a two- to ten-fold increase in the production of infectious viral particles (56,57), which contrasts with our finding of a decreased viral replication. This discrepancy is most likely related to differences in the cell lines, virus strains and/or experimental read-outs.
The NP-mRNA interactome shows little overlap with previously published genome-wide RNAi (86–90) and CRISPR (91,92) screens aimed at identifying cellular factors involved in influenza virus life cycle. Still, PTBP1, RBM3, SNRPF, PTMA, RPS6, hnRNPA1, hnRNPDL and NUDT21 were previously reported as primary hits in at least one of these genome-wide functional screen. Our own focused RNAi screen targeting the 16 components of the NP-mRNA core interactome revealed five proteins with proviral activity (hnRNPA2B1, hnRNPH1, TDP-43, SF3B4 and SF3A3). The relatively low number of proteins identified as having pro- or antiviral function might be due to functional redundancy among the RBPs and/or to the fact that the protein knock-down was not effective enough in some instances. SF3B4 and SF3A3, known as splicing factors, may play some other yet unidentified role in the life-cycle of mRNAs that may apply to the intronless NP- and NA-mRNAs. Alternatively, influenza viruses may have evolved binding of their intronless mRNAs to splicing factors as a means of sequestering them and diverting them from their normal function. We further documented the impact of depleting TDP-43, one of the strongest hits in the proteomics enrichment analysis, that was subsequently confirmed to bind the viral NP-mRNA and several other viral mRNAs in CLIP-qPCR experiments. CRISPR-mediated knock-out of TDP-43 in A549 cells resulted in a moderate but reproducible reduction in the accumulation of viral RNAs in single cycle replication assays, which was reversed upon TDP-43 rescue. Multicycle replication in knock-out cells was delayed for several influenza virus strains (but not for RSV), and it was restored upon TDP-43 rescue. Overall our data demonstrate that TDP-43 specifically promotes influenza virus replication. TDP-43 might stabilise viral mRNAs in the nucleus and/or regulate their nuclear export. A role in translation of viral mRNAs seems less likely as we observed that TDP-43 remains mainly nuclear during IAV infection.
Although influenza mRNAs are synthesised by unique mechanism, they end up being capped and polyadenylated very much like cellular mRNAs, and therefore the RBPs of the NP-mRNA interactome were not expected to be unique to the NP-mRNA. Indeed, all except one of the 51 proteins bound to the influenza NP-mRNA have already been identified as being part of the global interactome of human poly(A)-mRNAs (10,11). Interestingly, the viral RPBome represents a strongly interconnected network of protein according to the STRING database. Indeed, each protein interacts on average with ∼40% of other proteins within the viral RBPome, with hnRNP proteins showing the highest degree of connectivity. In contrast, each protein interacts on average with only ∼4% of other proteins within the group of 658 RBPs found to bind cellular mRNAs in two independent studies (10,11), with ribosomal proteins being mostly interconnected (Supplementary File S3). The 51 host proteins interacting with influenza virus NP-mRNA could possibly be representative of a particular subset of cellular mRNPs that share a similar protein composition and function. Indeed, some evidence suggest that mRNA processing is a highly controlled, RNP-driven process (93). However, the biochemical characterisation of individual endogenous cellular mRNPs using invivo RNA-centric approaches remains challenging and very few datasets are available (12). To our knowledge, the only human endogenous mRNP characterised so far is the c-myc mRNP (94). Only five proteins of the influenza NP-mRNA interactome (hnRNPAB, PABPC1, ELAVL1, SRSF2, RPS6) are found among the list of 229 proteins reported to bind the c-myc mRNA. Conversely, none of the hnRNPA2B1, hnRNPH1, TDP-43, SF3B4 or SF3A3 NP-mRNA binders were found to bind the cellular actin-mRNA in the present study. Much broader comparisons between the interactomes of individual mRNAs will be needed in the future to uncover common and distinct regulatory mechanisms among cellular and viral mRNAs.
Unexpectedly and most importantly, we provide evidence that the FluPol can recruit RBPs onto viral mRNAs and therefore plays an essential role in the assembly of viral mRNPs. Indeed, we show that viral mRNAs are bound by TDP-43 when synthesised by the viral polymerase in infected cells, or in cells that express a recombinant vRNP, i.e. in the absence of any other viral proteins than the viral polymerase and NP, but they are not bound by TDP-43 when synthesised by the cellular RNAPII transcription apparatus. We demonstrate that when TDP-43 is deleted from its disordered C-terminal domain it can no longer bind the viral polymerase, and although it retains its RBD domain and its full capacity to bind the LRPPRC-mRNA, it can no longer bind the influenza NP-mRNA. All these data, taken together with the fact that TDP-43 was found to bind not only the NP-mRNA but at least six distinct influenza virus mRNAs, supports the model that TDP-43 is recruited primarily through protein–protein interactions with the viral polymerase before being transferred to the mRNAs and, possibly, associating with primary sequence motifs and/or secondary structures. There is in vitro and in vivo evidence that TDP-43 specifically binds UG-rich RNA sequences in the 3′ UTR or the introns of various genes (50,95–98). We searched for the presence of at least one of the six most enriched UG-containing 6-mer motifs identified by Halleger et al. upon iCLIP experiments on TDP-43 (GUGUGU, UGUGUG, UGUGCG, UGCGUG, CGUGUG and GUGUGC) (50), on all IAV anti-genomic, positive-sense sequences available in the GISAID database. As show in Supplementary File S4, >99% of NP sequences contain at least one of these motifs, whereas the proportion is less than 3% for PB1 sequences, and is intermediate (25–93%) for the other viral sequences. Among the six WSN-derived mRNAs found to bind TDP-43 in our CLIP-qPCR experiments, most but not all contain at least one of the UG-containing motifs (Supplementary File S4), indicating that the presence of such a motif is not strictly required for TDP-43 binding. Distinct UG-rich motifs such as AUGUGU or GUAUGU (50) could possibly account for TDP-43 binding. Alternatively, TDP-43 might bind with a lower affinity to even less specific RNA sequences in the context where TDP-43 is brought to viral mRNAs by the FluPol (99). Further investigations would be needed to discriminate between these different hypotheses and understand how TDP-43 is distributed along the viral mRNAs.
Taken together, we propose a model in which the viral polymerase recruits TDP-43 to the viral mRNAs (Figure 7). In agreement with previously published RNA co-immunoprecipitation assays (62), our mass-spectrometry findings confirm that the viral polymerase itself is not part of the viral mRNPs. However, our data strongly supports the hypothesis that the viral polymerase binds TDP-43 through an RNA-independent protein-protein interaction and mediates its co-transcriptional recruitment onto nascent viral mRNAs. In a broader perspective, our data suggest that TDP-43 could bind cellular mRNPs either through direct binding of its RBD to high-affinity sites, as shown for the CFTR mRNA for instance (95), or through intermediate protein-protein interactions involving its C-terminal disordered domain and favouring its subsequent binding to mRNA at lower-affinity sites. The physical association of the viral polymerase with the cellular RNAPII for cap-snatching could possibly facilitate the recruitment of TDP-43. Indeed, beyond its well-established role in post-transcriptional RNA processing, TDP-43 also appears to play a role in regulating the transcription of human genes (98,100,101). The model we propose for TDP-43 recruitment to viral mRNAs may be applicable to other RBPs, notably hnRNPH1 and SF3B4 for which we have evidence that they bind several viral mRNAs (Supplementary Figure S12A,B) as well as the viral polymerase (Supplementary Figure S12C). A common feature of these three mRNA processing factors is that they are predicted to have C-terminal disordered domains, known to serve as scaffolds for dynamic multivalent protein-protein and RNA-protein interactions and the formation of biomolecular condensates, and to be a common feature of RNAPII-related transcription factors (102,103). Our finding that these proteins get assembled into influenza mRNPs might serve as a starting point to explore to what extent phase-separation plays a role in transcription and post-transcriptional processing of viral mRNAs.

Model for the recruitment of host RNA binding proteins to viral mRNAs by the transcribing viral polymerase in the nucleus of influenza virus-infected cells. RNP: ribonucleoprotein. mRNP: messenger ribonucleoprotein. RBPs: RNA binding proteins. RNPAII: host RNA polymerase II. Created with Biorender.com.
Data availability
The mass spectrometry proteomics data have been deposited to the ProteomeXchange Consortium via the PRIDE partner repository under dataset identifiers PXD040783 (eRIC samples), and PXD049316 (total lysates). The Python script developed to screen influenza virus sequences for the presence of putative TDP-43 binding motifs was deposited on Zenodo with the DOI 10.5281/zenodo.10652456.
Supplementary data
Supplementary Data are available at NAR Online.
Acknowledgements
We would like to thank Dr Feng Zhang (Broad Institute, Cambridge, USA), Dr Mikhael Matrosovich (Philipps Universität, Marburg, Germany), Dr Pierre-Olivier Vidalain (CIRI, Lyon), Dr Daniel Marc (INRAE, Nouzilly, France), Dr Caroline Demeret, Dr Sandie Munier, Dr Cédric Diot the National Reference Center for Respiratory Viruses (all at Institut Pasteur, Paris, France) and JRS Pharma GmBH & Co.KG for sharing reagents used in this work. We would like to thank Yves Jacob, Anastasia Komarova and Valérie Najburg (Institut Pasteur, Paris, France) and Hervé Le Hir (IBENS, Paris, France) for helpful discussions. The graphical abstract was created with BioRender.com.
Funding
Agence Nationale de la Recherche [ANR-18-CE18-0028 to S.C. and N.N., ANR-10-LABX-62 to M.M. and N.N., ANR-21-CE11-0010 to N.N., ANR-21-CE35-0007 to M.M.]; Marie-Skłodowska Curie Global Fellowship [MSCA-IF-GF:747810 to D.G.C.]; European Research Council Fellowship [PTFLU 949506 to D.G.C. and S.B.]. Funding for open access charge: Institut Pasteur, Paris.
Conflict of interest statement. None declared.
References
Author notes
The first two authors should be regarded as Joint First Authors.

Comments