


Abstract
Genomic Knowledgebase (GenomicKB) is a graph database for researchers to explore and investigate human genome, epigenome, transcriptome, and 4D nucleome with simple and efficient queries. The database uses a knowledge graph to consolidate genomic datasets and annotations from over 30 consortia and portals, including 347 million genomic entities, 1.36 billion relations, and 3.9 billion entity and relation properties. GenomicKB is equipped with a web-based query system (https://gkb.dcmb.med.umich.edu/) which allows users to query the knowledge graph with customized graph patterns and specific constraints on entities and relations. Compared with traditional tabular-structured data stored in separate data portals, GenomicKB emphasizes the relations among genomic entities, intuitively connects isolated data matrices, and supports efficient queries for scientific discoveries. GenomicKB transforms complicated analysis among multiple genomic entities and relations into coding-free queries, and facilitates data-driven genomic discoveries in the future.
INTRODUCTION
Since the completion of the Human Genome Project (1), ever-evolving biotechnologies have enabled us to characterize the human genome from different perspectives. Consequently, many landmarking consortia have made tremendous progress towards understanding the functions of human genome in different aspects, such as the Encyclopedia of DNA Elements (ENCODE) (2), Roadmap Epigenomics (3), Genotype-Tissue Expression (GTEx) (4) and 4D Nucleome (4DN) (5), among others. Although these consortia provided different insights at an unprecedented scale and depth, the separately-stored tabular data is inconvenient for genomic research and scientific discoveries. First, merging multi-modal data often requires joining multiple tables, which takes tremendous storage space and efforts. Second, it is challenging to reconcile multiple data sources for the same topic (e.g. enhancers annotated by ENCODE CCRE (2) and ENdb (6)). In addition, extracting information from these isolated data requires coding skills, making open science and reproducible research difficult.
To solve this problem, we build Genomic Knowledgebase (GenomicKB), which seamlessly integrates datasets and annotations related to the human genome into a knowledge graph. Knowledge graphs intuitively represent connected data entities, and have been applied to biological domains (7–12). Compared with traditional tabular-structured data stored at separate portals, GenomicKB emphasizes the relations between genomic entities at multiple resolutions and from multiple tissues and cell types. Entities from each consortium automatically and explicitly cross-link with one another in the knowledge graph without any operations such as table joining and sorting. In addition, our GenomicKB is rigorously built with well-defined schemata, identities, and ontologies to maintain the data structure, disambiguate genomic concepts, and support future extension. As a result, GenomicKB is not only flexible to adapt updates of nodes, relations, and entire data sources, but also connects with other knowledge graphs in related biomedical domains.
To support customized queries, GenomicKB is equipped with a user-friendly web portal (https://gkb.dcmb.med.umich.edu/). To the best of our knowledge, this is the first graph pattern query system for the human genome, in which a query does not necessarily start with a genomic region or a specific genomic entity. Instead, GenomicKB supports customized pattern queries such as ‘finding two genes which are both related to signal transduction, locate on the same chromosome, and form ligand-receptor pairs’. As a result, GenomicKB transforms multi-modal data analysis into intuitive queries, and enables large-scale cross-modality pattern searching and learning in a highly-integrated knowledge graph. With this integrated data source and a robust data-sharing web portal, biomedical scientists can easily query, compare and investigate the high quality, high resolution, and comprehensive knowledge graph regarding chromatin organization, regulatory elements, epigenomic markers and transcriptional regulation in various human tissues/cell lines at multiple resolutions.
MATERIALS AND METHODS
Overall system design
Software systems
To build our knowledge graph system, we choose property graphs, one special type of data graphs, which specifies genomic entities (e.g. genes) as graph nodes, their relations (e.g. gene regulatory network) as edges, and additional information (e.g. gene descriptions) as node and edge properties. For implementation, we used neo4j (13), a native graph database, which efficiently implements the property graph model directly down to the storage level. The system also comes with an efficient query language (i.e. Cypher (14)) which supports constant-time traversals for both depth and breadth queries over data graphs.
Data importing
The original tabular datasets come from a number of data portals and web servers (Supplementary Note 1). We use a Python tool to automatically convert the tabular data to csv matrices which are supported by neo4j data loading API. For each source, a format file is used to identify data entries from the table, and help neo4j represent them as nodes and edges (Supplementary Note 2).
Version control and backup
Our data managing module periodically backups the backend graph database on a biweekly basis. Each backup is securely stored on our server and logged along with the backup date and size. Should in any case our backend graph database be modified or attacked unexpectedly, the data managing module rolls back the database to a previous backup version.
Web portal
GenomicKB is hosted on a web server at the Michigan Academic Computing Center at the University of Michigan. The backend uses python Flask as the server program and neo4j as the graph database. The server program connects to the database with the neo4j and networkx Python packages. The frontend uses vis.js to provide interactive network visualization of the graph database. Bootstrap framework is used to create a user interface. NGINX is used to perform the reverse proxy that passes internet requests to our server. User cookies are not collected. The web portal has passed a stress test to ensure reliable service under simultaneous access from multiple users.
Schema, identity and ontology in GenomicKB
Schema
Schemata prescribe high-level structures and semantics that the knowledge graph follows, which reduces data errors and allows reasoning over the data graph (15). In GenomicKB, we formally define the node schema and edge schema as follows. Nodes are labeled with hierarchical classes. The top level includes six classes, namely chromosome chain, coding element, non-coding element, epigenomic feature, variant, and ontology. Each class also consists of sub-classes (Supplementary Table S1). Edge schema defines the rules of node connections. Edges are categorized into position, regulation, expression, and annotation types, and each sub-type has corresponding start and end node types (Supplementary Table S2). For example, an ‘express in’ edge must start from a gene and point to a tissue or cell line, and a ‘correlate with’ edge only corresponds to the correlation between variants and gene expression or phenotype. Node schema and edge schema are exactly followed during data importing to ensure GenomicKB’s structure, semantics and data types.
Identity
Identity consolidates a set of unique identifiers and disambiguates different genomic identities in the knowledge graph. Since different data sources may follow different conventions to represent the same concept (e.g. ENSG00000223972 and gene DDX11L1), or use the same name to describe different concepts (e.g., gene p53 and protein p53), we use globally-unique identifiers and external identity links in GenomicKB. For example, for genes, transcripts and exons, we refer to Ensembl (16) IDs for their external identity links. For epigenomic entities without external identity links such as ChIP-seq peaks, we define their globally-unique identifiers according to their genomic coordinates, cell lines, and histone/TF types.
Ontology
Ontology is a uniform language to describe scientific terms. Concepts such as cell lines and tissues are represented as ontology URLs and IDs instead of common names to ensure disambiguity and future integration with other knowledge graphs. GenomicKB includes well-established ontologies related to genes (GO (17) and HGNC (18)), tissues and cell lines (UBERON (19), BTO (20), CL (21), and EFO (22)). These ontologies serve two roles in GenomicKB. First, some entities directly connect to ontologies and are accessible in queries. For example, users can query all genes linked to the same specified GO term. Second, scientific terms such as diseases and cell line names are encoded in ontology IDs. Therefore, different conventions of the same concept, such as ‘IMR-90’, ‘IMR90’ and ‘cells-cultured fibroblasts’ are unified in GenomicKB.
Graph query implementation
The workflow of a GenomicKB query includes two steps: (i) translation from a user’s query graph into Cypher (14) (GenomicKB’s backend query language) and (ii) returning the query result from the Cypher query. In the first step, the query graph returned from the web portal is split into ‘(start node) – (edge label) – (end node)’ triples, and each triple is translated into Cypher. For example, ‘variant correlate_with gene’ is translated into ‘MATCH (n1:variant)-[:correlate_with]->(n2:gene) RETURN n1, n2’. Particularly, positional relations between two nodes (e.g. overlap) are converted to the positional relations between each node and the chromosome backbone (Supplementary Note 1). For example, ‘gene overlap gene’ is translated into ‘MATCH (n1:gene)-[:locate_on]->(:chr_chain)<-[:locate_on]-(n2:gene) RETURN n1, n2’. In the second step, Cypher from all triples is submitted to the neo4j query system to retrieve query results. When users submit queries on the web portal, we only return the first 5–20 matched patterns on the result page to reduce the query time (by adding a ‘LIMIT’ clause to Cypher). When users click ‘export all’ on the result page to export complete results, GenomicKB re-submits the Cypher query but returns all matched patterns from the graph database.
RESULTS
GenomicKB integrates data from over 30 credible sources
Our knowledge graph integrates over 30 well-established data sources, including GENCODE (23), the Eukaryotic Promoter Database (EPD) (24), dbSuper (26), RNAcentral (25), Genotype-Tissue Expression (GTEx) (4), GWAS (27), Database of Genomic Variants (DGV) (28), NCBI dbVar (29), 4D Nucleome (4DN) (5), FIRE studies (30), ENCODE (2), MotifMap (31), NCBO ontologies (32), etc. (Supplementary Tables S1 and S2). Each of these consortia incorporates thousands of datasets and provides different insights regarding human genome at an unprecedented scale and depth. Information is explicitly represented as nodes, edges and properties in GenomicKB, resulting in 347 378 103 nodes, 1 359 209 258 edges and 3 902 460 300 node/edge properties. To the best of our knowledge, the coverage of GenomicKB exceeds any knowledge graphs in related fields (7–12). One vital advantage of our knowledge graph structure is its flexibility which allows easy inclusion of new data in different formats. In addition, the query efficiency only drops insignificantly as we increase data entries (Supplementary Note 3).
GenomicKB supports graph-based queries
We design a web portal (http://gkb.dcmb.med.umich.edu/) that supports customized queries of diverse entities, relations and properties. The query system consists of a canvas, an editor panel, and a console. On the canvas, users can draw customized graph patterns by adding nodes and edges. When adding a node/edge or a node/edge is selected, the corresponding editor panel on the top left activates to enable node/edge configuration, such as editing the type of the node/edge or adding property constraints. During the process, the console shows real-time hints to guide users to create valid queries. After the user specifies the query conditions, the user needs to click the ‘Submit’ button on the bottom to submit the query, which re-directs to a result page (Supplementary Note 5).
The result page includes two panels. The left panel displays the result sub-graph with moving and zooming functions. If positional relations (such as overlap and downstream) are included in the query, genomic regions that entities locate in are also visualized as connected bins, whereas other entities related to this region are displayed around it. The right panel displays detailed properties when a node is selected. If the retrieved sub-graph is overly large, then only partial results (e.g. five to twenty matched patterns) are visualized, and the complete query result can be downloaded by clicking ‘export all’. The downloaded result is in excel format. A video tutorial is also available on our front page.
GenomicKB simplifies cross-modality analysis as queries over the knowledge graph
GenomicKB integrates complementary data sources into a knowledge graph and simplifies multi-modal analysis as queries over the knowledge graph. For example, to identify genes and genetic variants related to type II diabetes (T2D), traditional approaches require integrating multiple data sources as follows. First, all variants correlated with T2D are retrieved from portals such as GWAS Catalog (27). Then, variants are linked to genes by identifying intra-gene variants with gene coordinates from GENCODE (23). Additional restrictions about the gene may be applied as well, such as the minimum gene expression level in pancreas (from consortia such as ENCODE (2) and GTEx (4)). Lastly, function annotations of the genes are identified from Gene Ontology (17). With GenomicKB, the aforementioned analysis can be easily completed with a sub-graph query over the knowledge graph (Figure 1). All restrictions and sub-graphs can be specified via the user-friendly interface, and the system no longer require complex queries in individual data sources or any coding skills. At the backend, the submitted query pattern is automatically translated into a Cypher query (14), and the query results are returned and visualized as graphs (Figure 1). With consolidated data and an intuitive query process, GenomicKB makes it easier for researchers to discover new genomic insights.
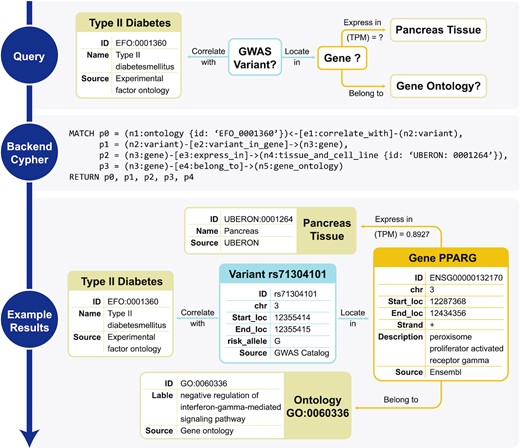
GenomicKB simplifies cross-modality analysis as queries over the knowledge graph. If a user is interested in relations between T2D and genes, then instead of searching multiple databases including GWAS, ENCODE and GO, a sub-graph query over GenomicKB returns all variants, genes and gene ontologies that satisfy the query criteria.
GenomicKB encodes positional relations among different genomic entities
Most genomic entities locate on specific regions on the chromosome with positional relations between each other. GenomicKB supports queries based on positional relations including locate_in (one entity is completely included by another), overlap (two entities have a coordinate overlap), upstream/downstream (one entity does not overlap and is upstream/downstream of another on the same chromosome), and same_chr (two entities are on the same chromosome). For example, to investigate transcription factor (TF) binding at chromatin loop anchors called at 5 kb resolution, the traditional approach is to call loops from chromatin contact maps available at 4DN data portal and collect TF binding profile from epigenome consortia such as ENCODE and Roadmap Epigenomics, and then identify their overlap with computational tools. In GenomicKB, a query ‘TF_binding_site overlap loop’ provides the same result (Figure 2). When restricting the query to GM12878 cell line and the TF name to be CTCF, 4724 distinct loops are returned. As a comparison, 5758 are returned from the query of all GM12878 loops without specifying the overlap with TF binding sites. Therefore, 82% of loops in GM12878 have at least one anchor bound by CTCF. A similar query of loops overlapping two different CTCF binding sites results in 2,680 returned entries, indicating that 47% of the 5758 loops are between two CTCF binding sites.
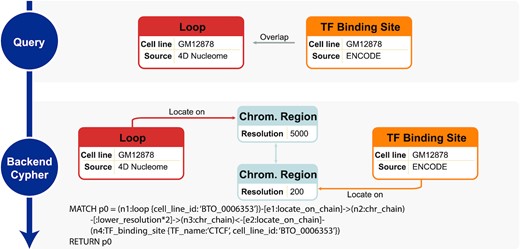
GenomicKB supports queries related to positional relations between genomic entities. An example query of CTCF binding to loop anchors is illustrated.
To represent positional relations in GenomicKB, we first split all chromosomes into regions of a particular size (i.e. resolution), represent each region as a node, and connect them with edges. The series of nodes and edges are referred to as ‘chromosome chains’, which are constructed in different resolutions. Afterwards, entities that locate on specific regions are connected to the corresponding chromosome chain nodes. The chromosome chains are intermediate nodes for capturing any positional relations between genomic entities (Figure 2, details in Supplementary Note 1).
GenomicKB reconciles consensus or conflicting data sources of the same problem
For some genomic entity, multiple data sources may provide either consensus or conflicting evidence. Knowledge graphs are able to reconcile duplicate or conflicting facts in the light of well-defined schemata, identities, and ontologies. We use the example of enhancers to show that GenomicKB reconciles multiple data sources for the same domain. As key regulatory elements, enhancers are annotated by several data sources, such as ENdb (6), EnhancerAtlas (33), ENCODE CCRE (2) and FANTOM5 (34). To identify enhancers from one database in GenomicKB, users can query the node ‘enhancer’ with restrictions such as ‘data_source = FANTOM5’. By defining enhancers from different data sources with coordinate overlaps as consensus ones, one can also query how many enhancers from two sources (e.g., CCRE and EnhancerAtlas) agree with each other (Query 1 in Figure 3). In addition, relations from one data source can be cross-validated by other data sources. For example, EnhancerAtlas provides enhancer-gene interactions, which can be validated by other approaches that map enhancers to genes such as eQTL-gene correlation as follows. First, a query ‘enhancer regulate gene’ with restriction ‘cell_line=GM12878’ and ‘data_source=EnhancerAtlas’ returns 118,610 enhancer-gene pairs from EnhancerAtlas. Then, we can identify the eQTLs of the gene locating in the enhancer, which can be represented as ‘variant overlap enhancer’, ‘enhancer regulate gene’, and ‘variant correlate_with gene’ (Query 2 in Figure 3). The number of distinct enhancer-gene pairs decreases to 16 871 in the result, indicating that 16 871 enhancer-gene pairs from EnhancerAtlas can be validated by GTEx eQTLs.
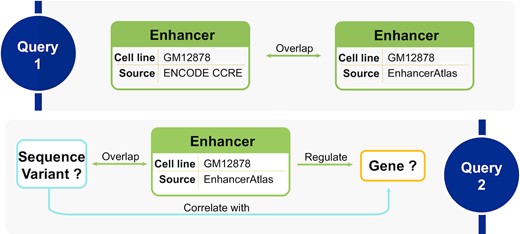
GenomicKB reconciles multiple data sources for the same problem, such as identifying enhancers and mapping enhancers to genes. Query 1 demonstrates how GenomicKB evaluates the consensus enhancers between CCRE and EnhancerAtlas. Query 2 illustrates how enhancer-gene mapping from EnhancerAtlas is validated by eQTL-gene pairs in GenomicKB.
DISCUSSION
In conclusion, GenomicKB integrates our existing knowledge regarding human genome, epigenome, transcriptome, and 4D nucleome in a large knowledge graph. Different from traditional tabular-structured data, it emphasizes the relations between different perspectives and provides explicit connections between entities of interest. With the flexibility, well-defined schemata and ontologies used in the knowledge graph, it is quite easy to update the existing entities and relations and incrementally add more entities and relations. Since GenomicKB adapts external unique identifiers for nodes and edges, it is convenient to connect it with other biomedical knowledge graphs. To increase accessibility, GenomicKB is equipped with a web portal (http://gkb.dcmb.med.umich.edu/) for users to specify and submit intuitive graph-based queries. With this portal, GenomicKB is capable of answering human genomics-related questions and conducting multi-modal analysis with a coding-free and interactive queries. Therefore, we expect that GenomicKB can attract researchers with diverse backgrounds and promote open science in genomic research.
In recent years, artificial intelligence plays increasingly important roles in problems related to transcription regulation (35–38), chromatin 3D structures (39–42), and single-cell genomics (43,44). Nevertheless, we are still looking for a ‘universal model’ that captures large-scale genomic data from different perspectives and comprehensively decodes the human genome. Similar to the field of natural language processing in which new language models and question-answering systems are based on large knowledge graphs (45,46) (e.g. the Wiki knowledge graph), we expect that genomic research becomes increasingly data-driven, and GenomicKB provides high-quality and integrated data for large-scale machine learning methods and facilitates scientific discoveries.
DATA AVAILABILITY
All data used in this study are publicly available. Source data are provided with this paper (Supplementary Note 1, Supplementary Tables 1 and 2).
SUPPLEMENTARY DATA
Supplementary Data are available at NAR Online.
FUNDING
NIH [R35HG011279 to J.L.]. Funding for open access charge: NIH [R35HG011279 to J.L.].
Conflict of interest statement. None declared.
REFERENCES
Author notes
The authors wish it to be known that, in their opinion, the second to sixth authors should be regarded as Joint Second Authors.

Comments