


Abstract
16S rRNA amplicon sequencing provides a relatively inexpensive culture-independent method for studying microbial communities. Although thousands of such studies have examined diverse habitats, it is difficult for researchers to use this vast trove of experiments when interpreting their own findings in a broader context. To bridge this gap, we introduce dbBact – a novel pan-microbiome resource. dbBact combines manually curated information from studies across diverse habitats, creating a collaborative central repository of 16S rRNA amplicon sequence variants (ASVs), which are assigned multiple ontology-based terms. To date dbBact contains information from more than 1000 studies, which include 1500000 associations between 360000 ASVs and 6500 ontology terms. Importantly, dbBact offers a set of computational tools allowing users to easily query their own datasets against the database. To demonstrate how dbBact augments standard microbiome analysis we selected 16 published papers, and reanalyzed their data via dbBact. We uncovered novel inter-host similarities, potential intra-host sources of bacteria, commonalities across different diseases and lower host-specificity in disease-associated bacteria. We also demonstrate the ability to detect environmental sources, reagent-borne contaminants, and identify potential cross-sample contaminations. These analyses demonstrate how combining information across multiple studies and over diverse habitats leads to better understanding of underlying biological processes.
INTRODUCTION
Bacteria play an important role in the Earth's ecosystem, having a total biomass higher than that of all vertebrates and fish, second only to plants (1). The introduction of 16S rRNA amplicon sequencing provides relatively cheap and accurate microbial profiling, which has been massively used to examine microbial populations in oceans (2), soil (3), plants (4), animals (5), and for performing cross-sectional human studies (6–8).
These large and diverse studies, in conjunction with reporting guidelines (9), may potentially allow us, for the first time, to conduct comparisons between microbial ecosystems across multiple studies, and also over different habitats. However, such comparisons require a designated infrastructure that is currently unavailable. The complexity of bacterial populations ranges from tens of different bacteria in a saliva sample (10), to thousands in a soil sample (11). Comparisons among bacterial populations across studies cannot rely on textual search engines, as the number of taxonomic names is much smaller than the number of bacteria (e.g. there are ∼300000 unique 16S rRNA sequences of length 90nt in the Earth Microbiome Project (11) compared to ∼4000 unique genera and 20000 unique species in NCBITAX (12) and in the Encyclopedia of Life (13)). Moreover, grouping bacteria in higher taxonomic levels may not always maintain the basic habitat properties (11). Therefore, cross-study comparisons should directly rely on 16S rRNA amplicon sequences. Recently, several denoising methods (14–16) have been used to derive amplicon sequence variants (ASVs), which are database independent, and therefore provide a useful vocabulary for comparing bacteria across studies. Hence, a single bacterial species present in different studies will result in the same ASV, even when processed separately and denoised using different methods (14,17).
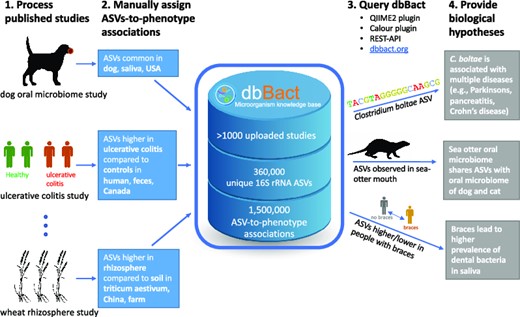
To facilitate cross-sectional comparisons of microbial communities across studies and habitats, we introduce dbBact - a wiki-like, manually curated microbial resource, which currently includes over 1000 individual studies, from which genotype-phenotype associations have been extracted, thus directly linking ASVs to various phenotypes, using ontology terms of interest (e.g. ‘the relative abundance of ASV ‘ACTGGA…’ was higher in fecal samples of children with inflammatory bowel disease compared to healthy controls in California’; see example in Figure 1). To date, dbBact includes 1500000 such associations between 360000 ASVs and 6500 ontology terms. dbBact supports two main queries: (a) searching for ontology terms enriched for a given set of ASVs - allowing users to gain insights regarding the biology associated with their ASVs of interest (Figure 2A); and (b) identification of enriched ontology terms when contrasting two sets of ASVs (Figure 2B), analogous to gene enrichment analysis (18,19).
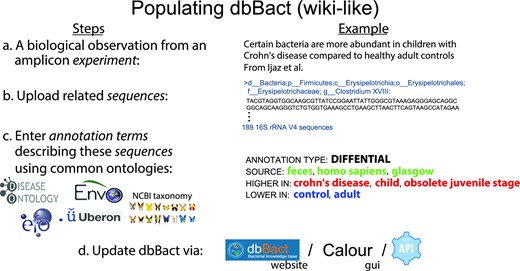
Steps in adding entries to dbBact. Users add new entries in a wiki-like way, by uploading study results. a. For example, analyzing data from Ijaz et al. (36), we identified 189 ASVs that are more abundant in fecal samples of Scottish children with Crohn's disease compared to healthy controls (see Methods section). b. These ASVs are uploaded as a FASTA file. c. Associations between ASVs and phenotypes are called annotations, which are created by assigning a set of ontology terms and predicates that characterize the context. The 189 ASVs were annotated as ‘DIFFERENTIAL,’ i.e. having a higher relative abundance in children with Crohn's disease (‘HIGHER IN’ terms), compared to healthy controls (‘LOWER IN’ terms). The general background terms common to both groups, i.e. ‘homo sapiens,’ ‘feces’ and ‘glasgow’ are designated by ‘SOURCE.’ Terms may be selected from several ontologies (e.g. DOID (37), ENVO (38,39), GAZ (40), UBERON (41), EFO (42), and NCBI Taxonomy (12)), allowing easy and precise annotations. d. Uploading annotations may be performed either through the dbBact website, dedicated clients (i.e. Calour (43)) or by REST-API. For clarity, the following nomenclature holds throughout the manuscript where ‘reserved’ words appear in italics (e.g. experiment, sequence, annotation, term), predicates appear in all caps (e.g. ‘HIGHER IN,’ ‘LOWER IN,’ ‘SOURCE’), and specific term names follow the ontology convention of being lower case (e.g. ‘homo sapiens’).
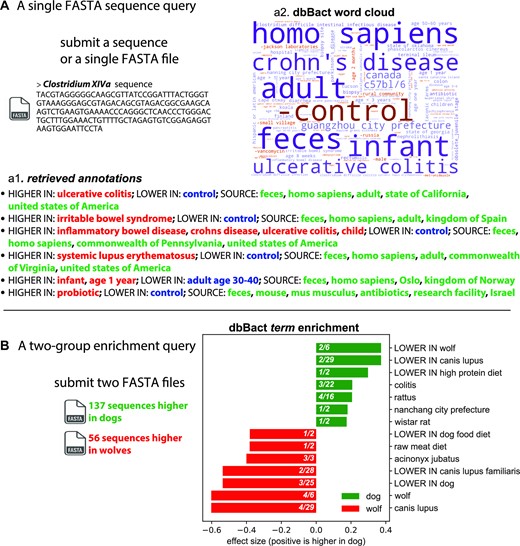
dbBact provides two basic query types: A. Uploading a FASTA file of ASVs results in a list of the most relevant annotations containing these sequences, and a ‘word cloud’ of best matching terms. In this example, a V4 ASV of Clostridium XIVa, which is highly abundant in fecal samples of chronic fatigue syndrome patients (CSF), as detected by Giloteaux et al. (44), was submitted. Panel a1 provides representative annotations containing the query ASV (the full list of ∼150 annotations appears in Supplementary File 3). dbBact found this ASV to have higher relative abundance in the disease group than in healthy controls in several studies (ulcerative colitis, irritable bowel disease, and lupus), and in antibiotic-treated mice supplemented with probiotics (last annotation arising from (45)). Panel a2 displays the word cloud summarizing the terms associated with the query ASV. The size corresponds to a term’s F1 score, while color designates the associated predicate, i.e. blue for ‘SOURCE’/’HIGHER IN’ terms, and red color preceded by a minus sign corresponds to ‘LOWER IN’ terms. Intensity corresponds to reliability, where the lighter the color the less annotations are associated with the term. Hence, this Clostridium XIVa query ASV is associated with human feces in dysbiosis states of ‘crohn's disease,’ ‘ulcerative colitis,’ ‘diarrhea,’ and ‘c. difficile infection’ (a full list of F1 scores per term appears in Supplementary File 7). B. By contrasting two groups of ASVs, dbBact identifies enriched terms characterizing each group. For example, 137 and 56 ASVs were submitted, corresponding to differentially abundant ASVs with higher relative abundance in fecal samples from domestic dogs and wolves living in zoos, respectively (data from (46)). Bar lengths show the normalized rank-mean difference for the top significantly enriched terms in the dog and wolf ASVs (green and red bars, respectively). Term enrichment is based on a non-parametric rank mean test with FDR < 0.1 using dsFDR (see the term enrichment analysis section in Methods). The numbers in the bar of each term correspond to the number of dbBact experiments in which the term differs significantly between the two ASV groups (numerator) and the total of dbBact experiments containing the term (denominator). Sequences that were more abundant in the wolf group are enriched in terms related to wolf, meat diet, and cheetah (Acinonyx jubatus).
The idea of collecting information about bacteria from multiple experiments is not new, and several microbial repositories and databases currently exist, e.g. Qiita (20), redbiom (21), MGnify (22), GutMDisorder (23), BugSigDB (24) and Disbiome database (25). However, dbBact provides a combination of several key aspects that to the best of our knowledge are not available together in any other resource: (a) Manual annotation: genotype-phenotype associations for each study are manually curated by human experts that understand the experimental setting and therefore can identify bacteria related to the different phenotypic groups. In contrast, other microbial data repositories (8,20–22,26–28) merely provide raw experimental data and metadata. (b) Unlimited scope: dbBact includes data from multiple habitats, unlike databases that are highly limited in scope (23–25,29,30), or are context-specific (31,32). (c) Size and extendibility: With over 1000 manually curated studies, the number of studies in dbBact is currently ∼40% higher than in Qiita, and the number of ASVs is comparable to that in the Earth Microbiome Project. dbBact continues to grow via addition of new studies by the dbBact team as well as contributions by researchers, using a simple user-friendly interface for uploading new studies into the database. (d) Structured genotype/phenotype search: observations are uploaded at the ASV level, allowing queries of specific subsequences. In addition, as phenotypes are derived from multiple hierarchical ontologies, querying allows for ‘cross-sectioning’ of the data. For example, ASVs associated with Crohn's disease and ulcerative colitis will be recalled when querying their ‘parent’ term, ‘inflammatory bowel disease.’ (e) Harmonizing studies performed using different variable regions: as uploaded studies may be sequenced using different 16S rRNA variable regions, cross-region queries are facilitated by ‘linking’ the ASVs through the SILVA database of full-length 16S rRNA genes (33). (f) Data analysis tools: dbBact provides a set of statistical tools for analyzing new datasets and for generating novel biological hypotheses.
In the following sections we demonstrate the usability of dbBact by re-analyzing data from published papers via dbBact and present novel, and sometimes unexpected, biological insights regarding individual bacteria and similarities among bacterial communities. The dbBact resource is publicly available at http://dbbact.org and can also be accessed via QIIME2 (34), Calour (35), and the dbBact REST-API interface.
MATERIAL AND METHODS
As dbBact is constantly growing in scope, and to facilitate reproducibility, the dbBact infrastructure described in this section and all analyses presented in the paper carried out using dbBact release 2022.07.01, available for download as part of the weekly snapshots at https://dbbact.org/download.
Nomenclature
Throughout the paper, specific italicized words are used in a dbBact context as follows:
Experiment: is a single 16S rRNA amplicon study that was uploaded to dbBact. Each experiment is linked to its corresponding paper and accession number (e.g. in SRA or Qiita).
Sequence: is an amplicon sequence variant (ASV) that has been uploaded to dbBact. The ASV originates from one of the supported dbBact 16S rRNA variable regions, having a minimal length of 100nt.
Term: is an ontology-derived phenotype used to describe a set of samples (e.g. ‘feces’, ‘ulcerative colitis’, ‘horse’).
Annotation: is a biological observation linking sequences with a set of terms in a given experiment. For example, an annotation may associate a set of sequences whose relative abundance is higher in samples from horses suffering from ulcerative colitis compared to healthy controls in a specific experiment.
Implementation
Database
The dbBact database is stored as a SQL relational database (PostgreSQL 9.5.10). The database schema and detailed table descriptions are provided in Supplementary File 1 and Figures S22, S23.
Ontologies
Table S1 presents ontologies available in dbBact release 2022.07.01. dbBact supports the addition of ontologies to allow more accurate annotations. When users provide terms that do not appear in any of these ontologies, a new term is automatically added to the generic dbBact ontology.
ASV sequences
Primers and trimming
dbBact uses exact prefix search for sequence identification, and therefore all sequences in dbBact are primer trimmed and originate from one of the supported 16S rRNA forward primers. For dbBact release 2022.07.01, the supported forward primers are V1-27F (AGAGTTTGATCMTGGCTCAGxxx), V3-341F (CCTACGGGNGGCWGCAGxxx), V4-515F (GTGCCAGCMGCCGCGGTAAxxx), where ‘xxx’ denotes the beginning of the ASV sequence stored in dbBact. Although additional primers can be added to dbBact, the vast majority of 16S rRNA studies uses one of the three primers described. The minimum length of sequences uploaded to dbBact is 100nt. Upon upload, sequences are stored at their full length rather than being truncated to a fixed length. Note that reads are not limited to specific lengths, and while the minimal length is 100nt, an overwhelming majority (>98%) of current reads are of length 150nt. When submitting a query sequence, exact sequence matches are searched using length = min(query_sequence_length, database_sequence_length).
Taxonomy assignment
Species-level taxonomy is assigned a 100% identity match to the SILVA database. In case a sequence matches several SILVA sequences, all these taxonomies will be retrieved. To account for sequences that do not match SILVA entries, we also assign lower level taxonomy using RDP version 2.12 (47). A python script runs daily to add RDP-based taxonomy assignments to uploaded dbBact ASV sequences. Although taxonomy is not used in dbBact for analysis, it may be used for querying dbBact (e.g. retrieving annotations associated with bacteria of the genus Streptococcus).
Inter-region querying
dbBact supports the harmonization of microbiome studies performed using different protocols by inter-region linking. When submitting a sequence, dbBact uses the SILVA database of full length 16S rRNA genes (SILVA version 132) to identify sequences whose ‘footprint’ in other variable regions matches the query. First, the SILVA sequences containing the query sequence are detected. Second, all dbBact sequences that match these SILVA sequences, in any region, are retrieved (i.e. Query(S) = |$\{ T:T \in dbBact,$||$\exists R \in SILVA\ so\ that\ ss( {S,R} )\ and\ ss( {T,R} ) \}$| where |$ss$| stands for ‘subsequence’). Querying is performed using the ‘wholeSeqIDsTable’ table in the dbBact implementation. To enable fast queries, a daily script is run on new dbBact sequences, linking all sequences sharing a SILVA sequence. Such linking is performed only when querying dbBact, therefore new versions of SILVA or other full length 16S rRNA databases may be seamlessly applied. Currently, dbBact supports linking the V1, V3, and V4 forward primer reads; additional primers may be incorporated if needed.
Queries of different sequence length and inexact matches
Sequences uploaded to dbBact may vary in length depending on the sequencing platform and sequenced region. When adding new annotations, dbBact stores the full-length sequence of each ASV. For example, when two experiments provide information about the same bacterium using 150nt and 200nt reads, respectively, dbBact stores these sequences as separate entries and links each annotation to the corresponding sequence. Yet, when submitting a query using either sequence, dbBact retrieves annotations using exact match on the shortest common sequence, hence also retrieving annotations related to the other sequence. For example, if a given annotation is associated with a 150nt sequence, then submitting a query ASV of length 100nt that match the first 100nt out of the 150nt would retrieve this annotation. Similarly, if the query ASV is of length 200nt, the abovementioned annotation will be retrieved if it matches its first 150nt. In addition to exact matches, dbBact searches for sequences with up to 2 mismatches using a specific REST-API endpoint.
Version freezing
As the number of studies uploaded to dbBact is constantly growing, and in order to facilitate reproducible analysis based on dbBact, we have implemented a versioning option for dbBact. All REST-API queries enable limiting results to a maximal annotation ID, hence disabling the effect of future annotations that were not present when the analysis was performed. In addition, weekly database snapshots are available for recreating dbBact versions on a local server.
dbBact interfaces
REST-API server
The dbBact REST-API server (http://api.dbbact.org) is implemented in Python 3.6, using Flask version 0.12/Gunicorn v19.9 to handle web queries, and psycopg2 version 2.7.1 for handling Postgres data queries. Full API documentation is available at http://api.dbbact.org/docs. Examples using the REST-API for querying are available at: https://github.com/amnona/dbbact-examples. The REST-API enables access to all dbBact functions. Querying dbBact or adding anonymous annotations does not require registration. Registration by username/password enables editing annotations submitted by the same user.
dbBact website
The dbBact website (http://dbbact.org) enables dbBact annotation retrieval based on ASVs, taxonomy, or ontology terms. Additionally, the website provides word-cloud generation and term enrichment analysis. The source code for the website as well as deployment instructions are available on the dbBact-website github page (https://github.com/amnona/dbbact-website).
dbBact-calour interface
dbBact is integrated into the Calour microbiome analysis program (https://github.com/biocore/ calour), using the dbBact-Calour module (https://github.com/amnona/dbbact-calour). Using this interface, users can both query dbBact regarding bacterial sequences, and add new annotations. The dbBact-Calour module provides dbBact annotation retrieval from the interactive Calour heatmap display, showing all annotations associated with the selected sequence. Additionally, the module enables GUI-based creation of new dbBact annotations for selected sequences, and performs term enrichment analysis, term-based principal coordinate analysis (PCA) and word cloud generation. A Jupyter notebook tutorial is available at: http://biocore.github.io/calour/notebooks/microbiome_databases.html.
The module also works with EZCalour, the full GUI version of Calour, (https://github.com/amnona/EZCalour). A tutorial for dbBact enrichment analysis using EZCalour is available at: https://github.com/amnona/EZCalour/blob/master/using-ezcalour.pdf.
QIIME2 plugin
The q2-dbBact plugin (https://github.com/amnona/q2-dbbact) enables dbBact annotation-based analysis using the QIIME2 framework (34). The interface provides term enrichment analysis for the output of various QIIME2 differential abundance plugins (ANCOM (48), Songbird (49), ALDEx2 (50), DACOMP (51), or a rank-mean method). Additionally, the plugin supports dbBact term word cloud and interactive heatmap generation.
Standard analysis: default dbBact preprocessing of an experiment
Although dbBact is a wiki-style knowledge base, the vast majority of annotations in dbBact release 2022.07.01 was added by the dbBact team. Studies were selected from published microbiome papers, and annotations were added following the re-processing of the experimental data, using a ‘standard’ manual analysis pipeline as follows:
The raw data of each scientific paper (i.e. per-sample FASTA files and corresponding metadata) were downloaded using the provided accession (e.g. by SRA/ENA accession or Qiita (20) study ID). When data or metadata were not available, the authors were contacted and provided the missing data directly. When primer sequences were part of the reads, they were removed using a custom script (https://github.com/amnona/GetData). Subsequently, the Deblur pipeline (14) was applied to the reads of each sample (Deblur script version 1.1.0, using default parameters, https://github.com/biocore/deblur), resulting in a denoised biom table. Since dbBact annotations focus on biologically relevant sequences, rare ASVs have a minor effect. Hence, similar results would be obtained using DADA2 (15) instead of Deblur (Supplementary Figure S19).
This biom table, together with the per-sample metadata, were manually re-analyzed using Calour (43), to add annotations capturing biological conclusions arising from the study (see ‘Calour implementation’ section in Supplementary Methods). Initially, samples having less than 1000 reads were removed, and samples were normalized using total sum scaling (i.e. dividing ASV counts in each sample by the sample total reads (52)) to obtain the relative abundance of each ASV in the given sample. Three types of predicates were sought:
‘DIFFERENTIAL:’ To detect sets of sequences associated with relevant conditions (e.g. sick vs. healthy), sequences significantly enriched between two conditions were identified using the Calour diff_abundance() method, a non-parameteric permutation based rank-mean test. Briefly, diff_abundance() first ranks each feature (sequence) across the samples (using the per-sample relative abundance of the feature), and then calculates the difference between the mean of the ranks across the two sample groups. This value is compared to the analogous values following 1000 random permutations of the sample group labels, and a corresponding p-value is calculated. Following the per-sequence p-value calculation, a multiple hypothesis correction is performed across all sequences using dsFDR (53), controlling the false positive fraction to less than 0.1. dsFDR is a permutation-based variant of the Benjamini-Hochberg (BH) approach (54) adapted to microbiome data, which are typically sparse and originate from a limited number of samples (see Supplementary Methods section ‘dsFDR multiple hypothesis correction’). Correlations with continuous metadata fields (e.g. body mass index - BMI) were detected with a permutation-based Spearman test with dsFDR correction using calour.correlation(), which is implemented similarly to the diff_abundance() function, but using the Spearman correlation as the test statistic. In both cases, the set of sequences of higher or lower relative abundance in one condition than in the other were then annotated as ‘DIFFERENTIAL,’ i.e. ‘HIGHER IN’ condition 1 and ‘LOWER IN’ condition 2. Other differential abundance methods, such as compositionality-aware tests, can also be used for differential annotations. The specific method applied is stored within each annotation.
‘COMMON’/‘DOMINANT:’ For each study, sequences present in more than half of the relevant samples were annotated as ‘COMMON.’ ‘DOMINANT’ sequences were identified as sequences whose mean relative abundance in the relevant samples was higher than 0.01. In studies containing samples from multiple sources (i.e. fecal and saliva samples, or samples from individuals from several countries or disease vs. healthy), a ‘COMMON’/‘DOMINANT’ annotation was added separately to each source subset.
‘CONTAMINANT:’ Indicates candidate reagent-related contaminants, especially in low biomass samples. For example, when a study contained a set of negative control (blank) samples, ASVs showing higher relative abundances in these controls than in the non-blank samples were manually annotated as a possible ‘CONTAMINANT’.
Examples of the different predicates appear in Table S3.
Remark: Using the abovementioned pipeline is not a prerequisite for adding new annotations, and any denoising method followed by statistical analyses can be applied by users contributing to dbBact.
Statistical analysis in dbBact
Word cloud generation
Calculating a term's F1score: Given a set of query sequences|$S$|, each dbBact term|$t$| is assigned an F1 score, corresponding to the harmonic mean of precision and recall. For each sequence |$s$| in |$S,$| we calculate the fraction of |$s$|’s annotations that contain the term|$t$|. The average of these values across |$S$| provides the precision of |$t$| on |$S$|. Similarly, for a given sequence|$s$| and a term|$t$|, recall is calculated as the fraction of |$t$|’s annotations that contain |$s$|. To suppress terms that appear in a small number of experiments, the total number of |$t$|’s annotations (i.e. the denominator) is artificially increased by 1. The average of these values across |$S$| provides the recall of |$t$| on |$S$|.
Displaying a word cloud. The word cloud size of each term is proportional to its F1 score. If the term appears in ‘LOWER IN’ annotations, its color is orange, otherwise it is blue. The brightness of each term represents the number of experiments containing the term, indicating the reliability of the term (white for a single experiment; ranging to dark blue/orange for > = 10 experiments).
Word clouds were generated with the dbBact-Calour module for Calour (https://github.com/amnona/dbbact-calour) using the draw_wordcloud() function.
Term enrichment analysis
Given two sets of sequences, |$S1$| and |$S2$|, we search for terms significantly enriched in either group using the following steps:
Calculating an annotation-based score per sequence and term. Each annotation|$a$| in dbBact is assigned a ‘weight’ |$w( a )$| according to its predicate. The predicates ‘COMMON,’ ‘CONTAMINATION,’ and ‘DIFFERENTIAL’ are assigned a weight of 1, and the predicates ‘DOMINANT’ and ‘OTHER’ are assigned a weight of 2 and 0.5, respectively. These weights are applied to calculate a score |$Score( {s,t} )$| for each term|$t$| in dbBact and a sequence|$s$| in either |$S1$| or |$S2$|. The score sums the weights of all annotations involving |$s$| and |$t$|. When |$t$| appears as ‘LOWER IN’ in the predicate ‘DIFFERENTIAL,’ a new term ‘not |$t$|’ is created and assigned a weight of 1.
Calculating effect size of a term. For a term|$t$|, |$Score( {s,t} )$| is calculated for all sequences in |$S1$| and |$S2$|, and the effect size of |$t$| is defined as |$e( t ) = | {( {\frac{{\mathop \sum \nolimits_{s \in S1} Score( {s,t} )}}{{| {S1} |}} - \frac{{\mathop \sum \nolimits_{s \in S2} Score( {s,t} )}}{{| {S2} |}}} )} |$| where |$| S |$| corresponds to the number of sequences in the set |$S$|. Throughout this paper, and also in the dbBact plugins, the scores for each term are rank transformed (across sequences) prior to calculating the effect size, and therefore an additional normalization is applied: |$e( t ) = 2| {( {\frac{{\mathop \sum \nolimits_{s \in S1} rank( {Score( {s,t} )} )}}{{| {S1} |}} - \frac{{\mathop \sum \nolimits_{s \in S2} rank( {Score( {s,t} )} )}}{{| {S2} |}}} )} |/( {| {S1} | + | {S2} |} )$|.
Finding significant terms. Each term is assigned a p-value by comparing its scores over 1000 random permutations of the combined |$S1$| and |$S2$|sequences to sets of size |$| {S1} |$| and |$| {S2} |$| using the calour.diff_abundance() method described above, including a dsFDR multiple hypothesis correction (with a threshold of 0.1), to detect significant terms.
Calculating the significance of a term across experiments. Until this stage, we measured the enrichment of a term based on all dbBact experiments combined. To estimate whether such significance occurs across multiple experiments, or whether it is driven by a single or a few experiments, steps (a)-(c) were also repeated using each individual experiment that contains |$t$|. The total number of experiments containing each term and the fraction in which the term was significant appear in each figure.
The abovementioned analysis is performed using the dbbact-calour module enrichment() function.
An alternative term enrichment method that uses all ASVs in each group of samples, weighted by their relative abundances in each sample, is described in the Supplementary Methods (Supplementary Figure S21).
Venn diagrams
Given two sets of sequences, |$S1$| and |$S2$|, and a term|$t$|, we plot a Venn diagram indicating the number of sequences associated with |$t$| across all dbBact annotations, and the overlap of these sequences with |$S1$| and |$S2$|.
Venn diagrams were generated using the dbbact-calour module plot_term_venn_all() function.
dbBact term-based principal component analysis
Each sample |$x$| is represented by a vector of sequences’ relative abundances (abbreviated ‘sf’), |$x( S ) = ( {s{f}_1,s{f}_2,\ \ldots ,\ s{f}_n} )$| across the |$n$|sequences that appear in all study samples (|$sf$| equals zero in case a sequence does not appear in a specific sample). We then transform |$x( S )$| into a term-based representation of |$x$|, i.e. |$x( T ) = ( {t{s}_1,t{s}_2,\ \ldots ,\ t{s}_m} )$|, where each |$ts$| is a term-score described below, calculated across all |$m$| dbBact terms. The |$ts$| score for the term|$t$| is given by |$ts = \mathop \sum \limits_{i = 1}^n s{f}_i \cdot precision( {i,t} )$|, where |$precision( {i,t} )$| is the fraction of annotations associated with sequence|$i$| that also contain the term|$t$|. Finally, once |$x( T )$| is calculated over all samples in a study, we perform principal component analysis of this space. Each principal axis is defined by its weights, where the highest weights (in absolute value) are used for providing biological meaning.
The abovementioned analysis is performed using the dbbact-calour module plot_term_pcoa() function.
Processing of datasets
All datasets discussed in the paper were processed using the following pipeline: raw reads were downloaded and denoised using the Deblur pipeline (14) with default parameters; the resulting denoised biom table was loaded into Calour (43), and differentially abundant bacteria were identified using a permutation-based non-parametric rank mean test with dsFDR multiple hypothesis correction (53) set to 0.1 (using the calour diff_abundance() method). In the case of the American Gut Project dataset, multiple samples originating from the same individual were aggregated to a single sample using mean relative abundance for each ASV. The groups of high and low fruit consumption were controlled for confounders by stratifying samples in both groups based on the AGP metadata fields: age category (‘AGE_CAT’), sex and BMI category (‘BMI_CAT’), and randomly dropping samples to equalize the number of samples from each stratum prior to differential abundance testing. dbBact term word clouds were generated by applying the above-described word cloud approach using the dbbact-calour module draw_wordcloud() method on all sequences present in at least 30% of the samples. Term enrichment was performed using the above-described term enrichment approach using the dbbact-calour module enrichment() method with default parameters (dsFDR = 0.1). dbBact term PCAs were generated using the dbbact-calour module plot_term_pcoa() function. Accession numbers for each dataset used are available in Supplementary File 2. Jupyter notebooks used for the creation of each figure are available at https://github.com/amnona/dbbact-paper.
RESULTS
We first present general statistics of dbBact and display its comprehensiveness. We then demonstrate the importance of ASV-based associations and provide a detailed example of a dbBact-based analysis. Finally, we summarize biological insights across various habitats derived by dbBact analysis of 16 published papers. As dbBact is continuously growing, and to allow readers to recreate the figures presented in this paper, all results presented in this section are based on a ‘freezed’ dbBact release 2022.07.01 that contained 913 unique experiments.
dbBact: scope and comprehensiveness
dbBact release 2022.07.01 contains approximately 345000 unique bacterial amplicon sequences, an amount that is on par with the 300000 sequences observed by the Earth Microbiome Project (11). Sequences arise from over 900 unique experiments, i.e. studies from which observations were added (Figure 3A). Over 7000 dbBact annotations associate these sequences with various phenotypes using ontology derived terms. As each annotation typically includes many sequences, this results in over 1400000 unique genotype-phenotype associations.
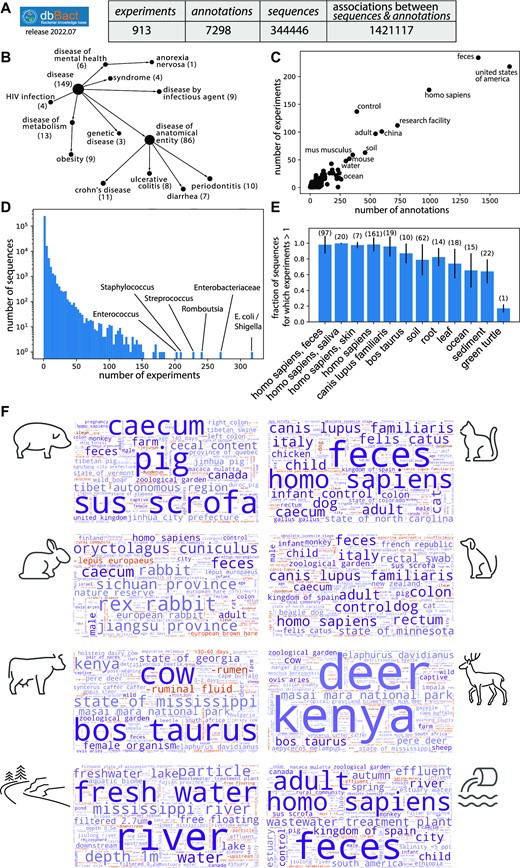
The scope and comprehensiveness of dbBact. A. Scope of dbBact release 2022.07 (used for the analysis presented in this paper). B. The number of experiments for representative disease categories based on the DOID ontology. C. Scatter plot of the total number of annotations and experiments in which each dbBact term appears. D. Histogram of the number of experiments in which each dbBact sequence appears. E. Knowledge base comprehensiveness. The fraction of ‘COMMON’ sequences from each experiment that have been annotated in additional experiments is shown for various terms. The number of experiments containing the term is designated above each bar. F. Comprehensiveness in a source tracking task. Sequences from eight sample types from Hägglund et al. were blindly submitted to dbBact. Their word clouds clearly display the sources of the samples (shown by the matched cartoon). Term sizes correspond to the F1 score of each term, combined for all sequences present in > 0.3 of the samples (for each sample type).
General statistics of dbBact
The dbBact experiments cover a wide range of habitats (Supplementary Figure S1a), geographic regions (Supplementary Figure S1b), plant and animal hosts (Supplementary Figure S1c), human body sites (Supplementary Figure S1d), and human diseases (Figure 3B). For example, 149 experiments cover diseases, of which 86 are of an anatomical entity (e.g. Crohn's disease or ulcerative colitis), and seven more are defined as metabolic diseases. The most abundant dbBact terms are ‘united states of america,’ ‘homo sapiens,’ and ‘feces,’ each appearing in over 1000 annotations arising from more than 150 different experiments. Most of the other terms appear in less than twenty experiments (Figure 3C). The most prevalent bacterial sequence is E. coli, appearing in over 900 annotations from over 300 experiments (Figure 3D). Although this could reflect the universality of E. coli in various habitats, it may also be due to potential contaminations (55), a reason that may also explain the high prevalence of Staphylococcus (appearing in over 200 dbBact experiments). The number of experiments per sequence follows a power law distribution, with a majority of sequences appearing in a single experiment, yet over 80000 sequences were observed in more than one experiment and 7000 sequences appeared in at least ten experiments (Figure 3D).
dbBact allows the upload of sequences from several commonly used regions (V1-V2, V3-V4 or V4; see Table S2 for a list of primers). Upon upload, sequences from different regions are ‘linked’ through their full-length 16S rRNA sequence in the SILVA database (see Inter-region querying section in Methods). When submitting query sequences from one region, dbBact retrieves all annotations containing the corresponding sequences across all regions (including, naturally, the region from which the query was provided). To demonstrate the usefulness of such ‘linking,’ Supplementary Figure S2 provides several examples of V1-V2 and V3-V4 sequence queries that are successfully characterized based solely on ‘linked’ V4 sequences. The figure also benchmarks ‘linking’ using sets of fecal and ocean water samples each sequenced by V1-V2, V4 and V3-V4.
Comprehensiveness of dbBact
Intra-dbBact estimates. To estimate the comprehensiveness of dbBact, we tested how many bacterial sequences typical of a specific environment (e.g. human feces) have annotations arising from more than one experiment. We selected sequences having an annotation of type ‘COMMON’ (i.e. present in more than half of the samples in an experiment) for each of several terms, and measured the fraction of these sequences that have annotations from another dbBact experiment (Figure 3E). For example, there are 97 experiments having a ‘COMMON IN homo sapiens feces’ annotation. Iterating over each of these annotations, about 98% of the associated sequences appear in more than one experiment. Hence, fecal bacteria are already well covered by dbBact. A similar level of ‘coverage’ occurs for several other human-related terms and for dogs, where almost all sequences were observed in more than a single experiment. Regarding the terms ‘cow,’ ‘soil,’ ‘root,’ and ‘leaf,’ about 80% of the sequences appear in more than a single experiment, whereas the ‘coverage’ of ‘green turtle’ is much lower, indicating that additional experiments are required to capture its full bacterial diversity.
Out-of-sample comprehensiveness. As another example of comprehensiveness, dbBact was tested in a source tracking task, i.e. identifying the host or niche of a sample based on its bacterial composition. Hägglund et al. collected samples from either sewage influent or from freshwater, as well as feces sampled from several animals (rabbit, cat, wild boar, dog, cow and deer), aiming to find unique bacterial footprints of each source (56). We used all sequences present in more than 1/3 of the samples from each group as queries to dbBact resulting in word clouds describing each sample group (Figure 3F). In almost all cases, the notable terms in each word cloud were indicative of the sources of the samples, e.g. sus scrofa for the wild boar fecal sample, allowing accurate source tracking. The only exception was cat fecal samples, which were detected as a combination of cat, dog, and human, probably because of the small number of cat fecal samples present in the current dbBact release.
The advantage of sequence-based associations
Results of 16S rRNA profiling experiments comprise a list of ASVs found in each sample and their abundances. Corroboration of these results with other microbiome studies is typically performed by searching published studies mentioning the taxonomy of these sequences. In many cases, however, such text-based mining may be limited because of constraints in taxonomic assignment. First, taxonomy is far from being full, e.g. species-level assignment is missing for about 80% of 16S rRNA sequences in Greengenes (57), and about 35% of the Greengenes sequences lack a genus assignment (58). Second, in many cases the same assigned taxonomy may be associated with vastly different phenotypes. As observed by the Earth Microbiome Project, bacteria of the same genus may be present in vastly different habitats, whereas specific sequences are associated with a certain habitat (11). This phenomenon underscores the importance of sequence-based association as provided by dbBact. For example, both sequences in Figure 4A belong to the genus Blautia, hence taxonomy-based associations may conclude that they play similar ‘roles’ and are associated with the same phenotype. But querying dbBact with each of these two sequences results in a strikingly different picture, which we refer to as a ‘good’ and ‘bad’ Blautia. The ‘good’ Blautia is more abundant in healthy controls than in patients of type 1 diabetes (T1D), Crohn's disease (CD), inflammatory bowel disease (IBD), diarrhea, and kidney stones (Figure 4A), whereas the ‘bad’ Blautia is more prevalent in patients suffering from IBD, CD and ulcerative colitis (Figure 4B).
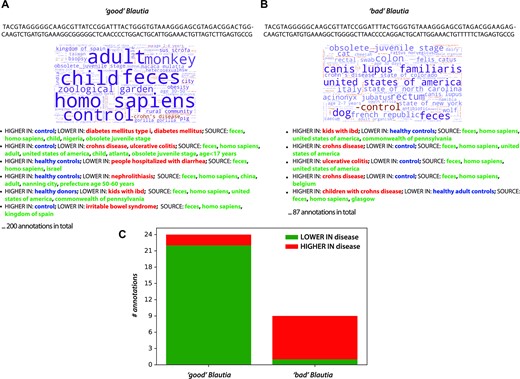
Sequence-based analysis provides more accurate genotype-to-phenotype associations compared to taxonomy-based associations. A,B. Two ASVs of the genus Blautia, that differ by nine bases over the 150nt Illumina read of the 16S rRNA V4 region are associated with opposite phenotypes, as discovered by dbBact. The two word clouds and annotations for each ASV, display ‘opposite’ associations with disease. The left ASV (A) is more prevalent in healthy subjects (‘good’ Blautia), whereas the other (B) is highly abundant in a series of disease-related annotations. Such differences can be traced through dbBact, but are completely missed by a taxonomy-based analysis. C. The number of disease-related annotations for the two Blautia ASVs across dbBact displays an opposite trend of being low and high in disease, for the ‘good’ and ‘bad’ Blautia, respectively. The total number of annotations in dbBact 2022.07.01 associated with the ‘good’ and ‘bad’ Blautia sequences is 377 and 124, respectively.
Collecting all ‘disease’ related dbBact annotations shows that the ‘bad’ Blautia is ‘HIGHER IN’ in the disease group (compared to controls) in 8/9 disease annotations associated with it, whereas the ‘good’ Blautia is ‘LOWER IN’ in the disease group (compared to controls) in 22/24 disease annotations (Figure 4C). Therefore, sequence-based analysis provides a solid genotype-to-phenotype association compared to taxonomy-based associations.
dbBact provides a pan-microbiome view: detailed example
dbBact may add another layer to data analysis in microbiome studies by identifying commonalities between different conditions and diseases, generating novel biological hypotheses. To demonstrate such a pan-microbiome analysis, we use data from a study comparing subjects consuming a calorie restricted diet to those without dietary restrictions (59), and demonstrate the use of dbBact term enrichment.
Fecal samples from two groups of lean individuals (body mass index, BMI < 25) who either followed a caloric restriction diet (CR) or did not have dietary restrictions (AMER) were selected. Standard analysis with FDR set to 0.1 (see ‘standard analysis’ section in Methods) identified 28 and 141 bacterial sequences significantly more abundant in AMER and CR cohorts, respectively (Figure 5A). For clarity, we refer to these groups of sequences as S-AMER and S-CR, respectively. Figure 5B shows the internal ‘transformation’ performed by dbBact from a heatmap of bacterial relative abundances to a heatmap of association scores of terms for each sequence (columns in Figure 5A-B are aligned and correspond to the same sequences). For example, the term ‘high BMI,’ appears in almost all S-AMER sequences, while it is almost absent in S-CR sequences. These association scores in Figure 5B are then used as input to a non-parametric differential abundance test (see Methods section ‘statistical analysis in dbBact’), identifying terms significantly enriched in each of the two sequence groups (Figure 5C). Results indicate that sequences in the S-CR group are associated with terms related to low BMI (‘low bmi,’ ‘LOWER IN high bmi’) and with rural/undeveloped habitats (‘LOWER IN united states of america,’ ‘small village’) (see Supplementary File 4 for the full list of enriched terms). By contrast, bacteria from the S-AMER group have a significantly higher number of annotations related to high BMI (‘LOWER IN low bmi,’ ‘high bmi’) and urban/modernized habitats (‘state of oklahoma,’ ‘LOWER IN rural community,’ ‘LOWER IN small village’).
Thus, although participants from both diet groups were lean, certain aspects of the underlying microbiome were associated with high and low BMI bacteria, for AMER and CR, respectively. Additionally, bacteria enriched in CR vs. AMER tend to be associated with rural/undeveloped habitats, which may indicate an adaptation of some bacteria found in rural communities to a low-calorie/higher vegetable diet content.
To further confirm the relationship between diet and BMI, we collected all sequences across dbBact having a ‘high bmi’ annotation, resulting in 319 sequences. The overlap between these sequences and the S-AMER and S-CR groups is shown in Figure 5D (left). Although 93% (26/28) of S-AMER sequences overlap with ‘high bmi’-associated sequences, the overlap of S-CR sequences is 11% (15/141), i.e. a much larger fraction of S-AMER sequences is associated with high BMI. An analogous Venn diagram for the term ‘low bmi’ displays an overlap of 54% (15/28) and 78% (110/141) of S-AMER and S-CR bacteria with ‘low bmi’-associated bacteria in dbBact, respectively (Figure 5D left). As participants from both CR and AMER groups were lean (BMI < 25), one may hypothesize that the effect of BMI on the microbial composition, observed in various studies, is due to dietary differences rather than the high BMI phenotype.
Remark regarding spurious/irrelevant terms: dbBact release 2022.07.01 contains annotations of approximately 6500 unique terms, some appearing only in a few experiments. As a result, word clouds and bar plots may often include seemingly odd terms. For example, the term ‘state of oklahoma’ in Figure 5D is significantly enriched in S-AMER, a fact that seems implausible. This term appears only in two dbBact experiments, one of which compared a rural community in Peru to an urban community in Oklahoma (60). Hence, annotations from this experiment mentioned the term ‘state of oklahoma’ together with more relevant terms (e.g. ‘rural community’) which, in turn, caused its inclusion. As dbBact continues to grow, such ‘transient’ irrelevant inductions are expected to diminish.
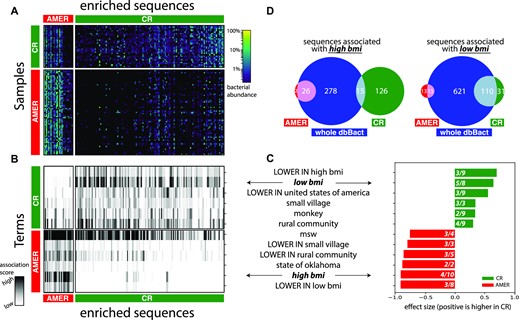
dbBact links caloric restriction associated bacteria to other phenotypes. A. Heatmap displaying bacterial relative abundances across fecal samples (rows) of low BMI individuals (BMI < 25) practicing either a caloric restriction diet (CR, n = 33) or without dietary restrictions (AMER, n = 66), over a set of sequences (columns) that are significantly higher in either group. A differential abundance test (rank-mean test with dsFDR = 0.1 multiple hypothesis correction) identified 136 bacteria whose relative abundance was higher in the CR group (S-CR) and 27 bacteria higher in the AMER group (S-AMER). B. dbBact terms (rows) enriched in the sequences appearing in panel A (columns in panels A and B are aligned). Heatmap values indicate the term score for each bacterium. Terms were identified using a non-parametric rank mean difference test with dsFDR = 0.1 (top 6 terms for each direction are shown; see Supplementary File 4 for full list of enriched terms). C. Summary of the top enriched terms in the CR and AMER diets (green and red bars, respectively). Bar length and numbers are as in Figure 2. D. Venn diagrams of dbBact annotations related to the terms ‘low bmi’ (right) and ‘high bmi’ (left). Green and red circles indicate the number of sequences associated with the term in the CR and AMER diets, respectively; the blue circle indicates the number of such sequences across dbBact as a whole. The intersections of ‘low bmi’ bacteria with the CR group are significantly higher (p = 7E-5, using two-sided Fisher's exact test), confirming the association. Similarly, the intersection of ‘high bmi’ annotated sequences across dbBact with the AMER group is significantly higher than that with the CR group (p = 3E-17, using two-sided Fisher's exact test).
Integrating dbBact into microbiome analysis pipelines allows generating novel biological hypotheses
To demonstrate how dbBact may be incorporated into microbiome analysis pipelines, we chose 16 dbBact experiments, excluded them from dbBact, then analyzed their results in the same way researchers would look at their own studies. In each of these studies, dbBact provided novel hypotheses that did not appear in the original paper and could not be formulated by standard methods.
The experiments presented here were chosen almost arbitrarily to provide examples from different habitats and niches: the human host, animals, and environmental samples (Figure 6A). dbBact-derived hypotheses may be divided into several ‘types,’ as follows.
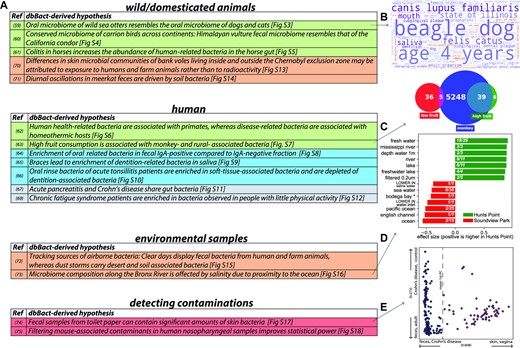
dbBact leads to novel biological hypotheses. A. Summary of biological hypotheses derived from dbBact-based analysis of published studies. Details of each analysis are given in the corresponding Supplementary Results section. Row colors correspond to hypothesis ‘type’ (inter-host similarities – green; intra-host similarities – blue; inter-disease similarities – gray; environmental sources – brown; contamination detection – red). B-E. Analysis results related to conclusions shown in panel a. B. dbBact term word cloud for sequences found in sea otter oral samples shows resemblance to dogs’ and cats’ samples. C. Venn diagram showing number of dbBact sequences associated with the term ‘monkey’ across dbBact (blue), and their intersection with sequences found in individuals from the American Gut study, who consume a high (green) and low (red) number of fruits per week. Sequences in the high-fruit consumption group are significantly more associated with the term ‘monkey’ (Fisher's exact test p-value < 0.00001). D. dbBact term enrichment comparing water samples collected in Hunts Point and Soundview Park, along the Bronx River in New York. Sequences whose relative abundance was higher in Hunts Point (green, located upstream) show significant fresh-water-related term enrichment (dsFDR = 0.1). E.Term-based principal coordinate analysis (PCA) of fecal samples of one individual collected daily for one year. The first principal component is the ‘feces-skin’ axis, where higher values correspond to ‘skin’ (see Methods for details). The values of a subset of samples, shown in magenta, is high, indicating possible skin-derived contamination in these fecal samples.
Detecting inter-host similarities: dbBact can identify unexpected similarities in microbial populations across hosts. (i) For example, when examining the oral microbiome of wild sea otters (61), dbBact indicates a high similarity to the microbiome of the oral cavity of dogs and cats (Figure 6B and Supplementary Figure S3). (ii) In another example, fecal bacteria of Himalayan Griffons (62) are found to be similar to those of another carrion feeder, the California Condor (Supplementary Figure S4). (iii) Such inter-host similarities are also observed for disease-related bacteria. Examining bacteria in colitis in horses (63), dbBact detects an enrichment of human-associated bacteria, indicating a possible colonization by bacteria that are less host-specific (Supplementary Figure S5). (iv) Another recent meta-analysis of various human diseases identified shared disease-related bacteria in multiple diseases (64). When examining non-human-related annotations, dbBact finds these bacteria to be enriched in non-primate, homeothermic animals (mouse, horse, rat, chicken). By contrast, health-related bacteria found in this study are enriched in monkey-associated terms (Supplementary Figure S6). This may indicate the disappearance of host-specific bacteria in multiple diseases, together with the appearance of more generalist bacteria. (v) A similar enrichment in monkey-associated bacteria and rural-community related terms is observed in individuals from the American gut project (7) who report high consumption of fruits, compared to those reporting low consumption (Figure 6C and Supplementary Figure S7).
Detecting intra-host similarities: dbBact can identify similarities within hosts. (i) For example, Scheithauer et al. (65) profiled the bacteria detected in the IgA-positive and IgA-negative fractions of fecal samples. dbBact-based analysis shows that the IgA-positive fraction is enriched in oral related terms, indicating a possible contribution of oral IgA to bacterial antibody coating (Supplementary Figure S8). (ii) In another study (66), dbBact finds an enrichment in dentition-related terms in an oral rinse of adolescents with braces compared to an enrichment in soft-tissue-associated bacteria in those that do not wear braces (Supplementary Figure S9). (iii) Such soft-tissue-associated bacteria are also observed when analyzing Yeoh et al. data (67) of tonsilitis patients (Supplementary Figure S10).
Detecting inter-disease similarity: (i) Zhu et al. compared the fecal microbiome of acute pancreatitis patients with that of healthy controls (68). dbBact-based analysis hints at a common gut response between pancreatitis and diarrhea, and Crohn's disease, i.e. a phenomenon of general dysbiosis formerly suggested by Duvallet et al. (69) (Figure S11, Supplementary Files 5,6). (ii) Giloteaux et al. (44) compared fecal samples of chronic fatigue syndrome patients with those of healthy controls. dbBact finds shared sequences between these patients and individuals who do little physical activity (Supplementary Figure S12).
Detecting environmental sources: dbBact can detect the sources of bacterial communities. (i) For example, Lavrinienko et al. collected skin swabs of bank voles inside the uninhabited Chornobyl exclusion zone and outside the contaminated region in the outskirts of Kyiv (70). dbBact-based analysis shows an overrepresentation of soil- and plant-related bacteria inside the exclusion zone, while skin bacteria of bank voles near Kyiv were enriched in human and farm animal terms. This leads to the hypothesis that the difference between the two sample groups is due to contact with humans and farm animals rather than to exposure to radioactivity (Supplementary Figure S13). (ii) Similarly, Risely et al. (71) observed strong diurnal oscillations in the microbiome composition of South African wild meerkats’ fecal samples. dbBact-based analysis indicates that this effect is driven by a large number of soil/rhizosphere-related bacteria appearing in the afternoon fecal samples (Supplementary Figure S14). (iii) dbBact analysis of air samples taken by Gat et al. (72) during clear days in Israel shows human-associated and farm-associated terms as a source of air bacteria, compared to samples taken during a dust storm, which display desert and soil-associated bacteria (Supplementary Figure S15). Hence, fecal bacteria from human and farm animals are airborne during ambient weather conditions, whereas dust storms bring over desert and soil associated bacteria. (iv) Finally, analysis of river water samples in two locations near the Bronx River estuary (73) shows that the difference in bacterial communities in these two locations is partially explained by ocean vs. freshwater bacteria, probably related to the salinity levels in the two sample locations (Figure 6D and Supplementary Figure S16).
Detecting potential cross-sample contaminations: dbBact allows the straightforward detection of potential contaminants. Each bacterium in a study may be assigned its best fitting dbBact term, thus ‘awkward’ bacteria may be detected and discarded from downstream analysis. (i) Caporaso et al. (74) followed the oral, skin, and fecal microbiome of an individual using daily samples for a year. dbBact-based analysis detected a group of skin-associated sequences in a subset of fecal samples, indicating a potential contamination (Figure 6E and Supplementary Figure S17). (ii) Similarly, in a dataset of infant nasopharyngeal samples (75), we observed a cluster of mouse-associated sequences (Supplementary Figure S18), which may be attributed to a contamination or to low biomass kit-related bacteria. As these mouse-associated sequences are evenly spread across the sample types, they did not introduce a systemic bias in the authors’ results. But removal of the sequences before downstream analysis reduces inter-sample noise and increases the statistical power (Supplementary Figure S18c,d). In addition, dbBact can detect reagent-borne contaminants using sequences flagged as ‘CONTAMINANT’ (Supplementary Figure S20). Identifying ASVs as reagent-borne or potentially originating from cross-sample contamination may be context-dependent, and therefore should not be performed automatically (Supplementary Figure S20).
DISCUSSION
dbBact integrates 16S rRNA microbiome studies into a collaborative, coherent body of knowledge that facilitates pan-microbiome analysis of new studies using a rigorous statistical and algorithmic framework.
An important advantage of dbBact, compared to standard meta-analysis methods, is that the latter may suffer from the ‘streetlight effect’ (76). For example, when examining the effect of fruit consumption in the American Gut Project (Figure 6A), one might consider including other diet-related studies in the meta-analysis. But this would miss the link between high fruit consumption and primate-associated bacteria. dbBact retrieves annotations from a wide range of sample types and habitats, providing additional and potentially unexpected insights into the biological contexts in which specific bacteria appear.
Terms in dbBact annotations are based on ontologies, providing a common language for phenotype description. The tree structure of ontologies facilitates the discovery of commonalities between bacteria in studies conducted under similar, albeit not identical, conditions. For example, data from Crohn's disease and ulcerative colitis experiments may be combined based on their ontological ‘parent’ term ‘inflammatory bowel disease.’ Moreover, many ‘cross-sectional’ questions may be asked and possibly answered using dbBact. For instance, what terms are similar with respect to their bacteria (e.g. are dogs more similar to cats or to wolves?), or are there connections between phylogeny and specific phenotypes (e.g. does genus X appear only in host Y or in geographic location Z?).
Apart from putting forth novel hypotheses, dbBact makes possible the detection of sources of bacterial groups. We recommend querying dbBact as a first step in any microbiome analysis (e.g. using the interactive heatmap of the dbBact-Calour module). Identifying relevant bacterial groups and their dbBact annotations fosters an initial understanding of biological processes, supporting better downstream analysis. dbBact also enables detecting potential cross-sample contaminations. We have encountered numerous cases where examining ASVs in a study identified bacteria of another origin (e.g. ‘mus musculus’ annotations in human samples). Removing these sequences prior to downstream analysis can remove biases and increase the statistical power. In addition, using the ‘CONTAMINANT’ annotation dbBact may detect reagent-borne contaminants. However, we emphasize that identifying bacteria as reagent-borne or potentially originating from cross-sample contamination may be context-dependent, and therefore should not be performed automatically (Supplementary Figure S20).
The current coverage of dbBact is high in a large number of habitats, but many other habitats are still poorly covered (e.g. Figure 3E). Therefore, terms appearing in a small number of annotations may lead to dubious conclusions. For example, dbBact contains a single experiment originating from a scrubland environment. This experiment profiled the leaf microbiome of ivy plants, hence, querying a set of ivy leaf-related bacteria may result in the enrichment of both ‘ivy’ and ‘scrubland’ terms. Therefore, to avoid incorrect conclusions, users are advised to further examine the set of experiments associated with each enriched term. As the number and diversity of experiments in dbBact increase, such spurious terms are expected to be suppressed. Tens of microbiome studies are published weekly, but the dbBact team can process only a fraction. We believe that researchers may benefit from uploading their studies to dbBact, as contributing annotations increases the impact of a study by enabling other researchers to use its results. We, therefore, hope the microbiome community will contribute to dbBact and help increase the number and diversity of uploaded studies. We intend to encourage such efforts and are committed to providing proper training and support to the community. As the number of contributors grows, annotations’ quality may vary, and hence dbBact curators would review new annotations. In addition, dbBact enables users to flag potentially incorrect annotations, for later inspection by the dbBact team.
dbBact may also be used in shotgun metagenomics studies. Whenever 16S rRNA sequences are inferred from shotgun data they may be submitted as queries or uploaded to dbBact. The ‘linking’ mechanism for harmonizing studies from different variable regions enables shotgun and amplicon studies to be integrated into one coherent knowledge base. Similarly, studies using long read technologies (or synthetic long reads) also provide full-length 16S rRNA sequences, and thus can be integrated into dbBact in the same manner.
In conclusion, dbBact augments current microbiome analysis pipelines by systemically and comprehensively examining the contexts associated with each ASV. Examining the key terms associated with a study's ASVs, by word clouds or term-based PCA, unravels the general factors shaping microbial communities, sometimes pointing to unexpected cross-habitat similarities. Term enrichment across different sample groups can be statistically analyzed, potentially leading to better understanding of the underlying processes affecting the differences between these groups. Also, contamination-associated ASVs can be identified and potentially excluded from downstream analysis.
In sum, dbBact introduces a new ‘layer’ of data analysis in microbiome studies. We believe that the large scope, ontology-based structure and associated statistical methods of dbBact provide new means for studying core factors affecting bacterial communities, possibly answering questions that could not have otherwise been asked.
Data Availability
dbBact website http://dbbact.org
dbBact website source code https://github.com/amnona/dbbact-website (DOI: 10.5281/zenodo.7961853)
dbBact REST-API server api.dbbact.org
Documentation for the REST-API api.dbbact.org/docs
Examples for using the REST-API interface https://github.com/amnona/dbbact-examples (DOI: 10.5281/zenodo.7958467)
Source code for the REST-API server https://github.com/amnona/dbbact-server (DOI: 10.5281/zenodo.7961828)
Source code for the REST-API sequence translation server https://github.com/amnona/dbbact-sequence-translator (DOI: 10.5281/zenodo.7961754)
Jupyter notebooks for figures presented in the paper https://github.com/amnona/dbbact-paper (DOI: 10.5281/zenodo.7958481)
Weekly dump of the complete dbBact database (excluding user details) https://dbbact.org/download
dbBact v2022.07.01 database dump (used for the examples in the paper) (DOI: 10.5281/zenodo.7961961)
dbBact-calour plugin https://github.com/amnona/dbbact-calour (DOI: 10.5281/zenodo.7961875)
Qiime2 dbBact plugin https://github.com/amnona/q2-dbbact (DOI: 10.5281/zenodo.7961750)
SUPPLEMENTARY DATA
Supplementary Data are available at NAR Online.
ACKNOWLEDGEMENTS
We wish to thank Tzipi Brown and Rotem Hadar from the Sheba Microbiome Center, Zhenjiang (Zech) Xu, Jon Sanders, Qiyun Zhu, Tomasz Kosciolek, Stefan Janssen and Jeremiah Minich for fruitful discussions, feedback, and suggestions.
Author contributions: Conceptualization, A.A. and N.S.; Methodology, A.A., N.S. and E.O.; Software, A.A. and E.O.; Validation, A.A. and N.S.; Formal Analysis, A.A. and N.S.; Resources, A.A., N.S. and Y.H.; Data Curation, A.A.; Writing – Original Draft, A.A. and N.S.; Writing – Review & Editing, A.A., N.S. and Y.H.; Visualization, A.A. and N.S.; Funding Acquisition, N.S. All authors read and approved the final manuscript.
FUNDING
N.S. is funded by the Ministry of Science, Technology & Space, Israel [3-16033]. Funding for open access charge: Open university internal fund.
Conflict of interest statement. None declared.
REFERENCES
Author notes
Joint Authors.

Comments