


Abstract
The RNA recognition motif (RRM) occurs widely in RNA-binding proteins, but does not always by itself support full binding. For example, it is known that binding of SL1 RNA to the protein U1-70K in the U1 spliceosomal particle is reduced when a region flanking the RRM is truncated. How the RRM flanking regions that together with the RRM make up an ‘extended RRM’ (eRRM) contribute to complex stability and structural organization is unknown. We study the U1-70K eRRM bound to SL1 RNA by thermal dissociation and laser temperature jump kinetics; long-time molecular dynamics simulations interpret the experiments with atomistic resolution. Truncation of the helix flanking the RRM on its N-terminal side, ‘N-helix,’ strongly reduces overall binding, which is further weakened under higher salt and temperature conditions. Truncating the disordered region flanking the RRM on the C-terminal side, ‘C-IDR’, affects the local binding site. Surprisingly, all-atom simulations show that protein truncation enhances base stacking interactions in the binding site and leaves the overall number of hydrogen bonds intact. Instead, the flanking regions of the eRRM act in a distributed fashion via collective interactions with the RNA when external stresses such as temperature or high salt mimicking osmotic imbalance are applied.
INTRODUCTION
RNA molecules inside the cell interact closely with proteins to form ribonucleoprotein (RNP) complexes as a part of cellular machineries such as the ribosome and the spliceosome (1,2). RNA–protein binding is known to be mediated by RNA binding domains (RBDs) (3–5) commonly identified in RNA binding proteins. The 80 residue long RNA recognition motif (RRM), is the earliest to be identified and the most abundant among these domains (6–8). Until the last decade, the majority of studies, and hence our understanding of RNA–protein binding mechanisms, focused on the minimal globular RBDs. Early reports on the role of linkers connecting two minimal RNA binding motifs in mediating RNA binding (9), on the disordered regions in proteins associated with RNA processing (10,11), and even on RNA-binding proteins that lack a minimal binding domain (12,13), point to the importance of extended RNA-binding domains in RNA–protein interactions. Several ribosomal proteins and splicing factors also exhibit unconventional binding modes involving N- and C-terminal extensions adjacent to the minimal RNA binding domain that form extensive interactions with the RNA (14–17). Extended binding domains are particularly important in the context of RNA processing and storage that involves exchange of RNP components across cell compartments and membraneless organelles (18,19).
The spliceosome is such an RNP, many of whose components assemble and disassemble routinely with the assistance of RRMs (19). The U1 small nuclear ribonucleoprotein (U1 snRNP) particle in particular has an interesting life cycle. It consists of a single RNA folded into four hairpin loops. Stem loop 1 (SL1) binds to the RRM in protein U1-70K (20), and stem loop 2 (SL2) binds to the RRM in protein U1A. Similar to other spliceosomal subunits, U1 snRNP is partly assembled in the cytoplasm with a Smith (Sm) protein heptamer and cycled into the nucleus for further assembly and function (21). The U1 snRNP is involved in the initial recognition event at 5’ splice sites of pre-mRNA transcripts (22).
In contrast to U1A and SL2 RNA (23–26), the binding of U1-70K to SL1 RNA has not been studied quantitatively. U1-70K is a 437 residue protein, whose residues 92 through 202, containing the full RRM, result in weakened binding to the SL1 RNA (27). Residues 60 through 216 form the basis of a crystal structure (28), and enable full-strength binding to the SL1 RNA (27). This construct is thus an excellent model system to study the role of an extended RRM (eRRM) in RNA–protein binding. The eRRM contains a helix on the N-terminal side of the RRM, the ‘N-helix’ in Figure 1, and an intrinsically disordered region on the C-terminal side of the RRM, the ‘C-IDR’ in Figure 1. The role of these extended regions flanking the minimal U1-70K RRM in RNA binding is not yet understood. In contrast, the remaining mostly disordered regions of U1-70K, residues 1–59 and residues 216–437, are known to be important for binding of the U1 snRNP to accessory proteins such as the Sm and SR proteins (29–33), but there is no experimental evidence that they interact with the SL1 RNA in any way that enhances the RRM binding (27,28), although this does not rule out mediated interactions, e.g. via Sm proteins.
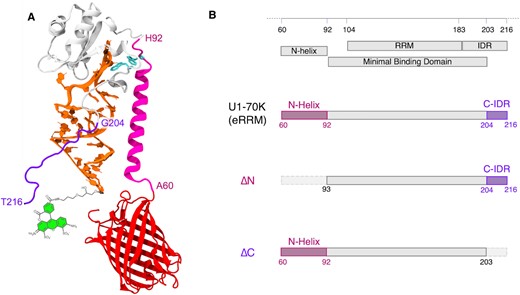
(A) The eRRM–SL1 complex (PDB ID: 4PKD) showing W89 and W187 (cyan licorice) on U1-70K (gray), N-helix (A60 to H92) in magenta, C-IDR (G204 toT216) in violet and FRET labels Alexa Fluor 488 (green) on RNA (orange) and mCherry (red) on U1-70K. (B) Annotated U1-70K sequence in the region of the eRRM (60–216) with domains included in the 3 main protein constructs used for the experiments.
Here we examine how SL1 RNA binding to the RRM is affected by deletion of its flanking N-helix (residues 60–92) making a ‘ΔN’ sequence, or deletion of C-IDR (residues 203–216) making a ‘ΔC’ sequence. Specifically, we measure eRRM–RNA interaction when stressed by high temperature or salt concentration. Protein-RNA binding is sensitive to stressors such as elevated temperature or osmotic imbalance, which can lead to changes in binding constants, protein expression levels, or formation of phase separated compartments (34–36) as cells move out of homeostasis. Environmental stresses are known to affect splicing, as well as mature mRNA nuclear export and sequestration in cytoplasmic foci, in order to favor production of heat shock-related RNAs (37). Thus, we hypothesize that the RRM is sufficient for minimal binding under homeostatic conditions, whereas the extra flanking regions of the eRRM could assist binding when U1 snRNP is under stress. To contrast the flanking interactions with RRM binding, we study the wild type RNA and a double mutant that reduces RRM binding affinity of the SL1 RNA and will be suitable for comparison with future in-cell studies that require complex dissociation temperatures <45°C.
In this study, equilibrium thermal denaturation of the complex reveals that deletion of the N-helix greatly reduces overall binding as assessed by Förster resonance energy transfer (FRET), whereas deletion of C-IDR affects more the local structure and dynamics of the binding pocket as assessed by tryptophan fluorescence. Analysis of the binding kinetics shows that temperature and high salt stresses affect on- and off-rates in concert to reduce binding affinity, so both search for the binding partner as well as complex stability are hindered by these stresses. The effect of truncations is revealed at the atomistic level by over 20 μs of molecular dynamics (MD) simulations on the eRRM and truncated complexes over a range of temperatures and salt concentrations in accordance with the experimental values. The MD simulation allowed us to rule out loss of stacking in the binding pocket or net loss of hydrogen bonding as the primary causes for the lower observed stability of the ΔN and ΔC complexes. Instead, analysis of the simulation highlights that the C-IDR interacts with the mid-stem of the RNA and supports our experimental finding that the N-helix becomes increasingly important in maintaining complex stability when temperature or mutation stress is applied to the complex. Thus, the N-helix flanking the U1-70K RRM can provide additional binding interactions under heat- or salt-induced stress.
MATERIALS AND METHODS
RNA mutations and RNA handling
The RNA construct designed for the binding studies comprised of 32 bp (nucleotides 17–48, Supplementary Table S1) of human U1 snRNA constituting the stem loop 1 (SL1). Wild type and mutated SL1 RNA oligomers with fluorescent label (Alexa fluor 488 NHS ester coupling at the 3’ end through an amino linker) were obtained from Integrated DNA Technologies (IDT). An alternate version with Alexa Fluor 594 label was also designed for control experiments. Secondary structure and stability of the wild type and mutant constructs were determined using circular dichroism (CD) spectrophotometry. RNA constructs were heat-shocked (3 min at > 80°C, followed by 5 min in ice) prior to binding experiments to ensure correct secondary structure.
Plasmid construction, protein expression and purification
DNA sequences coding for all protein constructs were cloned into pDream2.1/MCS vector (Genscript USA Inc) with an N-terminal 6XHis-tag for purification followed by a thrombin cleavage site. All plasmids were chemically transformed into BL21-CodonPlus (DE3)-RIPL competent cells (Agilent) according to the manufacturer protocol. Proteins expression and purification were optimized based on previously reported protocol (38). The cells were grown in 1 L Lennox LB broth (BD Difco) at 37°C for ∼3 h, and protein expression was induced with 1 mM isopropyl β-d-1-thiogalactopyranoside (IPTG, Inalco Pharmaceuticals) at OD600 = 0.60. The cultures were grown at 20°C for 12–16 h after induction. The cells were pelleted by centrifugation (Beckman Coulter Avanti J-E, 5000 rpm, 30 min, 10°C) followed by resuspension in lysis buffer prepared by dissolving 2 tablets of protease inhibitor (Pierce™ Protease Inhibitor Mini Tablets, EDTA-free, Thermo Scientific) in 20 ml of 20 mM sodium phosphate, 500 mM NaCl, 20 mM imidazole, pH 7.4. 20 μl DNase I (New England Biolabs) was added to the cell suspension and lysed by ultrasonication (Qsonica-Q700) with 70% amplitude, 6 s pulse/min and 6 min total process time. The cell lysate was centrifuged (10 000 rpm, 20 min, 10°C) to remove cell debris and supernatant was filtered through a 0.45 μm Millex sterile syringe filter followed by 0.22 μm filter. The filtrate was loaded on a 5 ml HisTrap HP column by ÄKTA pure FPLC (GE Healthcare Life Sciences), and the protein was eluted with elution buffer (20 mM sodium phosphate, 500 mM NaCl, 500 mM imidazole, pH 7.4). Purity of eluted protein was assessed using SDS-PAGE and mass spectrometry (MALDI). Protein was dialyzed against storage buffer (10 mM potassium phosphate, 200 mM KCl, pH 7.4), flash frozen in liq. N2 and stored at –80°C.
Equilibrium thermal dissociation of the eRRM–SL1 RNA complex
Tryptophan quenching experiments (39) were performed on the same instrument. The U1-70K eRRM has 2 tryptophan residues (W89, W187) at the RNA binding pocket which could be potentially used as reporters of RNA binding. For thermal dissociation studies, Trp residues were excited at 295 nm and emission was collected from 290 to 450 nm at every 3°C from 15 to 63°C (Supplementary Figure S1C). Tryptophan emission maximum at the highest temperature point was determined from a gaussian fit of the spectrum from 330 to 360 nm. Variation in quenching due to protein–RNA unbinding was reported by the normalized intensity at the emission maximum thus obtained (Supplementary Figure S1D). All normalized tryptophan quenching curves have the unbinding transition set to range from 1 to 2. Top and bottom baselines have negative slopes due to the intrinsic temperature dependence of the tryptophan fluorescence as in case of the FRET labels. The unbinding transitions from unlabeled protein–RNA complexes monitored by tryptophan fluorescence can be compared to their FRET-labeled counterparts to check the effect of labels on dissociation of the protein–RNA complex and protein–RNA binding stability. FRET efficiency is a ‘global’ probe, and Trp quenching probes the local binding pocket.
Temperature-jump relaxation kinetics of protein–RNA binding
We use two-color fast relaxation imaging (FReI) to quantify the kinetics and thermodynamics of protein–RNA binding by laser-heating the complex in aqueous buffer on a timescale faster than the dynamics of the system and studying the relaxation kinetics. The detailed instrumental setup for FReI has been described previously (38). A 2 μm IR laser is used to heat rapidly and uniformly a sample containing an equimolar protein–RNA mixture in aqueous buffer to perturb its binding equilibrium. The power density of the IR laser is programmed to induce a series of 3–5°C temperature steps, followed by ∼10 s equilibration time after each step for the system to relax to its new equilibrium state at the higher temperature. The relaxation kinetics of the FRET-labeled sample is imaged onto a camera using an epifluorescence microscope which splits the emission signal into two channels, ‘green’ and ‘red’. The two-color signals are integrated into a signal ‘G’ and ‘R’ and used to compute FRET efficiency as a function of time as E(t) = R(t)/[G(t)+R(t)]. The baseline of the FRET efficiency (from the last 4 s) is averaged to determine the equilibrium FRET value at each temperature, and the decay of the FRET efficiency is used to fit the kinetics as described in the next two sub sections. The temperature after each step is quantified using the temperature-dependent quantum yield of mCherry as a standard (Supplementary Figure S3).
For sample preparation, microscope slides (VWR, plane selected precleaned, 22 × 75 × 1 mm) were wiped with ethanol to remove dust or other particles. A 13 mm diameter, 120 μm thick spacer (25 × 25 mm, Grace Biolabs) was stuck to the center of the microscope slide to confine the sample. 40 μl of an equimolar mixture of 1 μM protein and RNA was in the appropriate buffer was loaded into the spacer opening along with 1 μl of 1:2000 dilution of 6 μm green-fluorescent polystyrene beads (10 mg/ml, Degradex), sealed with a cover glass (22 × 22 mm, Fisherbrand) and the slide is inverted with the cover glass facing down to allow the beads to settle on the cover glass. The microscope slides containing the sample were loaded on the epifluorescence microscope stage in the inverted position. The beads were used to accurately locate the z-position to focus the IR-laser beam onto the sample on the cover glass.
Protein-RNA dissociation equilibrium and kinetics
To analyze all the FReI data, we assumed a bimolecular equilibrium for the complex:
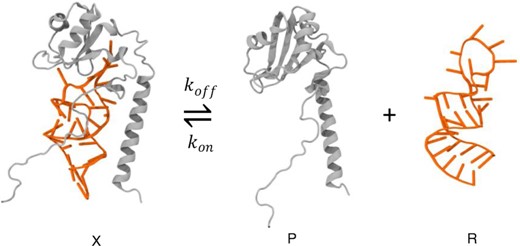
Here, X is the complex concentration, P is the protein concentration, and R is the RNA concentration. The dissociation equilibrium constant is given by |${K_d} = \exp [ { - \Delta G( T )/RT} ]\ = {k_{off}}\ /\ {k_{on}} = \ PR/X\ = [ {{P_0} - X} ]\ [ {{R_0} - X} ]/X$|. Here P0 and R0 are the total protein and RNA concentrations. |$\Delta G$| is the free energy of dissociation and was approximated by the linear free energy relationship |$\Delta G( T )\ = \ {G_0} + \ {G_1}( {T - {T_{1/2}}} )$|, where |${G_0}( {{\rm{kJ}}/{\rm{mole}}} )\ = \ - 0.00831T{\rm{ln}}[ {{P_0}/2} ]{\rm{\ }}$|and |${T_{1/2}}$| is the midpoint of the temperature-induced unbinding transition of the protein–RNA complex.
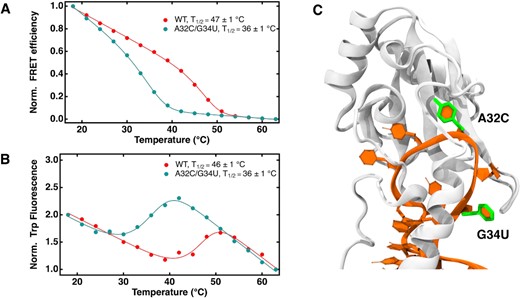
Extended RRM to SL1 binding is destabilized by RNA mutations at the binding site. (A) Normalized FRET efficiency curves of 1 μM wild type and double mutant SL1 in complex with the U1-70K eRRM in 10 mM potassium phosphate and 300 mM KCl pH 7.4 excited at 488 nm. (B) Normalized tryptophan emission intensity curves under the same conditions. Both FRET efficiency and tryptophan emission curves were fit to eq. 3 in Methods to obtain |${T_{1/2}}$| shown in the figure legends, and baseline fitting is explained in Eq. (2) in Materials and Methods; (C) eRRM–RNA complex showing mutated sites (A32C, G34U) on SL1 RNA highlighted in green licorice.
All data were analyzed using IGOR Pro (WaveMetrics) by fitting the parameters G1 and T1/2, and fixing the known parameters P0 and R0.
Here, |$\tau \ =$| 200 ms is the known time constant to account for the instrument response (due to relaxation of the fluorescent protein and heating response time), which is the deadtime for the measurements. This equation is fit to the data by fitting the parameter kon only, while using the known values of Ptot, Kd at the final temperature of the step (from the thermodynamic fit) and calculating koff = konKd as well as X0 from Kd at the temperature just before the step.
Construction of the computational model system and MD simulations
The structure of the U1-70K protein (residues 60–203) in complex with SL1 RNA was determined by X-ray crystallography (PDB ID: 4PKD) (28). In the eRRM protein, 13 residues of the C-terminal region were not resolved in the X-ray crystallographic structure. To model the missing residues (residues 204–216 in Figure 1B), trRosetta (40) was used: from the 15 models that were randomly generated, one that is both unstructured and with suitable orientation with respect to the rest of the protein was chosen. The SL1 RNA sequence corresponding to the experimental sequence was obtained by mutating the A32C and G34U nucleotide residues using routine psfgen in the NAMD program (41,42). The Solvate plugin of the VMD program (43) was used to solvate the simulation box with TIP3P water molecules (44) to provide a distance of 30 Å between the periodic images. After neutralizing the system, an additional 0.3 M KCl and 0.5 M KCl were added to the water box using program Ionize to reproduce the low salt and high salt experimental conditions. Because folding equilibria of proteins have been reproduced in extensive tests with CHARMM36 force field, we performed our simulations using CHARMM36m for protein and CHARMM36 for RNA for consistency (45,46); additionally, this force field choice will allow comparison of the U1-70K-SL1 RNA complex dynamics with recent U1A-SL2 RNA complex simulations (24,47). Stepwise minimization and equilibration were performed as follows: (i) 15000 minimization steps with all heavy atoms restrained; (ii) 15000 minimization steps with all heavy atoms restrained except water molecules; (iii) 30000 minimization steps with protein and RNA backbone atoms restrained; (iv) 30000 minimization steps with no positional restraints; (i) 100 ps of equilibration at –173°C with protein and RNA backbone atoms restrained; (ii) 100 ps of equilibration at –73°C with protein and RNA backbone atoms restrained; (iii) unrestrained equilibration at 25°C. The restraint force constant for all the above simulations was 1 kcal/mol/Å2. The equilibrations were performed in the NPT ensemble by using a Langevin thermostat (damping coefficient of 5 ps–1) and a Langevin piston method (48,49) (200 fs piston period and 100 fs piston decay). Periodic boundary condition and NPT ensemble were used for production runs. The long-range electrostatics was computed by particle-mesh Ewald algorithm (50,51), Lennard–Jones interactions were cut off at a distance of 12 Å and the time step was 2 fs. All simulations were performed with NAMD 2.14 and NAMD 3 programs (41,42). We performed a cumulative total of 22.5 μs of MD production runs. Three replicas of 500 ns were performed for each of the eRRM, ΔN, and ΔC proteins in complex with SL1-RNA. To mimic the experimental condition, each complex was simulated for five different conditions of: (i) 300 mM KCl and 25°C; (ii) 300 mM KCl and 40°C; (iii) 300 mM KCl and 50°C; (iv) 500 mM KCl and 25°C; (v) 500 mM KCl and 50°C. The root mean square deviation (RMSD) plots of the 45 production runs of 500 ns each (3 complexes × 3 replicas × 5 conditions) showed that the complexes reached equilibration in approximately 100 ns (Supplementary Figure S5).
Dynamical network, community, and shortest path analysis
RESULTS
Truncated U1-70K complexes are stable
The extended RRM (eRRM) sequence used in this study is based on the human spliceosomal U1-70K fragment of residues 60–216, used for a crystal structure (28). The missing disordered N-terminal residues (residues 1–59) and C-terminal residues (residues 217–437), important for binding to Sm and SR proteins are not considered here (27,29–31), and are not required for strong SL1 RNA binding (27). Therefore, the 157 amino acid eRRM, shown in Figure 1 (amino acid sequence provided in Supplementary Table S1) is our reference sequence in this study. Thirty-three N-terminal residues constituting the N-helix were deleted to obtain the ΔN truncation. Similarly, ΔC was designed by truncating 13 disordered residues from the C-terminus. These 13 residues were not resolved in the crystal structure. To observe complex formation via FRET, the eRRM was fluorescently labeled by fusing the fluorescent protein mCherry to the N-terminus (Figure 1A) which was chosen as a FRET acceptor from the Alexa Fluor 488 label on the RNA. FRET labeling also enables future direct comparison with in-cell experiments. To avoid labeling the truncated area, the mCherry label of ΔC was placed at the N-terminus, and ΔN was labeled at the C-terminus. Finally, the eRRM was also labeled at the C-terminus as a control. All proteins expressed well in Escherichia coli and were purified for RNA binding experiments as described in Materials and Methods. The N-terminal 6x-His tag on U1-70K eRRM was shown to not affect RNA binding (Supplementary Figure S2A). Unless otherwise noted, we will refer to the mCherry-labeled U1-70K extended RRM with N-terminal 6x-His tag as ‘eRRM,’ the N-terminal truncation as ‘ΔN’, and the C-terminal truncation as ‘ΔC’. The segments that have been truncated away will be referred to as N-helix and C-IDR respectively.
FRET and tryptophan fluorescence report on complex dissociation
We monitored the eRRM–SL1 RNA complex dissociation by two different fluorescence methods. FRET is a global measure of dissociation, covering the ∼5 nm range given by the 50% FRET efficiency distance (Förster distance, R0) of the two fluorophores. For the Alexa 488–mCherry pair, R0 = 5.9 nm (55). In addition to FRET, we measured tryptophan fluorescence because two tryptophan residues, W89 and W187 are located near the RNA binding site (Figure 1A, cyan side chains), and are potentially quenched by the RNA via Dexter transfer (∼0.5 nm range) (56). Therefore, FRET and tryptophan report on the dissociation reaction in complementary ways: FRET is a global measure of dissociation, whereas tryptophan fluorescence looks at the native-like bound structure near the binding pocket.
Tryptophan fluorescence measurements comparing the eRRM (contains both W89 and W187) and ΔN (missing W89) revealed that W187 is the major contributor (∼80%) towards the overall fluorescence signal and hence the major reporter in the binding experiments, although the smaller signal from W89 (∼20% of total Trp fluorescence) was also found to be sensitive to RNA binding (Supplementary Table S2, Figure S2B).
Thermal dissociation of a sample of 1 μM FRET-labeled eRRM-wild type SL1 RNA complex was measured using Alexa Fluor 488 as donor on the RNA and mCherry as acceptor label on the eRRM (Figure 2A). The dissociation reaction yielded an equilibrium dissociation constant as low as 1.7 × 10⁻¹⁰ M in 10 mM potassium phosphate buffer with 200 mM KCl, which closely mimics the in-cell salt concentration (Supplementary Figure S6). In this study, we have used 300 mM KCl, about 100 mM above physiological total ion concentration, as our main reference salt concentration because the lower baselines of unbinding curves of the weaker-binding complexes were dominated by the temperature dependence of the FRET labels in 200 mM KCl. The unbinding transition reported by FRET at |${T_{1/2}}$| = 45°C in 300 mM KCl is in good agreement with that reported by loss of tryptophan quenching (Figure 2B), indicating that the progress of the dissociation reaction can be studied by using FRET, useful for future in-cell studies.
We also measured the RNA A32C/G34U double mutant dissociation equilibrium, based on two RNA mutations known to reduce binding affinity (Supplementary Figure S7). The tryptophan intensity of wild type and double mutant RNA is very similar except for a 10°C shift in stability (Figure 2B), consistent with the structure of the binding pocket remaining unchanged near the two tryptophan residues. We measured the two single mutants as well to show that the destabilization of RNA to eRRM binding and hence the decrease in free energy at sites A32 and G34 is additive, a further sign that no major disruption of the binding site occurs (Supplementary Figure S6, Figure S7). The additive effect of the RNA mutations increases the dissociation constant Kd by ∼ 200 times and reduces the dissociation temperature to 41°C under physiological salt conditions (Table 1).
Effect of RNA mutations, salt concentration and protein domain truncations on the stability of RNA binding to the extended RRM and its truncations. T1/2 (midpoint temperature for complex dissociation), free energy for complex dissociation at 37°C and dissociation constant Kd are shown. Table shows global parameters derived from FRET measurements unless (Trp) is noted for tryptophan fluorescence measurements. See Supplementary Table S4 for equivalent parameters at 25°C
| Protein | RNA | KCla (mM) | T1/2 (°C) | ΔG (kJ/mol) | Kd (M) |
|---|---|---|---|---|---|
| eRRM | wild type | 200 | 47 ± 1 | 52 ± 9 | 1.7 × 10⁻¹⁰ |
| eRRM | wild type | 300 | 45 ± 1 | 50 ± 4 | 4.4 × 10⁻⁹ |
| eRRM | wild type | 500 | 42 ± 1 | 43 ± 2 | 4.8 × 10⁻⁸ |
| eRRM | A32C/G34U | 200 | 41 ± 1 | 44 ± 3 | 3.7 × 10⁻⁸ |
| eRRM | A32C/G34U | 300 | 35 ± 1 | 35 ± 1 | 1.1 × 10⁻⁶ |
| eRRM | A32C/G34U | 400 | 31 ± 1 | 30 ± 1 | 7.9 × 10⁻⁶ |
| eRRM | A32C/G34U | 500 | 28 ± 1 | 27 ± 1 | 3.3 × 10⁻⁵ |
| ΔN | wild type | 300 | 34 ± 1 | 34 ± 14 | 1.7 × 10⁻⁶ |
| ΔN | wild type | 500 | 31 ± 1 | 27 ± 3 | 2.4 × 10⁻⁵ |
| ΔN | A32C/G34U | 300 | 28 ± 1 | 22 ± 6 | 1.8 × 10⁻⁴ |
| ΔN | A32C/G34U | 500 | 15 ± 1 | 10 ± 1 | 2.2 × 10⁻² |
| ΔC | wild type | 300 | 44 ± 1 | 43 ± 7 | 5.3 × 10⁻⁸ |
| ΔC | wild type | 500 | 42 ± 1 | 41 ± 7 | 1.2 × 10⁻⁷ |
| ΔC | A32C/G34U | 200 | 41 ± 1 | 42 ± 11 | 8.1 × 10⁻⁸ |
| ΔC | A32C/G34U | 300 | 34 ± 1 | 34 ± 4 | 1.8 × 10⁻⁶ |
| ΔC | A32C/G34U | 400 | 29 ± 1 | 29 ± 1 | 1.5 × 10⁻⁵ |
| ΔC | A32C/G34U | 500 | 26 ± 1 | 25 ± 1 | 6.2 × 10⁻⁵ |
| ΔC (Trp) | A32C/G34U | 300 | 30 ± 1 | 29 ± 2 | 1.2 × 10⁻⁵ |
| ΔC (Trp) | A32C/G34U | 500 | 26 ± 1 | 21 ± 1 | 3.2 × 10⁻⁴ |
aMeasurements done in 10 mM potassium phosphate with added concentration of KCl as indicated.
Temperature-induced dissociation of an alternate FRET construct with mCherry at the C-terminus of the eRRM was also measured in order to rule out the effect of positioning of fluorescent tags on the protein–RNA complex (Supplementary Figure S8). Finally, the unbinding reaction showed good reversibility in the temperature range used for all the studies here (Supplementary Figure S9).
We also checked the effects of physiological levels of Mg2+ (0.5–1 mM) (57) on the system. Trp fluorescence was monitored for thermal dissociation of the wild type SL1 and A32C/G34U SL1 with the eRRM in 10 mM potassium phosphate buffers with 200 mM KCl and 0.5–1 mM MgCl2. We did not see any significant effects of up to 1 mM Mg2+ on complex stabilities (Supplementary Table S5, Figure S10). Hence all further measurements were carried out in buffers without Mg2+.
Increased salt concentration perturbs electrostatic interactions and increases Kd by three orders of magnitude|${K_d}$|
In order to investigate the effect of salt (KCl) on stability of the U1-70K eRRM–SL1 complex, we studied the dissociation reaction of an equimolar mixture of FRET-labeled protein and RNA in 10 mM potassium phosphate buffers with KCl concentration varying from a near physiological 200 mM up to 500 mM. Raising the salt concentration by a factor of 2.5 raised the by close to a factor of 900, indicating a significant weakening of protein–RNA binding (Figure 3A, Table 1). We observed a near-linear dependence of log[(M)] on log[KCl (M)] with a slope of 7.4 (Figure 3B) suggesting that at most seven salt bridges are mediating binding between the eRRM and the double mutant RNA (58).
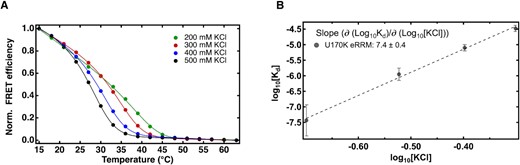
Extended RRM–SL1 interaction shows significant salt dependence. (A) FRET efficiency calculated from fluorescence spectra of equimolar mixture of A32C/G34U SL1 and the U1-70K eRRM in 10 mM potassium phosphate and 200–500 mM KCl pH 7.4 excited at 488 nm collected from 15 to 63°C. Curves were fit to eq. 3 in Methods to obtain thermodynamic parameters; (B) linear correlation between log(|${K_{d\ }}$|in M) on log(KCl in M). See Supplementary Figure S11 to see similar plots for the ΔC complex.
Truncating the N-helix increases Kd by two orders of magnitude and increases complex destabilization under stress
The N-helix flanking the stem of the SL1 RNA contains nine positively charged basic residues that are close to the negatively charged phosphate backbone of SL1 RNA, which is expected to promote the association with SL1 (59). The N-helix does not have any other known binding function within U1 snRNP or to known cofactors. To quantify possible contributions from the N-helix, we studied the ΔN complex. Deletion of the N-helix resulted in a large destabilization of the complex (Figure 4A) shifting the binding free energy by about 13 kJ/mol and increasing the |${K_d}$| by about a factor of 150 (Table 1). Hence, the N-helix makes a significant contribution to the U1-70K–SL1 complex formation and stabilization. In addition to lowering T1/2 by 8°C, the truncation also increases the relative tryptophan fluorescence intensity of bound vs. dissociated state (Figure 4A), indicating increased mobility of the remaining Trp residue (W187) in the truncated complex (60).
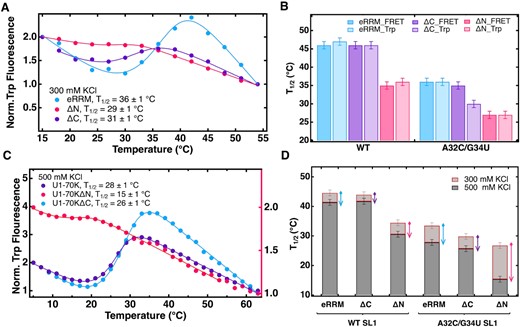
N-helix truncation weakens U1-70K eRRM–SL1 binding whereas the C-IDR truncation only affects the binding pocket of the double mutant. (A) Tryptophan emission intensity curves from fluorescence spectra of equimolar mixture of A32C/G34U SL1 and eRRM (blue), ΔN (magenta) and ΔC (violet) excited at 295 nm collected from 15 to 54°C in 10 mM potassium phosphate and 300 mM KCl pH 7.4. (B) Plot summarizes the effect of N-Helix and C-IDR truncations on binding stabilities of the eRRM in complex with wild type and A32C/G34U SL1; singe mutants are shown in Supplementary Figure S12. The effect of N-Helix truncation on binding can be observed clearly in case of all RNA variants, whereas C-IDR truncation only affected the double mutant complex, where it destabilized the binding pocket. FRET was used as a global reporter of binding, whereas Trp quenching reports on the binding pocket. (C) Tryptophan fluorescence curves from thermal dissociation of eRRM, ΔN and ΔC in complex with A32C/G34U SL1 collected from 5 to 63°C in same buffer conditions as B but with higher salt concentration (500 mM KCl). The signal (y-axis) for ΔN complex is plotted on the right hand side so that the unbinding transition is clearly visible. (D) Plot summarizes the extent of high salt destabilization of the protein complexes with wild type and A32C/G34U SL1. The N-helix truncation resulted in a higher degree of destabilization in high salt compared to that when the helix is present.
The thermal dissociation experiments at higher salt concentration (500 mM KCl) showed that the degree of complex destabilization by salt is higher in the absence of N-helix for the double mutant. RNA–protein binding is thus enhanced in the doubly stressed (mutation and salt) complex (Table 1, Figure 4C and D, Figure S13). Hence in addition to assisting the RRM in complex formation by interacting with the SL1 RNA stem, these results point towards the role of the N-helix in stabilizing the complex under thermal and hyperosmolar stress.
Truncating the C-IDR affects the binding pocket and the overall binding differently
We also quantify the role of the C-IDR (residues 204–216) that follows the minimal binding domain (residues 92–203 of U1-70K) in binding to the RNA (27). Truncation of this region (Figure 1B) yielded ΔC which is predicted to have reduced efficiency in SL1 binding from immunoprecipitation studies (27).
When the more strongly binding wild type SL1 RNA was examined, no significant effect of the C-terminal region was found: in Figure 4B (left), the eRRM and ΔC complexes have very similar dissociation midpoint temperatures T1/2 above 44°C. Nearly the same results were obtained by FRET monitoring, sensitive to overall (long-range) binding, and Trp fluorescence, sensitive to the local binding configuration in the binding pocket. Thus, the C-IDR does not appear to be important for maximal binding to wild type RNA, in contrast to the N-helix (magenta bars in Figure 4B, left).
The results are different for the weaklier binding SL1 RNA double mutant (Figure 4B, right and Table 1). The ΔC truncation now lowers T1/2 slightly and approximately doubles Kd when monitored by FRET (Table 1). However, tryptophan quenching data that monitors the local binding pocket shows that C-IDR truncation results in substantial disruption of the local binding pocket, with an order of magnitude increase in Kd (Figure 4A and B, Table 1). To study how high temperature and salt concentration affect the stability of the ΔC complex, we performed thermal dissociation experiments in higher salt (Figure 4C, Figure S13). The results indicate that regardless of the nature of RNA, C-IDR does not stabilize the complex significantly when under temperature and salt stresses (Figure 4D, Figure S13). The full salt dependence of ΔN and ΔC complexes also followed similar overall trend as the eRRM complex (Figure S14).
Kinetics of the eRRM–SL1 interaction shows kon and koff contribute similarly to Kd
To study the kinetics of the protein–RNA interaction, we used the double mutant RNA construct and FRET-labeled protein and subjected the complex to rapid laser-induced temperature steps that perturbed the binding equilibrium (Figure 5A); rapid temperature jumps have been applied previously to nucleic acid-protein dissociation reactions (61). Equilibrium constants derived from the temperature steps matched up well with the equilibrium data obtained earlier (Figure S15B). Each kinetic relaxation was fitted to the bimolecular rate expression Eq. (6) in Materials and Methods, yielding values for kon and koff. A sample fit is shown in Figure 5B, and the full series of fits in Figure S15A.
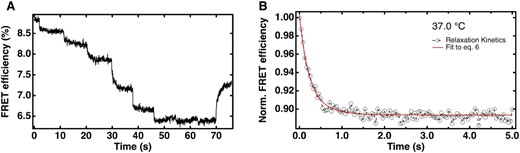
Relaxation kinetics of eRRM-A32C/G34U SL1 interaction from FReI. (A) FRET efficiency of 1 μM complex in response to the rapid temperature jump from 20 to 56°C. (B) Relaxation kinetics of the complex at physiological temperature, 37°C fit to Eq. (6). See Figure S15A for the relaxation kinetics at all temperature jumps from 29°C to 38°C.
In a protein–RNA complex dissociation reaction, Kd can increase (i.e. decrease in binding) either because the reactants form the complex more slowly (reduced kon), or because the complex is more weakly bound and falls apart faster (increased koff). Here we found that Kd increases by a factor of about 80 over ∼8°C range from 29°C to the physiological temperature at 37°C (Figure 5, Table 2). The off rate is responsible for about a factor of 20, and the on rate for about a factor of 4. Thus, the native complex is significantly disrupted by thermal motion, but the electrostatic search for a binding partner is also hindered at the higher temperature.
Kinetic parameters for double RNA mutant complex dissociation in 300 mM KCl. Errors are one standard deviation of the fit. Final temperatures are averages of two replicas, with an uncertainty of ±1.5°C
| Final temperature | koff (s–1) | kon (|${\boldsymbol{{\rm M}}}$|–1 s–1) | Kd (M–1) |
|---|---|---|---|
| 29.2°C | 0.05 | 4.7 ± 0.2 x 10⁶ | 1.0 ± 0.2 × 10⁻⁸ |
| 29.8°C | 0.06 | 4.3 ± 0.5 × 10⁶ | 1.4 ± 0.2 × 10⁻⁸ |
| 33.2°C | 0.19 | 2.5 ± 0.2 × 10⁶ | 7.9 ± 0.2 × 10⁻⁸ |
| 33.5°C | 0.27 | 2.6 ± 0.2 × 10⁶ | 8.9 ± 0.2 × 10⁻⁸ |
| 37.0°C | 0.78 | 1.5 ± 0.7 × 10⁶ | 5.2 ± 0.2 × 10⁻⁷ |
| 38.1°C | 1.01 | 1.1 ± 0.4 × 10⁶ | 8.9 ± 0.2 × 10⁻⁷ |
Protein truncations stabilize the signature RRM base stacking interaction
We know from the experimental results that truncation of the N-helix destabilizes the complex overall as probed by FRET, and destabilizes the binding pocket interactions as probed by tryptophan fluorescence, with the latter observation also made for the C-IDR truncation. Truncations could affect base-stacking or hydrogen bonding interactions at the RRM binding site or between RNA stem and protein. The most obvious hypothesis based on the data is that truncation removes some of these interactions, but is that simple picture correct? To answer this question, we performed a total of 22.5 μs of molecular dynamics (MD) simulations on the eRRM and truncated complexes (see Materials and Methods) that span a range of temperatures (25, 40 and 50°C) and potassium chloride concentrations (300 and 500 mM) in accordance with the experiments.
In the eRRM–SL1 RNA complex, side chain F106 interacts with nucleotide C31, and F148 with nucleotide C32, via base stacking (Figure 6A). These two base stacking interactions are crucial for the stability of the complex, and a signature of RRM:RNA binding (28). We observed experimentally that the A to C nucleotide substitution at position 32 reduces the dissociation temperature of the complex by 4°C and increases the dissociation constant Kd by an order of magnitude (Supplementary Figure S7, Table S3).
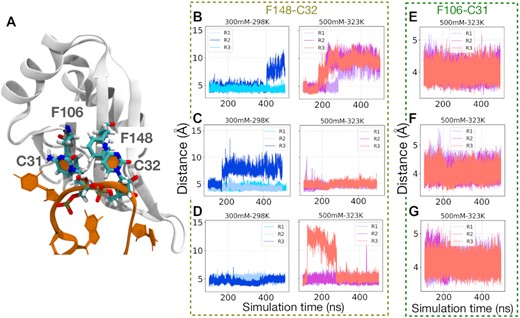
(A) The crucial RRM base-stacking interactions of C31–F106 and C32–F148 within the complex. The distance between the center of mass from C32 to F148 or C31 to F106 in three simulation replicas (R1, R2, and R3) was plotted to monitor their interactions in complexes with different temperatures and salt concentrations for the eRRM complex in (B, E), for ΔC complex in (C, F), and for ΔN complex in (D, G). The C31–F106 base stacking interaction for all protein variations remain fully bound (Supplementary Figure S16), but C32–F148 is least stable in the untruncated complex (see Supplementary Figure S16 for other salt and temperature conditions).
Analysis of the MD trajectories shows that the F106–C31 interaction is unaffected by protein truncations, but surprisingly, the F148–C32 base stacking is stabilized by truncations (Figure 6). To show this, the stability of both base-stacking interactions was monitored by the center-of-mass distance between the interacting residues. For all proteins (eRRM, ΔC and ΔN) at different temperatures and salt concentrations, the stacking interaction F106–C31 is conserved (6E–G). In contrast, the interaction F148–C32 in the eRRM protein shows instabilities even at low temperature and salt concentration and is disrupted completely in all replicas at high temperature and salt concentration (500 mM KCl and 50°C, Figure 6B). However, the ΔC and ΔN truncations stabilize this interaction relative to the eRRM protein (Figure 6C and D).
We can explain the structural origin of this counterintuitive behavior in Figure 7. In the ΔN complex, the linker to the N-helix can sample a wider range of conformations. Particularly, the center-of-mass distance between linker and C32 is on average shorter than the eRRM complex (Figure 7A), and the linker transiently interacts with the RNA repeatedly (Figure 7B). This provides steric hindrance for the nucleotide C32, stabilizing the C32–F148 stacking. In the ΔC complex, the same linker again stabilizes the C32–F148 interaction, but by an entirely different mechanism. In the absence of the disordered C-terminus, the N-helix samples a new conformational ensemble that allows the linker to transiently interact with the unstructured region at the start of the C-terminus (residues 179–203). This new conformation disturbs the interaction between R182 and E179, and E179 is now free to interact with C32 (Figure 7B), contributing to the stability of the C32–F148 interaction.

(A) The probability distribution of the distance between the center-of-mass of the linker (connecting active site to N-helix) and C32 backbone for the extreme simulation condition. The same distribution at the ambient condition is shown in SI. (B) The linker (in green) in the ΔN complex at extreme condition can get closer to the RNA than the linker of the eRRM complex (colored in yellow). Therefore, the linker provides steric hindrance for the C32 to increase its distance to F148. (C) The C32–F148 base stacking interaction is stabilized in the ΔC complex by the transient interaction of E179–C32. This interaction results from a conformational change in the linker, which in turn breaks the interaction of R182–E179. Thus, E179 becomes accessible to interact with the base of C32.
Total number of hydrogen bonds is unchanged upon ΔN truncation
If protein truncations stabilize the key RRM-RNA stacking interaction, then other effects, such as loss of protein–RNA hydrogen bonds, could be responsible for the reduced T1/2 of the truncated complexes. To investigate this, we looked first at the hydrogen bonds lost when the N-helix is deleted, and next at the effect of the truncations on hydrogen bonding elsewhere between protein and RNA.
We monitored the hydrogen bonding interactions between the N-helix and RNA in the eRRM complex for the duration of a microsecond-long trajectory. The results indicate that at ambient conditions, on average about one hydrogen bond is present between the N-helix and the RNA (Supplementary Figure S17). This finding is superficially in agreement with the reduction of ΔG from ∼35 to about ∼28 kJ/mol upon ΔN truncation in Table 1, so one might think that hydrogen bond loss due to helix truncation accounts for the reduced binding in the ΔN complex. However, it is possible that truncating the N-helix also allows the protein to form new hydrogen bonds with the RNA elsewhere. We analyzed this situation by comparing hydrogen bonds in the RRM:RNA binding site upon truncation. Figure 8 shows how the distribution of hydrogen bonds changes with truncations. Specifically, both at ambient and extreme conditions, the mean values of the number of hydrogen bonds are persistently higher for the ΔN complex and statistically equivalent for the ΔC complex with respect to the eRRM complex. The mean values of the total number of hydrogen bonds for the extended RRM, ΔN, and ΔC complexes at ambient condition are: 3.7 ± 1.3, 4.5 ± 1.3, and 3.7 ± 1.3, respectively, and for the extreme condition are: 3.4 ± 1.3, 4.2 ± 1.2, and 3.4 ± 1.2, respectively. Although truncation of the N-helix loses one direct hydrogen bond to the RNA on average (Supplementary Figure S17), it surprisingly allows about one new hydrogen bond to form in the binding pocket. Thus, hydrogen bond loss cannot really explain the lower stability of the ΔN complex.
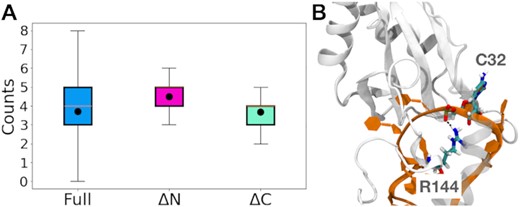
(A) The distribution of the total number of hydrogen bonds defining the RRM:RNA binding site of eRRM:RNA at ambient (25°C, 300 mM salt) conditions for the different protein truncations shown as box plots with the black dot showing the mean values. While the mean values for the eRRM and ΔC complexes are similar, the mean value for the ΔN complex is higher. For other conditions see Supplementary Figure S18. (B) The hydrogen bond between the side chain of R144 and backbone of C32, that is formed in the ΔN complex and contributes to the higher mean value of hydrogen bonds for this complex with respect to the eRRM complex.
The similar ΔG and T1/2 in Table 1 for eRRM versus ΔC complex is also consistent with no significant loss or gain of hydrogen bonding following ΔC truncation. ΔC only causes local rearrangements in the binding pocket, as seen in experiment (Figure 4A).
Global conformational change of the truncated complexes
We hypothesize that distributed or allosteric interactions play a role in destabilizing the ΔN complex because neither binding pocket base stacking, nor hydrogen bonding can rationalize the experimentally observed loss of binding affinity upon truncation, at least not within the length of our trajectories. To determine how overall conformation varies between different truncated complexes, we identified the most populated structural state during the simulation trajectories. The identified characteristic structures for the eRRM, ΔN and ΔC complexes are illustrated in Supplementary Figure S19. eRRM and ΔC complexes show similar overall conformations and root mean square deviation of the backbone atoms of the entire complex is in the range of 3.4–4.6 Å under all different conditions. However, in the ΔN complex the RNA is significantly more flexible, with average root mean square fluctuations of 5.6 Å (the eRRM complex is 3.1 Å). Thus, the N-helix affects not just local binding pocket stacking or hydrogen bonding, but also reduces overall conformational fluctuations. To highlight the effect of truncation on the allosteric paths within the complex we have performed community and shortest path analysis (see Materials and Methods for details) (54).
For the eRRM complex at ambient condition (25°C, 300 mM salt), the RNA is divided into three major communities whose motion is correlated (Figure 9). One contains the end of the stem, another the middle of the RNA stem and part of the C-terminal domain, and the third the connection between the RNA loop and part of the RRM binding pocket (Figure 9A). The motion of the N-helix is decoupled from the RNA (Supplementary Figure S20A), although the elastic network model calculations on the crystal structure of the complex show some degree of correlation between the N-helix and RNA (Supplementary Figure S20B). Thus, an interesting result emerges under the most stabilizing conditions: the disordered C-terminus does move in a correlated fashion with part of the RNA stem. Shortest path analysis was performed to identify the signaling pathways within different parts of the complex. These paths reveal what parts of the complex are connected through the most correlated residues (see Materials and Methods for calculation details). Specifically, the shortest path from the end of the RNA stem to the RRM binding site at residue F148 was calculated. For the eRRM complex at ambient condition, the shortest path entirely passes through the RNA (Figure 9B) However, under the extreme condition this pathway is entirely re-routed through the N-helix (Figure 9C), and the same is seen for the ΔC complex (Supplementary Figure S20C). Thus, the N-helix becomes more important when the eRRM–SL1 binding is disrupted by heat or high salt concentration, as happens during a dissociation experiment such as in Figures 4 and 5.

(A) At ambient condition, RNA motion is correlated in three communities: the bottom of the stem (red), the middle of the stem and C-terminal eRRM residues (blue), and the binding loop and binding pocket residues (pink). (B, C) The shortest signaling path connecting the end of the RNA stem to the RRM base stacking interaction reroutes (blue to red) when the temperature and salt concentration is raised in eRRM complex. The same rerouting is observed for the ΔC complex, see Supplementary Figure S20B.
DISCUSSION
Our results show that the eRRM increases the binding over the well-known minimal RRM, particularly when increased temperature, deleted interactions, or ionic strength stress the RNA–protein binding. It is tempting to assume that RNA–protein complex strength is governed by simple rules, such as ‘truncation of the N-helix removes hydrogen bonds and reduces binding.’ In reality, RNA–protein interactions are highly distributed over many types of interactions such as hydrogen bonds, base stacking, and water exclusion from binding sites. Even for RNA binding proteins containing RRMs or other classical RNA binding domains, the residues adjacent to these domains can also make a significant contribution towards RNA binding (14–17) thus constituting a fundamental structural unit relevant for biological function. We investigate how the binding of an important RRM, the U1-70K binding site of SL1 RNA, is affected by flanking sequences that make up the eRRM, as was observed in case of the splicing factor U2AF65 (61).
In order to study the U1-70K protein-SL1 RNA interactions, we made two types of modifications to the system: truncation of the N-helix or C-IDR flanking the RRM; and a double mutant in the RNA loop to increase the relative contribution of flanking interactions. The U1-70K sequence we study is highly conserved from humans to yeast (Supplementary Table S6, Figure S21) (28,62) and contains all regions known to stabilize the protein–RNA interaction, which excludes the disordered regions (residues 1–59 and residues 216–437) known only to interact with co-factors of U1 snRNP. One of the RNA mutations (position 32) is part of the RRM binding site, the other (position 34) lies at the beginning of the RNA stem. Based on the MD simulations, the two do not share any protein side chains upon binding, so their additive effect on the stabilization free energy (Table 1 and Supplementary Table S3) is plausible and shows that the binding mechanism is not altered although binding is weakened. The observation that both mutations have similar individual effects immediately highlights that protein–RNA interactions are distributed over the RNA, not just in the RRM binding pocket.
When RNA and protein interact, the dissociation constant can be increased via two kinetic mechanisms: either association is slowed down, or the complex is destabilized and dissociation speeds up. At 300 mM KCl concentration, we saw that a temperature stress increases koff by a factor of 20 and decreases kon by a factor of 4, together increasing Kd. The simulations of the bound complex at higher temperature and salt concentration show higher disorder that could lead to enhanced dissociation under stresses such as increased salt concentration and temperature, as well as truncation of the regions flanking the RRM.
We find that the C-IDR is less important for overall stability than the N-helix. When binding to wild-type RNA, there is no significant change in the dissociation midpoint temperature T1/2 with respect to the eRRM, and Kd increases only about three-fold (Table 1) when detected by FRET, a global measure of RNA–protein binding. However, binding studies with the double mutant RNA reveal important contributions from the U1-70K C-IDR to the native structure of the active site: while overall RNA binding is not strongly affected, the effective Kd monitored by tryptophan fluorescence (a local probe of the binding pocket) increases by two orders of magnitude and T1/2 decreases by 6°C. The C-IDR is important when the RNA–protein interaction is compromised (double mutant at high salt). In-cell electrostatics could significantly compromise protein–RNA interaction through non-specific binding competition in a similar way (63), making the C-IDR potentially more important in-cell than in vitro for retaining proper binding site structure. In contrast, the N-helix is important for both the wild type RNA and double mutant interaction with U1-70K, and shows no difference between global (FRET) or local (Trp) binding signatures.
The mode of action of the C-IDR and N-helix is revealed at the atomistic level by analysis of the MD simulations. Surprisingly, simulations show that both truncations actually stabilize stacking interaction in the binding pocket, for example by allowing previously blocked protein side chains to interact with the RNA. Likewise, even though N-helix truncation on average deletes one hydrogen bond between the extended RRM and SL1 RNA, the truncation also permits an extra hydrogen bond to be formed in the binding pocket. Thus, we observe no net changes in stacking or hydrogen bonding responsible for the binding pocket stabilization by the C-IDR or for the global stabilization of the complex by the N-helix.
Rather, we find through a community analysis that residues in the C-IDR have dynamics correlated with the center of the RNA stem. The most correlated pathway for the protein–RNA motions—the shortest path—starting at the stem and going to the binding site under ambient conditions goes exclusively through the SL1 RNA, but under stress (high temperature, salt concentration) it proceeds through the N-helix. Additionally, the tryptophan fluorescence quenching experiments clearly suggest a higher degree of complex destabilization under temperature and salt concentration stress when N-helix is truncated. These observations therefore suggest that the N-helix acts like a guardian under stress, but less so when protein and RNA interact under homeostatic conditions. RNA–protein interactions are sensitive to cell stress (34–36), so such extra stabilization of the U1 snRNP could become important in those situations.
The dynamic nature of salt bridges in the complex further supports the ‘distributed interaction’ picture. As expected, long-range electrostatics play an important role in holding together and organizing the complex, as was also observed for the U1A-SL2 complex (24). The dissociation experiments (Figure 3B) indicate about seven salt bridge-equivalent electrostatic interactions between U1-70K and RNA (58). This is consistent with the seven salt bridges present in the crystal. Yet the majority of salt bridges present in the crystal structure are not stable throughout the simulation, which may be due to force field inaccuracy or to the dynamic nature of the complex when not confined in a crystal. Among the salt bridges present in the crystal structure, only R191-C32 at the RRM binding site stays intact persistently in all simulation replicas. Instead, two new salt bridges not seen in the crystal structure form in simulations between the protein and RNA and are consistently present in all three simulation replicas: R200-U28 and R109-U30. We believe that these two bridges make a significant contribution to the net seven observed in our experiments, and on average only five of the seven bridges seen in the static crystal structure contribute, highlighting the dynamic and distributed nature of electrostatic interactions.
In closing, we speculate that interactions with the extended RRM, beyond the main RRM, will be found among other spliceosomal complexes, as well as ribosomal complexes: the reason is that while severe stress can disrupt these cellular machines (37,64), they have been found to be particularly active under mild stress situations or pretreatments which induce increased transcription and translation of certain mRNAs (65,66), and therefore their integrity must be insured. While the N-helix and C-IDR flanking the U1-70K RRM may not be critical when all is well under carefully tailored in vitro conditions, they could assist integrity of the spliceosome when cell homeostasis is disrupted.
DATA AVAILABILITY
All protein and RNA sequence data are available in the Supplementary Data, as are numerical results of kinetics and denaturation experiments, and more detailed figures summarizing the simulation analysis.
SUPPLEMENTARY DATA
Supplementary Data are available at NAR Online.
ACKNOWLEDGEMENTS
We acknowledge support from the Beckman Institute Theoretical and Computational Biophysics group, and we thank Kathleen Hall for helpful discussions, in particular on SL1 RNA. We thank the reviewers for careful reading of our manuscript and providing insightful comments suggestions on future prospects of the work.
FUNDING
National Science Foundation (NSF) [MCB 2205665 to M.G.]; C.M.D. was supported in part by a postdoctoral fellowship provided by the PFC: Center for the Physics of Living Cells funded by NSF [PHY 1430124], which were also used to purchase some of the plasmids used in this study; XSEDE [TG-MCB180022 to M.G. and Z.G.], to perform simulations on the Comet XSEDE supercomputer. Funding for open access charge: National Science Foundation.
Conflict of interest statement. None declared.
REFERENCES
Author notes
The authors wish it to be known that, in their opinion, the first two authors should be regarded as Joint First Authors.

Comments