


Abstract
Topoisomerase 3β (TOP3B) and TDRD3 form a dual-activity topoisomerase complex that interacts with FMRP and can change the topology of both DNA and RNA. Here, we investigated the post-transcriptional influence of TOP3B and associated proteins on mRNA translation and turnover. First, we discovered that in human HCT116 colon cancer cells, knock-out (KO) of TOP3B had similar effects on mRNA turnover and translation as did TDRD3-KO, while FMRP-KO resulted in rather distinct effects, indicating that TOP3B had stronger coordination with TDRD3 than FMRP in mRNA regulation. Second, we identified TOP3B-bound mRNAs in HCT116 cells; we found that while TOP3B did not directly influence the stability or translation of most TOP3B target mRNAs, it stabilized a subset of target mRNAs but had a more complex effect on translation–enhancing for some mRNAs whereas reducing for others. Interestingly, a point mutation that specifically disrupted TOP3B catalytic activity only partially recapitulated the effects of TOP3B-KO on mRNA stability and translation, suggesting that the impact of TOP3B on target mRNAs is partly linked to its ability to change topology of mRNAs. Collectively, our data suggest that TOP3B–TDRD3 can regulate mRNA translation and turnover by mechanisms that are dependent and independent of topoisomerase activity.
INTRODUCTION
Topoisomerases are ‘magicians’ of the DNA world, with critical roles in relieving topological stress produced during DNA replication, transcription, and chromosome segregation (1). Mutations in or deregulation of topoisomerases can cause defective development, lethality, and human diseases, such as neurological disorders and cancer (1). A fundamental question that has remained unanswered is whether RNA metabolism also produces topological stress that requires resolution by a topoisomerase. Recent discoveries that a Type IA topoisomerase in animals, TOP3B, is a dual-activity topoisomerase that can change topology of both DNA and RNA (2,3), have led to the hypothesis that RNA metabolism may indeed produce topological problems resolved by TOP3B (4). Moreover, the findings that the RNA topoisomerase activity is prevalent in Type IA topoisomerases in all domains of life (5) further suggest that RNA topological problems occur in a wide range of species that select for retention of RNA topoisomerase activity through millions of years of evolution (4).
TOP3B has been shown to form a stoichiometric complex with TDRD3 (Tudor domain-containing 3) in both human and fly (3,6). TDRD3 acts as a regulatory subunit and has at least three functions in this complex. One, it enhances topoisomerase activity of TOP3B on both DNA and RNA (7,8). Two, it acts as a scaffold to anchor TOP3B to other proteins working on DNA or RNA, which include RNA polymerase II (pol II), histones, Fragile-X mental retardation protein (FMRP), exon junction complex, and RNA-induced silencing complex (3,6,7,9,10). The Tudor domain of TDRD3 can specifically recognize methylated arginine residues present in other proteins and plays a crucial role in recruiting TOP3B–TDRD3 complex to its targets (7,10–12). Three, TDRD3 and TOP3B stabilize each other, as depletion of each protein reduces the level of its partner in cells (7).
The notion that TOP3B can act in both DNA and RNA metabolism is supported by accumulating evidence. For DNA, TOP3B has been shown to promote neuronal activity-dependent transcription in the mouse brain (13) and to be recruited to specific promoters by its partner, TDRD3, to reduce R-loops and maintain genome stability (7,14). For RNA, TOP3B is the only topoisomerase in animals containing a conserved RNA binding domain, RGG-box, which is critical for TOP3B binding to mRNAs (15), and catalyzing RNA topoisomerase reactions (3). TOP3B works with the siRNA machinery to promote heterochromatin formation and silencing of transposons (6) , and promotes neural development (15). In addition, TOP3B possesses a nuclear export sequence that allows it to shuttle between nucleus and cytoplasm (2). Moreover, overexpression of a TOP3B mutant (R338W) can produce cleavage complexes on both DNA and RNA in cells (16), suggesting that TOP3B can catalyze reactions on both types of nucleic acid in vivo. Notably, TOP3B has been recently shown to be required for replication of positive-strand RNA viruses including SARS-CoV-2, raising the possibility that TOP3B could be a feasible antiviral target (17).
Indirect evidence supports a role for the TOP3B–TDRD3 complex in mRNA translation (2,3). First, the complex can biochemically and/or genetically interact with translation regulators, including FMRP (2,3), and the exon-junction complex (EJC) (2,9). Second, TDRD3 itself has been suggested to regulate translation of some mRNAs (18). Third, a large fraction of TOP3B is localized in the cytoplasm, where it co-localizes with TDRD3 and FMRP in RNA stress granules (SGs) in response to cellular stress (2,3). SGs are compartments consisting of transiently inactivated mRNAs and translation machinery, which are formed as a cytoprotective mechanism to shut down non-essential translation during stress. Fourth, TOP3B co-fractionates with TDRD3 and FMRP in polyribosomes (2,3,5) whose mRNAs are under active translation. Finally, TOP3B mutations have been linked to multiple psychiatric and cognitive disorders, including schizophrenia and autism (2,19–21). This feature also resembles that of FMRP, with the Fragile X syndrome identified as the leading cause of autism (22). This has led to the proposal that TOP3B works with FMRP to regulate translation of mRNAs important for these disorders (2,3). However, critical evidence has been lacking to show that ablation of TOP3B protein or inactivation of its catalytic activity can alter translation of mRNA bound by the topoisomerase.
This study aims to address three basic questions regarding the post-transcriptional roles of TOP3B–TDRD3. First, does the absence of TOP3B or TDRD3 affect mRNA translation and turnover? Second, is the topoisomerase activity of TOP3B required for mRNA translation or turnover? Third, which mRNAs are bound by TOP3B? To address these questions, we discovered that the effects of TOP3B-KO on mRNA turnover and translation resembled strongly to those of TDRD3-KO, but weakly to those of FMRP KO, indicating that TOP3B had stronger coordination with TDRD3 than FMRP. While TOP3B did not directly influence the stability or translation of most TOP3B-bound mRNAs, TOP3B promoted the stabilization of a subset of its target mRNAs. By contrast, TOP3B promoted the translation of a subset of its targets, while it reduced the translation of a different subset of targets. Interestingly, inactivation of TOP3B catalytic activity by TOP3B-Y336F partially recapitulated the effects of TOP3B-KO on mRNA stability and translation, suggesting that the impact of TOP3B on target mRNAs was only partly linked to its ability to remodel topological structures of mRNAs. Collectively, our data suggest that TOP3B–TDRD3 can regulate the translation and turnover of specific mRNAs in the cells by mechanisms that are dependent and independent of topoisomerase activity.
MATERIALS AND METHODS
Cell lines
HCT116 cells were cultured in Dulbecco's modified Eagle's medium (DMEM, Thermo Fisher Scientific) supplemented with 10% fetal bovine serum (HyClone) and 1% antibiotics (Penicillin-Streptomycin, Sigma). For generation of the TOP3B-KO HCT116 cell lines, pX330 plasmid containing the guide RNA sequence was transfected in HCT116 cells. Eight to ten days later, single clones were selected for screening of absence of TOP3B protein and mutations at TOP3B genomic locus by Western blotting and genomic sequencing analysis, respectively. CRISPR-Cas9 mediated ablation of the TDRD3 and FMR1 was achieved with PX459 plasmid as the targeting vector (Addgene) (23). Guide RNA sequences were designed using the http://crispr.mit.edu website and cloned into the targeting vector. Plasmids containing the guide RNA sequence were transfected into cells using FuGENE HD (E2311; Promega). Twenty-four hours post-transfection, the cells were added with fresh medium containing 1 μg/ml puromycin (P8833-10MG, Sigma). After 48–72 h, cells were diluted with new medium (without puromycin) into 96-well plate. After one week, cells from single clones were transferred to 24-well plate. Then, Western blotting and Sanger sequencing were used to screen for clones that lack the target protein and harbor mutations in the target genes. The HCT116 cell line expressing TOP3B catalytic point mutant protein (TOP3B-Y336F) was generated by a modified CRISPR-Cas9 gene editing strategy (23). A single-strand DNA template (100 nt) designed to produce Y336F mutant protein was synthesized by Integrated DNA Technologies company. Plasmid containing the guide RNA sequence and the DNA template were transfected into HCT116 cells using FuGENE HD. Clone selection and validation were performed as described above. The guide RNA and DNA template sequences are described in Supplementary Table S9 and Figure S1.
Ribosome profiling and RNA sequencing
Ribosome profiling protocol was based on a published method (24) with small modifications. Briefly, about 5–10 × 106 HCT116 cells were cultured in 10 cm dish for 12∼16 hours. Cycloheximide (CHX) (2112S, New England Biolabs) was added to a final concentration of 100 μg/ml for 10 min. Cells were washed with 2 ml cold phosphate buffered saline (PBS) with CHX, and then were collected on ice. Cells were lysed in 400 μl polysome lysis buffer (20 mM Tris·Cl pH 7.4, 150 mM NaCl, 5 mM MgCl2, 1 mM DTT and 100 μg ml−1 cycloheximide) by trituration through a 25-gauge needle. After centrifugation, 100 μl cell of lysates were used to extract RNA with TRIzol (15596026, Invitrogen). Then, 5–10 μg RNA was used to purify mRNAs using oligo dT beads (61012, Invitrogen). The purified mRNAs were used for RNA-seq library preparation by following a published protocol (13). Three hundred microliters of cell lysates were used for ribosome profiling. One thousand units of RNase T1 (EN0541, Thermo Fisher Scientific) were added to the lysates, and incubated at 25°C for 1 h at 500 rpm rotation. Two hundred units of RNase inhibitor (AM2696, Thermo Fisher Scientific) were added to the lysates to stop the digestion. Ribosomes were collected by sedimentation through 0.9 ml 1 M sucrose cushion. RNAs were extracted from the purified ribosomes with TRIzol. Then, 24–34 nt RNA fragments were purified using a 15% TBE–urea gel (Thermo Fisher Scientific). Ribosomal RNAs were removed from the purified RNA fragments with NEBNext rRNA Depletion Kit (E6310S, New England Biolabs). The ribosome-protected fragments (RPFs) were treated with T4 Polynucleotide Kinase (M0201S, New England Biolabs) at 37°C for 30 min with 20 units RNase inhibitor. After precipitation with isopropanol, the RPFs were used to prepare library with NEBNext® Multiplex Small RNA Library Prep Set for Illumina (E7300S, New England Biolabs). The RNA-seq and Ribo-seq libraries were sequenced by using the Hi-seq 2000 system (Illumina).
Because RNase I digestion has been commonly used in Ribo-seq, we also attempted to use RNase I to digest polysomes. However, ribosomes from HCT116 cells were very sensitive to RNase I digestion, and we were unable to obtain high quality data of RPFs (data not shown). As an alternative, RNase T1 was used to digest polysomes to monosomes without loss of ribosomes (25).
eCLIP-seq
eCLIP-seq protocol was based on a previous publication (26) with some modifications. TOP3B-KO HCT116 cells were used as negative control instead of IgG. Five μg of TOP3B antibody (WH0008940M1-100UG, Sigma Aldrich) was used for immunoprecipitation. RNA 5’ Pyrophosphohydrolase (RppH) (New England Biolabs) was used to replace Tobacco Acid Pyrophosphatase (TAP) to treat RNA. All other steps and reagents were identical as described in the published method (26).
PRO-seq
PRO-seq was performed as previously described (27). Briefly, HCT116 cells were seeded at a concentration that will enable them to reach ∼80% confluency on a 15 cm plate in 24 h. Cells (about 10–20 million) were then collected, permeabilized, and processed for PRO-seq.
RNA Immunoprecipitation
Cytoplasmic lysates of HCT116 cells were prepared in polysome extraction buffer (20 mM Tris–HCl at pH 7.5, 100 mM KCl, 5 mM MgCl2 and 0.5% NP-40) containing protease and RNase inhibitors. The supernatants were incubated with protein A-Sepharose beads coated with TOP3B antibody (WH0008940M1-100UG, Sigma Aldrich) for 2 h at 4°C. After three washes with ice-cold NT2 buffer (50 mM Tris–HCl at pH 7.5, 150 mM NaCl, 1 mM MgCl2, 0.05% NP-40), bound RNAs were extracted from the beads using TRIzol and subjected to RT-qPCR (28).
Polysome profiling
Polysome profiling was performed as previously described (3,5). Briefly, 5 × 10⁶ HCT116 cells were cultured in a 10 cm dish for 12–16 h. CHX (2112S, New England Biolabs) was added to the medium to a final concentration of 100 μg/ml for 10 min. Cells were collected on ice and lysed in polysome extraction buffer (20 mM Tris–HCl at pH 7.5, 100 mM KCl, 5 mM MgCl2 and 0.5% NP-40). After centrifugation, the cytoplasmic lysate was separated through 10% to 50% sucrose gradients, 12 fractions were collected, and RNA extracted to perform RT-qPCR. The distribution of mRNAs was quantified by RT-qPCR analysis and plotted as a percentage of the specific mRNA in each fraction relative to the total amount of that mRNA in the gradient.
Nascent RNA extraction
Nascent RNA was extracted based on a previously published method (29). Briefly, 1–2 × 10⁷ HCT116 cells were collected and washed two times with ice-cold PBS. The cell pellet was resuspended with 10 ml ice-cold Hypotonic Buffer (10 mM HEPES, pH 8.0, 10 mM KCl, 2 mM MgCl2 and 1 mM DTT, added before use.) and incubated on ice for 15 min. The cell suspension was centrifuged at 200 ×g for 10 min at 4°C and the supernatant was discarded. The pellet was resuspended in 2 ml cold Hypotonic Buffer and then transferred into a precooled 2 ml Dounce tissue grinder. The cell suspension was homogenized with a tight pestle using 20 strokes. The nuclei were pelleted by centrifugation at 600 × g for 10 min at 4°C, and the supernatant was discarded. The nuclei pellet was then washed twice with 1 ml ice-cold Nuclei Wash Buffer (10 mM HEPES, pH 8.0, 250 mM sucrose, 1 mM DTT and 20 U/ml RNase inhibitor). 1 × NUN Buffer (with RNase-free water) was prepared by mixing 50% volume of 2 M urea solution (fresh and filtered) and 50% volume of ice-cold 2 × NUN Buffer (40 mM HEPES, pH 8.0, 15 mM MgCl2, 0.4 mM EDTA, 600 mM NaCl, 2% v/v NP-40) with DTT and RNase inhibitor. The nuclei were suspended and disrupted using 1 × NUN buffer by pipetting up and down vigorously for 10 times followed by incubation on a rotating wheel for 5 min at 4°C. The chromatin was pelleted by centrifugation at 1000 × g for 3 min at 4°C. The chromatin pellet was washed three times with 1 × NUN buffer at 4°C. And 1 ml of TRIzol reagent was added into chromatin pellet followed by vortex for 30 s. The homogenized sample was incubated for 5–10 min at 50°C on a nutator to dissolve the chromatin pellet. Then the rest steps of RNA extraction are the same as the standard protocol of RNA purification using TRIzol. DNA contamination was removed with DNase I (AMPD1-1KT, Sigma Aldrich). Then the RNA was purified with TRIzol. RT-qPCR was performed to detect the nascent RNAs with the primers amplifying the exon-intron junction.
RNA extraction and RT-qPCR analysis
HCT116 cells were cultured in 6-well plates for 12–16 h. For CHX treatment groups, 100μg/ml CHX was added into the medium for 3 h before extracting RNA. After removing the medium, 1 ml TRIzol (Invitrogen, 15596026) was added to the plate directly to lyse the cells. The cell lysate was transferred into 1.5 ml tubes. Two hundred μl chloroform was added into the lysate, vortexed, and followed by centrifugation at 18 000 × g for 10 min at 4°C. The aqueous phase was transferred to a new tube. RNA was precipitated in 1.5-fold volume of 2-propanol together with 10% volume of 3 M sodium acetate. cDNA was synthesized from 1 μg RNA using Taqman Reverse Transcription Reagents (Applied Biosystems, N8080234). After 10-fold dilution, the cDNA was used as a template to perform qPCR with SYBR Green PCR Master Mix (Applied Biosystems, 4309155). The PCR primer sequences can be found in Supplementary Table S9.
Western blot and antibodies
Whole-cell lysates were prepared using RIPA buffer (10 mM Tris-HCl at pH 7.4, 150 mM NaCl, 1% NP-40, 1 mM EDTA, 0.1% SDS, 1 mM dithiothreitol) containing protease inhibitor (11697498001, Roche). The protein concentrations were measured using Bradford (#500-0205, Bio-Rad). 2 × Laemmli Sample Buffer with 5% β-Mercaptoethanol were added into the protein lysates. After boiling at 95°C for 10 min, the protein lysates were separated on a 4–20% Mini-PROTEAN® TGX™ Gel (Bio-Rad) and transferred to nitrocellulose membrane using Trans-Blot® Turbo™ Transfer System (Bio-Rad). Incubations with primary antibodies to detect TOP3B (WH0008940M1-100UG, Sigma Aldrich), TDRD3 (5942S, Cell Signaling Technology), FMRP (MAB2160, Sigma Aldrich), CHD8 (ab114126, Abcam), FAT1 (A304-403A, Thermo Fisher), GAPDH (2118s, Cell Signaling Technology) and ACTB (ab8226, Abcam) were followed by incubations with appropriate secondary antibodies conjugated with HRP (GE Healthcare). Signals were developed using Enhanced Chemiluminescence (ECL).
Bioinformatic analysis
Ribo-seq data analysis based on RPF levels was performed as previously published (24). Briefly, low-quality reads and the adapter sequence (AGATCGGAAGAGCACACGTCTGAACTCCAGTCAC) were removed by FASTX-Toolkit from FastQ files. Reads <25 nt were also removed by FASTX-Toolkit. The remaining reads were aligned to the rRNA reference (hg38) using the Bowtie short-read alignment program. The rRNA alignments were discarded and the unaligned reads were collected. The non-rRNA sequencing reads were aligned to the human genomic reference (hg38) using HISAT2 (30). The raw counts were generated using HTSeq-Counts (31). Then DESeq2 was used to identify the differentially expressed genes (DEGs) and generate the normalized counts (32). The genes with total counts (untreated and treated groups) <10 were filtered out. The genes with fold change > 1.5 and adjusted P-value <0.1 between KO versus WT cells were identified as DEGs. The bedGraph files were generated by deepTools (33) and normalized using RPKM. The bedGraph files were visualized using the Integrative Genomics Viewer (IGV) (34). RNA-seq reads were mapped to hg38 human genome with HISAT2 directly. Then other steps were similar to those of Ribo-seq.
For ribosome stalling analysis based on RPF patterns, we followed the strategy from a previous publication (35). Briefly, we extracted the CDS region coordinates from human genome hg38 annotation GTF file using a Python script. For each protein coding gene, we only picked the longest CDS. Then, the coordinates of each codon of the CDS regions were generated using a Python script. The read counts of each codon were generated using BedTools (multicov) from the mapping result files (bam files from HISAT2) (36). For each gene, the z-scores of each codon were calculated using the read counts. The codons with z-scores above 10 and read counts above 5 were identified as part of a ribosome stalling site. Normalized read counts (CPM) on the codons were used to calculate the difference between WT and mutant groups.
PRO-seq reads were mapped to human genome with Bowtie2 allowing maximum of 2 mismatches (37). The read counts from transcription start site (TSS) regions (−700 to +700 bp from TSS) of each gene were normalized and used as transcription levels. Since we focused on post-transcriptional regulation in our study, genes with PRO-seq level changes (fold change >1.2-fold in two replicates) were considered as DEGs at the transcription level. The volcano plots were generated in Excel using the log2(fold changes) and −log10(adjusted P-values). The fold changes and adjusted p-values were obtained from DESeq2 analysis. The heatmaps were also generated in Excel using the fold changes.
eCLIP-seq reads were mapped to the genome using TopHat. The read counts from each gene were calculated and normalized using a perl script. Genes with criterion (WT-IP_fpkm/WT-Input_fpkm >1.5 and WT-IP_fpkm/TOP3B-KO-IP_fpkm > 1.5) in both biological replicates were selected as TOP3B eCLIP targets. RSeQC was used to analyze the read distribution of eCLIP-seq on introns, CDS, 5’UTR and 3’UTR (38).
RESULTS
Studying TOP3B–TDRD3 function by creating knockout and knock-in mutant cell lines
Human HCT116 cell line has been extensively used for studies of transcription and translation, including analyses of topoisomerase 1 and 2 (TOP1 and TOP2). Here we chose the same cells for studies of TOP3B–TDRD3, so that we can easily compare our findings with those from other studies. We generated isogenic HCT116 cell lines that are individually inactivated for TOP3B (TOP3B-KO), TDRD3 (TDRD3-KO), the catalytic activity of TOP3B (Y336F-KI) or their interacting protein FMRP (FMR1-KO), using the CRISPR-Cas9 technology (Figure 1A and Supplementary Figure S1-2) (23). Genomic DNA sequencing revealed the occurrence of cleavage-directed frame-shift mutations in various KO clones (Supplementary Figure S1), as well as the targeted homozygous Y336F-substitutions in the KI clone (Supplementary Figure S2C). Western blotting confirmed the absence of each target protein in their respective KO cells (Supplementary Figure S2A). We noticed that the protein level of TOP3B was lower in TDRD3-KO cells (∼70% reduction) and TDRD3 protein level was also lower in TOP3B-KO cells (∼70% reduction), but both were unchanged in FMR1-KO cells (Supplementary Figure S2A), which is consistent with earlier observations that TOP3B and TDRD3 depends on each other for stability (7). We generated an additional TOP3B-KO clone (KO2) using a different guide RNA and found that it expresses a mutant protein carrying a partial deletion of the Toprim domain (Supplementary Figure S1B and Figure S1C). Because this highly conserved domain is critical for topoisomerase activity (39), the mutant protein is expected to show loss of function and was used as an internal control in our translation studies (see below). Western blotting also confirmed the presence of the TOP3B-Y336F mutant protein in Y336F-KI cells (Supplementary Figure S2B). We noticed that the level of Y336F protein was about 50% of that of wild type (WT) cells. This reduction was not due to reduced translation, as our Ribo-seq data showed that the level of RPFs for Y336F protein was comparable to that of WT (Supplementary Table S2). The reduction was also likely not due to protein misfolding, because the overexpressed Y336F and WT TOP3B proteins exhibited comparable levels (15). We noticed that the fraction of Y336F mutant protein binding to mRNA in cells was reduced by about 10% when compared with WT protein (15). This led us to propose that topoisomerase reactions may allow TOP3B to stably associate with DNA or RNA, which may protect the protein from degradation. Inactivating the topoisomerase activity with the Y336F mutation may reduce the ability of TOP3B to interact with DNA or RNA, resulting in the accelerated turnover of unbound and unprotected TOP3B.

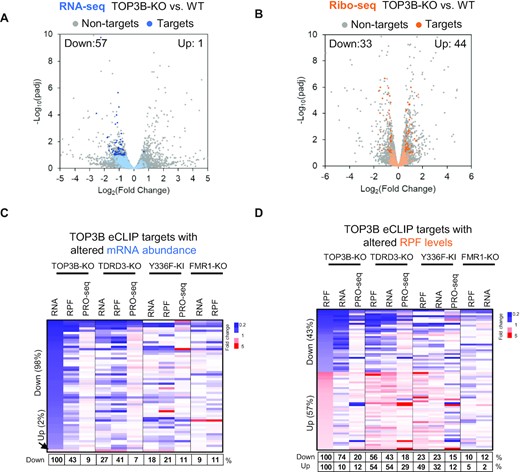
Ribo-seq and RNA-seq reveal diverse changes of gene expression in TOP3B-KO HCT116 cells. (A) A schematic diagram displaying the experimental design procedure. The details are described in the Results. (B) Volcano plots showing the numbers of down-regulated (left side) or upregulated (right side) differentially expressed genes (DEGs) in TOP3B-KO by RNA-seq (blue) or Ribo-seq (orange) from five independent experiments. The DEGs that showed statistically significant difference between KO versus WT were marked by colors, and were identified using DESeq2 (Fold change > 1.5, adjust P-values < 0.1). Fold changes and adjust P-values were log-transformed. The numbers of decreased (down) or increased (up) DEGs are indicated in the graphs. The DEGs that did not show statistically significant difference were marked by gray color. (C) A heatmap shows expression changes (in fold change) between TOP3B-KO versus WT for the DEGs identified by Ribo-seq. The DEGs with decreased or increased signals were marked by blue and red, respectively. The decreased or increased DEGs were each divided into four groups based on their RPF, RNA-seq and PRO-seq levels as described in the main text. Groups I and II represent DEGs altered in mRNA translation and turnover (stability) but not transcription; whereas Groups III and IV represent DEGs altered in transcription. Several representative genes altered at post-transcriptional levels were marked on the right.
We have also attempted to study TOP3B function using siRNA depletion. However, RNA-seq showed that many genes downregulated in TOP3B-KO and Y336F-KI cells exhibited normal expression in siRNA-treated cells, even though TOP3B mRNA was depleted by 80% (data not shown), suggesting that the siRNA approach is not suitable for studying catalytic function of TOP3B. The data also supports that the effect observed in Y336F-KI cells should not be caused by 50% reduction of TOP3B protein.
We used the cell lines generated above to study the function of TOP3B–TDRD3 and FMRP in mRNA translation by Ribo-seq, in mature mRNA level regulation by RNA-seq, and in nascent mRNA level regulation by PRO-seq (Figure 1A) (27). Comparison of levels between nascent and mature transcripts can also reveal whether the mRNA turnover is altered, because those showing the same levels of nascent but different levels of mature transcripts should be due to altered mRNA turnover (40). Ribo-seq (or Ribosome profiling) monitors translation of mRNAs genome-wide by quantifying ribosome-protected RNA fragments (RPFs) (24). To identify mRNAs bound by TOP3B–TDRD3, we performed eCLIP-seq (41) using a TOP3B antibody. Because TOP3B is a dual-activity topoisomerase that can regulate transcription (7,13), a possibility exists that the effect of TOP3B on translation and mRNA levels could be due to its effect on transcription. To distinguish the different effects of TOP3B, we used PRO-seq to identify genes regulated by TOP3B at the transcriptional level, and then excluded these genes when we analyzed the effect of TOP3B inactivation on translation and mRNA abundance.
As a proof of validity of our assays, the levels of RPFs and RNA-seq for TOP3B and TDRD3 genes were reduced in TOP3B-KO1 and TDRD3-KO cells, respectively (Supplementary Figure S3A–B & Figure S3D–E), consistent with absence of these proteins in their respective KO cells (Supplementary Figure S2A). In contrast, the levels of the PRO-seq for the same two genes remained unchanged (Supplementary Figure S3A and S3D), consistent with the notion that absence of these two proteins is not due to reduced transcription, but due to nonsense-mediated decay of mRNAs containing the out-of-frame mutations generated by CRISPR-Cas9. In addition, no obvious difference was observed for TOP3B mRNA in TOP3B-KO2 cells (Supplementary Figure S3C), which is also consistent with the finding that these cells express a truncated TOP3B protein (Supplementary Figure S1C).
TOP3B regulates translation and turnover of specific mRNAs
We analyzed our Ribo-seq data using two methods. One approach is based on RPF levels, which has been widely used to analyze Ribo-seq data (42–45), whereas the other analysis is based on RPF patterns (Figure 1A and Supplementary Results). The second method was used to detect ribosome stalling site (42–46), which could be missed by the first approach. Our results revealed that the TOP3B–TDRD3 complex and its topoisomerase activity have strong coordinated regulation on mRNAs identified by the first method than the second method. Therefore, we chose to describe the findings from the first method in the main Results, and those from the second method in Supplementary Results (Supplementary Figure S9–S11).
Scatter plot analysis of our Ribo-seq and RNA-seq data from both TOP3B-KO1 (3 replicates) and TOP3B-KO2 (2 replicates) cells revealed strong correlation between signals of KO cells and those of WT cells (R > 0.9) (Supplementary Figure S4A), indicating that TOP3B depletion does not alter global mRNA translation or abundance. This conclusion is further supported by polysome profiling analysis (47), which showed that the proportion of mRNAs under active translation (in the heavy polysome fractions) are indistinguishable between KO versus WT cells (Supplementary Figure S4B). We noted that the levels of RPFs from either WT or TOP3B-KO cells correlated well with those of RNA-seq (R = 0.80), but poorly with those of PRO-seq (R = 0.25, Supplementary Figure S4C), which are consistent with previous findings (48). The heatmaps below (Figure 3D–E and Figure 8C–D) also showed strong co-clustering between RPFs and RNA-seq signals, but not with those of PRO-seq, both in the TOP3B-KO, TOP3B-Y336F and TDRD3-KO cells. These data suggest that translation and mRNA levels are largely co-regulated with each other through post-transcriptional mechanisms.
We then investigated whether TOP3B inactivation can alter translation or turnover of specific mRNAs. Volcano plots revealed 478 differentially expressed genes (DEGs) by RNA-seq and 725 DEGs by Ribo-seq (Figure 1B and Supplementary Table S2, fold change > 1.5, adjusted P-value < 0.1) between TOP3B-KO versus WT cells. Examination of the 725 DEGs identified by Ribo-seq show that the percentage of decreased versus increased genes are 41% versus 59%, implying that TOP3B may affect translation either positively or negatively. Because translation of an mRNA is often affected by its transcription and turnover (49), some of these DEGs could be regulated by TOP3B at those steps rather than at translation per se. To identify mRNAs that were dependent on TOP3B for translation, we divided the decreased DEGs identified by Ribo-seq into four groups, based on whether these genes show concomitant decrease in RNA-seq (which reflects steady-state mRNA levels) and PRO-seq (which measures nascent transcript levels correlating with transcription) (Figure 1C and Supplementary Table S3). Group 1 DEGs showed no concomitant decrease in RNA-seq and PRO-seq levels, which should represent genes regulated by TOP3B at translation level only. Group 2 DEGs exhibited decreased signals in RNA-seq, but no change in PRO-seq signals, and thus should represent mRNAs with accelerated turnover. It is possible that the translation reduction is caused by accelerated mRNA turnover. However, it is equally possible that the accelerated mRNA turnover is caused by the translation reduction. For example, this group consists of TOP3B mRNA, whose abnormal translation in TOP3B-KO cells results in reduced mRNA levels (Supplementary Figure S3A,B) through no-go decay or nonsense-mediated decay mechanisms (50,51). Group 3 DEGs showed concomitant decrease in PRO-seq but no change in RNA-seq, whereas Group 4 DEGs showed decrease in both RNA-seq and PRO-seq (Figure 1C). The last two groups likely consist of genes regulated at the transcription step.
This analysis revealed that majority of the decreased DEGs belong to group I (61%) and II (18%), suggesting that TOP3B mainly acts post-transcriptionally to regulate translation and mRNA turnover. Analysis of the increased DEGs obtained similar results, as the most of the DEGs also belong to post-transcriptional groups (I and II) (Figure 1C). The number of decreased DEGs in groups 1 and 2 was comparable to that of increased DEGs (178 versus 237), supporting the notion that TOP3B can either or repress translation. Because we are interested in the functions of TOP3B in post-transcriptional regulation, we focused on DEGs of group 1 and 2 below.
We analyzed 4 representative genes (CHD8, SMC3, EML3 and FAT1) from groups 1 and 2, all of which exhibited no significant differences in PRO-seq (Figure 1C and Figure 2A-B), suggesting that they are regulated by TOP3B at the post-transcriptional level. Among them, the RPF levels of CHD8 and SMC3 are significantly reduced (adjust P-value < 0.01) (Figure 2A-B), whereas their mRNA levels are slightly reduced, but the difference does not reach statistical significance, indicating that their translation is reduced in TOP3B-KO cells (Figure 2A, B). Similarly, the RPF levels of EML3 is significantly increased, whereas its mRNA levels remain unchanged, suggesting increased translation efficiency for this gene. Moreover, the RPF and mRNA levels of FAT1 are both significantly increased in TOP3B-KO cells, which argue that regulation of this gene could occur at either translation, or mRNA turnover, or both steps. Notably, CHD8, SMC3 and FAT1 are autism risk genes (52). Among the DEGs by Ribo-seq, we identified 42 autism risk genes and 33 schizophrenia risk genes (Supplementary Table S4), supporting the hypothesis that TOP3B can regulate translation of genes important for mental disorders (Supplementary Figure S8A) (2,3).
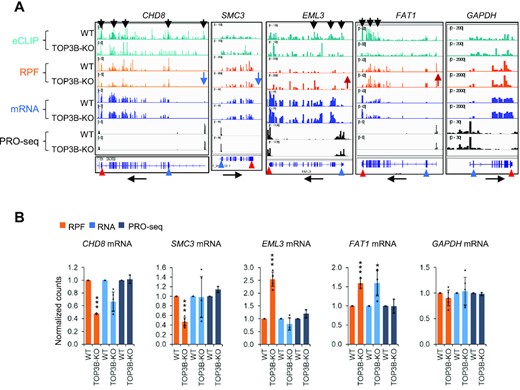
TOP3B regulates translation and turnover of specific mRNAs. (A, B) BedGraphs (A), and their quantifications (B), show four representative genes with altered RPF levels in TOP3B-KO cells. eCLIP-seq results show the binding of TOP3B to three of them. The RNA-seq and PRO-seq were included for comparison. The RNA-seq level for FAT1 was significantly altered in TOP3B-KO cells, whereas its PRO-seq level remained unchanged, suggesting that turnover of this mRNAs was altered. GAPDH was included as a control. The black arrows above the bedGraphs mark the TOP3B eCLIP peaks that were higher in WT and lower in TOP3B-KO cells (a negative control), whereas those below mark the transcriptional direction. Blue and red arrowheads (below) mark the positions of translation start and stop codons separately. Blue and red arrows (middle) mark the decrease or increase of the expression level separately. The data in (B) were shown in normalized counts generated by DESeq2. * = adjusted P-value < 0.1, ** = adjust P-value < 0.05, *** = adjust P-value < 0.01.
TOP3B co-regulates mRNA translation and turnover with TDRD3 and FMRP
We studied whether TOP3B and its two partners, TDRD3 and FMRP, co-regulate a common set of genes (Figure 3A). We reasoned that if these proteins act cooperatively, inactivating each protein should alter mRNA translation and abundance in the same direction. If they act antagonistically, inactivating each protein could alter mRNA in opposite directions. We analyzed TDRD3-KO and FMR1-KO cells using the same methods described above. The levels of RNA-seq and Ribo-seq of the two KO cells strongly correlated with those of WT cells (R > 0.95; Supplementary Figure S4D-E). These features resemble those of TOP3B-KO cells, suggesting that inactivation of TOP3B–TDRD3 and FMRP affects neither global mRNA levels nor translation. Volcano plots identified about 1000–1500 DEGs in TDRD3-KO cells by each assay; and about 58–161 in FMR1-KO cells (Figure 3B, C). The number of DEGs in TDRD3-KO cells is about twice those of TOP3B-KO (Figure 3B, C and Figure 1B), consistent with the earlier data that TDRD3 can function independently of the TOP3B–TDRD3 complex (53).
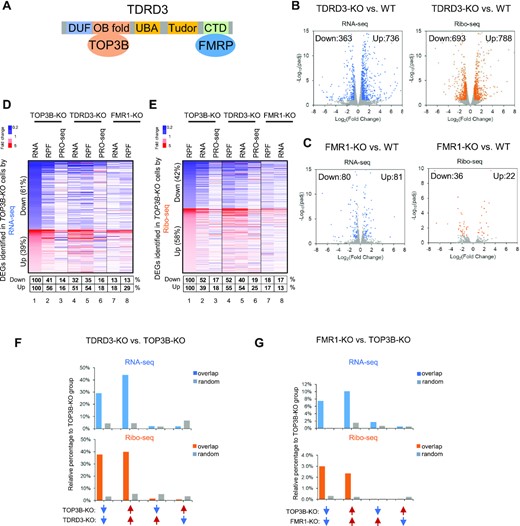
TOP3B co-regulates more genes with TDRD3 than with FMRP. (A) Schematic representation of the TOP3B–TDRD3-FMRP complex. (B, C) Volcano plots showing the numbers of down-regulated or upregulated DEGs in TDRD3-KO and FMR1-KO by RNA-seq (blue) or Ribo-seq (orange) from three independent experiments. Description of Volcano plots are described in Figure 1 Legend. (D, E) Heatmaps showing the concomitantly decreased (blue color) or increased (red color) expression changes of the DEGs in TOP3B-KO versus those of TDRD3-KO and FMR1-KO cells by RNA-seq (D) or Ribo-seq (E). The percentages below the maps were calculated by artificially setting the decreased or increased DEGs of TOP3B-KO cells as 100% (column 1). The percentages of the DEGs of TDRD3-KO or FMR1-KO cells that were altered in the same directions were shown in a table below the figure. The cutoff threshold for the increased or decreased DEGs is 1.5-fold. Notably, a stronger co-clustering was observed between TOP3B-KO and TDRD3-KO than that between TOP3B-KO and FMR1-KO (column 4 versus 7). (F) Graphs to compare the percentages of overlapping DEGs in the same or opposite direction of alteration vs. those randomly selected genes between TOP3B-KO and TDRD3-KO cells. The DEGs were identified by either RNA-seq (blue) or Ribo-seq (orange). The percentages were relative to the DEGs numbers of TOP3B-KO cells. The randomly selected genes were expression level matched, and the numbers were identical to that of the decreased or increased DEGs of TDRD3-KO cells. The percentages of these genes that were decreased or increased in RNA-seq or Ribo-seq of TDRD3-KO cells were then calculated. Blue arrows represented reduced, whereas red arrows represented increased DEGs. Arrows in the same direction depicted DEGs that were altered in the same direction in TOP3B-KO and TDRD3-KO cells. (G) The DEGs between TOP3B-KO and FMR1-KO were analyzed using the same method as (F). Note the scales on Y-axis are smaller in (G) than (F).
Heatmaps revealed that the percentages of commonly downregulated (blue color) or upregulated (red color) DEGs between TOP3B-KO and TDRD3-KO are more than those between TOP3B-KO and FMRP-KO in both RNA-seq and Ribo-seq assays (Figure 3D, E; compare columns 4 and 7). For example, the percentage of commonly decreased DEGs between TOP3B-KO and TDRD3-KO cells is about 3-fold higher than those between TOP3B-KO and FMR1-KO in RNA-seq (32% vs. 13%) and Ribo-seq (52% versus 18%) (Figure 3D, E). The data suggest that TOP3B coregulates more genes with TDRD3 than with FMRP. The findings correlate with the interaction data that TOP3B forms a stoichiometric complex with TDRD3, and only a minor fraction of this complex interacts with FMRP (2,3,54).
The Heatmap also revealed that very weak co-clustering between RNA-seq and PRO-seq signals for the DEGs in both TOP3B-KO and TDRD3-KO cells (Figure 3D). Specifically, the percentages of DEGs showing the same directions of alteration are about fewer than 20% (Figure 3D, lanes 3 versus 1; lanes 6 versus 4), whereas the majority (>80%) showing either no change or change in opposite directions, suggesting that these DEGs are mostly regulated at the step of mRNA turnover but not transcription by TOP3B–TDRD3.
We then assessed whether the observed percentages of DEGs of TOP3B-KO cells showing the same alteration in TDRD3-KO or FMR1-KO cells could happen by chance, using randomly selected and expression level-matched genes as controls. The results showed that the observed percentages are 6 to 10-fold higher respectively, than those of randomly selected genes in TDRD3-KO or FMR1-KO cells, indicating that these concomitantly altered DEGs are most likely co-regulated by TOP3B and its partners (Figure 3F, G). In contrast, the percentages of DEGs showing the opposite alterations between TOP3B-KO and TDRD3-KO are comparable to those of randomly selected genes (Figure 3F, G); and are about 4 to 20-fold fewer than DEGs altered in the same direction, indicating that TOP3B and TDRD3 largely acts in the same direction in mRNA level control and translation.
We also examined the four representative genes with altered expression in TOP3B-KO cells and found that they all display the same direction of alteration in TDRD3-KO cells, but not in FMR1-KO (Figure 4A, B), suggesting that TOP3B co-regulates more mRNAs in conjunction with TDRD3 than with FMRP at post-transcriptional steps. The findings that TOP3B cooperates with TDRD3 are consistent with earlier results that TDRD3 can stimulate the topoisomerase activity of TOP3B (8), and that the two proteins stabilize each other (7). In addition, the levels of PRO-seq signals were unchanged, whereas those from RNA-seq and Ribo-seq were changed in the same directions in TOP3B-KO and TDRD3-KO cells (Figure 4B versus 2B), suggesting that these mRNAs depend on the entire TOP3B–TDRD3 complex to regulate their turnover and translation.
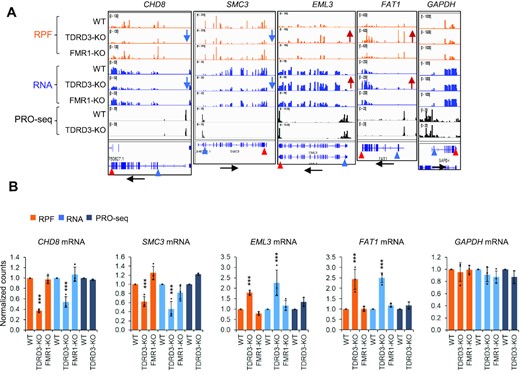
TOP3B and TDRD3 co-regulate translation and turnover of a group of mRNAs. (A, B) BedGraphs of sequencing read distributions (A), and bar graphs of quantification of these reads (B), show the Ribo-seq, mRNA and PRO-seq signals for five representative genes in TDRD3-KO and FMR1-KO cells. The RNA-seq levels for CHD8, SMC3, EML3 and FAT1 were altered in TDRD3-KO cells, whereas their PRO-seq levels remain unchanged, suggesting that turnover of these mRNAs was altered. Black arrows below mark the transcription direction. Blue and red arrowheads (below) mark the positions of translation start and stop codons separately. Blue and red arrows (middle) mark the decrease or increase of the expression level separately. The alteration for these mRNAs in TOP3B-KO and Y336F-KI cells are described in Figures 2A and 8A. Normalized counts were generated by DESeq2. *** = adjust P-value < 0.01.
TOP3B preferentially binds coding regions of long mRNAs
We performed eCLIP-seq (Figure 5A) to identify TOP3B-bound mRNAs in WT HCT116 cells using a TOP3B antibody (41). To exclude the nonspecific signals due to antibody cross reactivity, we included a mock eCLIP-seq in TOP3B-KO cells as a negative control. After subtraction of the signals from the negative control, we identified 1106 TOP3B-bound mRNAs based on two independent experiments in HCT116 cells (Supplementary Table S7). These include several representative mRNAs described above: CHD8, EML3 and FAT1 (Figure 2A). BedGraph analysis confirmed the presence of TOP3B peaks that are higher in WT than TOP3B-KO cells (Figure 2A), suggesting that TOP3B can specifically binds these mRNAs. As a negative control, bedGraphs also confirmed the eCLIP-seq data that TOP3B signals are not reduced in GAPDH and SMC3 mRNAs (Figure 2A). Interestingly, whereas the levels of RPFs are reduced in TOP3B-KO cells for CHD8 mRNA, they are increased for EML3 and FAT1 mRNA, suggesting that TOP3B can regulate translation of its bound mRNAs either positively or negatively.
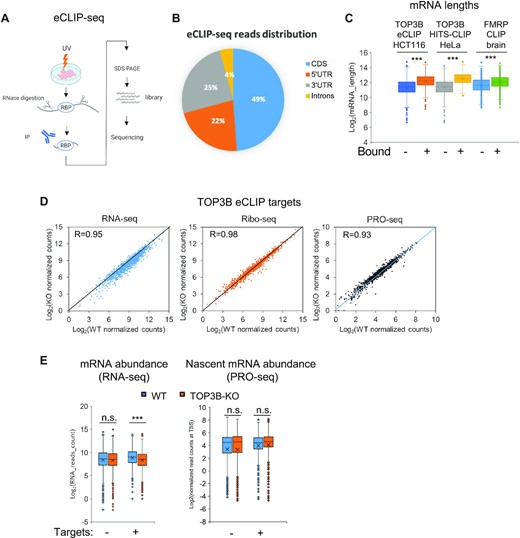
TOP3B preferentially binds coding region of long mRNAs and increases their stability. (A) Schematic overview of the major steps of eCLIP-seq (41). (B) A pie chart displaying TOP3B eCLIP-seq read density (tags/kb) distribution in CDS (coding sequence), 5’UTR, 3’UTR and introns. Reads from WT immunoprecipitation group were analyzed using RSeQC. (C) Box and Whisker plot showing longer average lengths of mRNAs bound by TOP3B than those that are unbound. The TOP3B-bound mRNAs were identified by eCLIP in HCT116 or HITS-CLIP in HeLa cells. The mRNAs bound by FMRP identified by HITS-CLIP in mouse brains were also shown (3,58). The mRNA lengths were log-transformed. (D) Scatter plots showing the strong correlations of RNA, RPFs or PRO-seq levels of TOP3B eCLIP targets between WT and TOP3B-KO cells. Notably, there are more mRNAs with reduced RNA-seq levels in TOP3B-KO HCT116 cells (left panel), whereas the numbers of mRNA with reduced or increased PRO-seq signals are comparable in the same cells (right panel), indicating increased turnover of TOP3B-bound mRNAs in the absence of TOP3B. (E) Box-Whisker plots showing that TOP3B eCLIP target mRNAs exhibit overall reduced levels of mature transcripts (left), but unchanged levels of nascent transcripts (right), in TOP3B-KO cells compared with WT cells. As a control, the randomly selected unbound mRNAs (also expression level matched) did not display this trend. These data suggest that TOP3B binding stabilizes its target mRNAs by reducing turnovers. ***P-value < 0.01; n.s., no significant.
We verified the eCLIP-seq data by performing RNA immunoprecipitation (RIP) RT-qPCR (55) for four representative mRNAs: two positive (CHD8 and FAT1), and two negative hits (ACTB and GAPDH). (Supplementary Figure S5A). Consistent with the eCLIP data, the TOP3B antibody co-immunoprecipitated with CHD8 and FAT1 mRNAs, but not ACTB and GAPDH mRNAs (Supplementary Figure S5A). As a control, TOP3B antibody immunoprecipitated TOP3B protein, but not beta-actin (Supplementary Figure S5A). Together, our data are consistent our earlier findings based on HITS-CLIP that TOP3B can bind specific mRNAs and regulate their translation and mRNA levels (3).
Comparison between the current and old TOP3B-bound mRNAs revealed that about 1/3 of the mRNAs identified by eCLIP matched those identified from HeLa cells by HITS-CLIP(3) (Supplementary Figure S5B). Those with higher eCLIP-seq signals tend to have higher HITS-CLIP signals (Supplementary Figure S5C), suggesting that TOP3B may recognize specific features of these mRNAs. We found several features that are common in TOP3B-bound mRNAs identified in the current and previous studies, which are also shared by FMRP-bound mRNAs. First, the largest fraction of TOP3B CLIP-reads (∼50%) are localized in coding regions of mRNAs (Figure 5B) (3), consistent with findings that TOP3B–TDRD3 associates with polyribosomes and regulates translation. Second, the average lengths of these mRNAs are significantly longer than that of randomly selected unbound mRNAs (Figure 5C) (3,56). This also resembles findings that TOP1 and TOP2-regulated genes tend to have longer average lengths and are enriched in those important for autism and neurological disorders (57). Third, a fraction of TOP3B-bound mRNAs (17%) from both current and previous studies overlapped with those bound by FMRP (Supplementary Figure S5B) (58), including many autism (https://gene.sfari.org/), and schizophrenia-related (http://bioinfo.mc.vanderbilt.edu/SZGR/) mRNAs (109 and 59, respectively) (Supplementary Figure S5D; Table S7), supporting the proposal that TOP3B may work with FMRP to regulate translation of mRNAs important for mental disorders (3).
TOP3B binding stabilizes its target mRNAs through catalytic activity-independent manners
We next examined the effects of TOP3B inactivation on its bound mRNAs in RNA-seq or Ribo-seq analyses. In both cases, the levels of RNA and RPFs in TOP3B-KO cells strongly correlate with those of WT cells (Figure 5D). Interestingly, there were more RNAs showing reduced levels in TOP3B-KO cells by RNA-seq (Figure 5D, left panel; more genes are below the equal line), but not by PRO-seq (Figure 5D, right panel; similar number of genes above and below the equal line), indicating accelerated turnover of these mRNAs in the absence of TOP3B. The data suggest that TOP3B can stabilize its target mRNAs by reducing turnovers. Consistent with this notion, the average RNA-seq levels of TOP3B-bound mRNAs were significantly reduced in TOP3B-KO cells (p<0.01), whereas those of randomly selected TOP3B-unbound mRNAs exhibited no significant difference (Figure 5E, left). Moreover, the average PRO-seq levels of the same mRNAs exhibited no significant reduction in TOP3B-KO cells (Figure 5E, right), confirming that the effect of TOP3B binding is on mRNA turnover, but not transcription. We then analyzed these TOP3B-bound mRNAs in Y336F-KI and TDRD3-KO cells, but did not observe a similar overall decrease (Supplementary Figure S6A-B), suggesting that stabilization of these mRNAs is independent of the topoisomerase activity or TDRD3.
Examination of the RPF levels of TOP3B target mRNAs revealed the number of increased and decreased DEGs are roughly equal (Figure 5D, middle panel), suggesting that TOP3B binding does not have a preference to increase or decrease translation of its bound mRNAs.
We then overlapped the TOP3B-bound mRNAs with the DEGs in TOP3B-KO cells identified by RNA-seq and Ribo-seq (Figure 6A,B). A minor fraction of TOP3B-bound mRNAs (about 5%; 58 out of 1106) displayed significantly altered RNA-seq levels in TOP3B-KO cells (fold change>1.5 fold; p<0.05) (Figure 6A; Supplementary Table S8). Consistent with the overall trend (Figure 5D,E), among those with altered mRNA levels, almost all of them (57 of 58) were decreased, whereas only one mRNA (FAT1) was increased (Figure 6A and C). Notably, only 9% of these decreased DEGs showed reduction by PRO-seq analysis, whereas majority (91%) did not (Figure 6C), indicating that this decrease in RNA-seq signals is mostly due to increased mRNA turnover, but not reduced transcription. As examples, two representative mRNAs, AGRN and KIAA0100, were bound by TOP3B; and their RNA-seq, but not PRO-seq, signals were significantly reduced in both TOP3B-KO and TDRD3-KO, but not in Y336F-KI cells (Supplementary Figure S7A, B), indicating that their mRNA turnover is reduced by TOP3B–TDRD3 binding but not topoisomerase activity.
TOP3B binding preferentially reduces mRNA turnover but affects translation in either directions. (A, B) Volcano plots showing the expression changes of TOP3B eCLIP targets by RNA-seq (A) or Ribo-seq (B). The target mRNAs were colored in blue or orange, whereas the non-target mRNAs were in gray. The target mRNAs exhibiting significant difference between KO vs. WT cells were shown in darker blue or orange colors. The description of Volcano plots were in Figure 1 Legend. (C, D) Heatmaps showing the expression changes of the TOP3B-bound mRNAs determined by RNA-seq (C) or Ribo-seq (D), in different KO and KI mutant cells indicated on the top. The percentages below the maps were calculated by artificially setting the decreased or increased DEGs of TOP3B-KO cells as 100% (column 1 of each graph). The percentages of these DEGs altered in the same directions in other KO or KI mutant cells were shown in a table below the figure. The DEGs identified by different Seq methods from each cell type were included in the analysis. The cutoff threshold for the increased or decreased DEGs is 1.5-fold. Notably, the TOP3B targets with altered mRNA abundance were nearly all deceased in TOP3B-KO cells by RNA-seq (C, lane 1), whereas only 9% of them were decreased by PRO-seq (lane 3), indicating that majority (91%) of these mRNAs have increased turnover. Moreover, the TOP3B targets with altered RPF levels were either increased or decreased (D, lane 1), indicating that TOP3B binding can affect translation in either directions.
Our analysis of TOP3B-bound mRNAs in Ribo-seq found that the numbers of mRNAs showing significantly decreased or increased signals are comparable (33 vs. 44) (Figure 6B and D), suggesting that TOP3B binding may either enhance or suppress translation of its target mRNAs. Notably, more than half of them (56%) also showed the same trends in TDRD3-KO cells, whereas only 10% showed this trend in FMR1-KO cells, indicating that majority of these mRNAs are co-regulated by TDRD3, but a very small fraction is co-regulated with FMRP (Figure 6D). In addition, about 20–40% of them display the same trends in Y336F-KI cells (Figure 6D), suggesting that TOP3B may depend on its topoisomerase activity to regulate normal translation for a small fraction of mRNAs.
TOP3B regulates mRNAs in both topoisomerase-dependent and -independent mechanisms
We analyzed the data from Y336F-KI cell line in details to study whether TOP3B depends on its topoisomerase activity to function. The RNA-seq and Ribo-seq signals of Y336F-KI cells strongly correlated with those of WT cells (Supplementary Figure S4F; R = 0.95), which resemble those of TOP3B-KO cells (Supplementary Figure S4A), suggesting that inactivating either TOP3B topoisomerase activity or the entire protein does not affect global mRNA levels or translation. Our RNA-seq and Ribo-seq analyses identified 1737 and 488 DEGs, separately, in Y336F-KI cells (Figure 7A; Supplementary Table S2). Comparison of these DEGs with those of TOP3B-KO cells revealed the percentages of commonly decreased and increased DEGs: 21% and 42%, respectively by RNA-seq; and 12% and 13%, respectively by Ribo-seq (Figure 7B–E; Supplementary Table S5). We then assessed whether the commonly regulated DEGs of Y336F-KI and TOP3B-KO cells might occur by chance using identical numbers of randomly selected and expression level-matched genes as comparisons. We found that the observed percentages of the commonly decreased or increased DEGs are about 6- to 10 -fold greater than those of the randomly selected genes (Figure 7B; Supplementary Table S5), implying that the commonly altered DEGs are unlikely to occur by chance, but are most likely co-regulated by TOP3B and its catalytic activity. We refer to these genes as the TOP3B-Catalytic-Activity-dependent Genes (abbreviated as TCAGs) (marked as “+” in Figure 7C, D). Conversely, the percentages of DEGs that are altered in opposite directions between TOP3B-KO and Y336F-KI cells are 3–10-fold lower than those of DEGs that altered in the same direction and are more similar to those of randomly selected genes (Figure 7B), indicating that TOP3B protein and its catalytic activity usually function in the same direction.
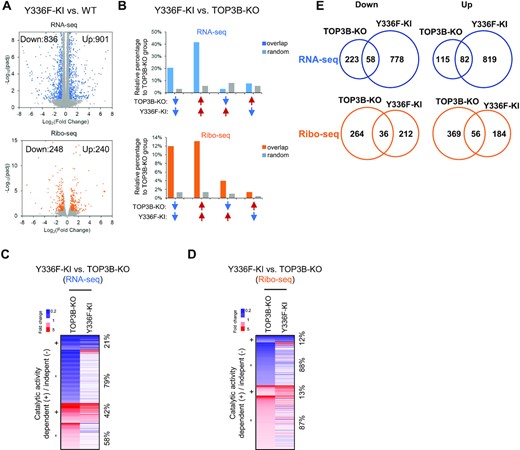
TOP3B regulates mRNAs in its topoisomerase activity dependent and independent manners. (A) Volcano plots showing the number of DEGs in Y336F-KI cells by RNA-seq (up) or Ribo-seq (down). The description of Volcano plots is in Figure 1B Legend. (B) Graphs to compare the percentages of overlapped DEGs in the same or opposite directions of alteration between Y336F-KI and TOP3B-KO groups vs. those randomly selected genes. The percentages were relative to the DEGs numbers of TOP3B-KO group. The randomly selected genes were expression level matched, and the numbers were identical to that of the decreased or increased DEGs of Y336F-KI cells. Blue arrows represent reduced, whereas red arrows represent increased DEGs. Arrows in the same direction depicted DEGs that were altered in the same direction in TOP3B-KO and Y336F-KI cells. (C, D) Heatmaps display the DEGs in TOP3B-KO which were overlapped with those of Y336F cells by RNA-seq (C) or Ribo-seq (D). The DEGs with decreased or increased signals (fold changes) were marked by blue and red, respectively. The overlapped DEGs that were altered in the same directions were marked as “+”, whereas the others were marked as “–”. The percentages of the overlapped or non-overlapped DEGs were shown on the right. (E) Venn diagrams showing the overlapped DEGs between TOP3B-KO and Y336F-KI cells.
Our heatmap analysis showed that a large fraction (about 58-88%) of the decreased or increased DEGs by RNA-seq or Ribo-seq in TOP3B-KO cells did not overlap with those in Y336F-KI cells (Figure 7C, D), suggesting that TOP3B may also regulate translation and RNA levels using mechanisms independent of its topoisomerase activity. Similarly, a large fraction (about 90%) of DEGs in Y336F-KI cells do not overlap with those of TOP3B-KO cells (Figure 7E), hinting that the TOP3B-Y336F protein may act as a gain-of-function mutant, which can alter mRNA levels and translation in ways that are different from that caused by loss of the protein (see Discussion).
We also examined the four representative mRNAs that are altered in TOP3B-KO cells and found that three of them (CHD8, EML3 and FAT1) exhibit the same direction of alteration in Y336F-KI cells: decreased or increased by Ribo-seq and RNA-seq analyses, and unchanged by PRO-seq analyses (Figure 8A, B). The fourth mRNA (SMC3) also exhibited the same pattern of alteration, except that its reduction of Ribo-seq signals did not reach statistical significance (Figure 8B). The findings that the levels of PRO-seq signals are unchanged, whereas those of RNA-seq and Ribo-seq are changed in the same directions in TOP3B-KO and Y336F-KI cells suggest that these mRNAs depend on the topoisomerase activity of TOP3B to regulate their turnover and translation.
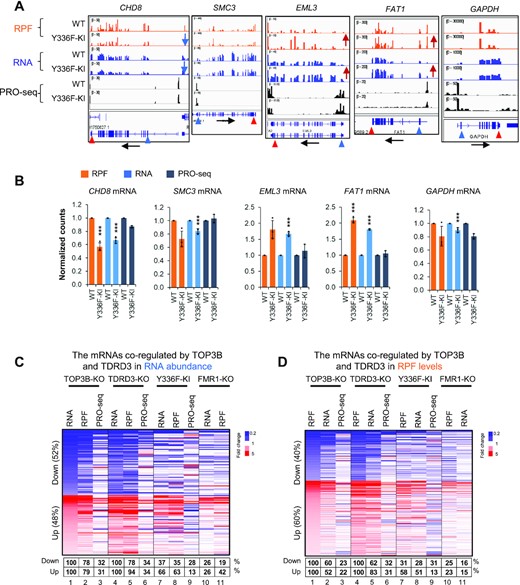
TOP3B requires its topoisomerase activity to regulate translation and turnover of specific mRNAs. (A) BedGraphs of sequencing read distributions, and bar graphs of quantification of these reads (B), show the Ribo-seq, RNA-seq and PRO-seq signals for five representative genes. The RNA-seq levels for CHD8, SMC3, EML3 and FAT1 mRNAs were altered in Y336F-KI cells, whereas their PRO-seq levels remain unchanged, suggesting that turnover of these mRNAs was altered. The alteration of these genes in TOP3B-KO cells were described in Figure 2A. The bar graphs show the normalized counts from three biological replicates. *** = adjust P-value < 0.01. (C, D) Heatmaps showing how the concomitantly decreased (blue color) or increased (red color) DEGs in both TOP3B-KO and TDRD3-KO cells were overlapped with the DEGs in TOP3B-Y336F and FMR1-KO cells by RNA-seq (C) or Ribo-seq (D). The percentages below the maps were calculated by artificially setting the decreased or increased DEGs of both TOP3B-KO and TDRD3-KO cells as 100% (column 1 and 4 of each graph). The percentages of the DEGs of TOP3B-Y336F or FMR1-KO cells that were altered in the same directions were shown in a table below the figure. The DEGs identified by different Seq methods from each cell type were included in the analysis. The cutoff threshold for the increased or decreased DEGs is 1.5-fold. Notably, a stronger co-clustering was observed between TOP3B-KO/TDRD3-KO and TOP3B-Y336F than that between TOP3B-KO/TDRD3-KO and FMR1-KO (column 7 versus 10). In addition, a stronger co-clustering was also detected between the levels of RPF and RNA than with PRO-seq for each cell type.
A fraction of mRNAs regulated by TOP3B–TDRD3 are affected by TOP3B enzymatic activity
The Ribo-seq data above revealed that the percentages of mRNAs that are co-regulated by TOP3B and its associated topoisomerase activity in translation are very low–12% and 13% for decreased and increased DEGs, respectively. This prompted us to investigate whether the mRNAs that are co-regulated by the entire TOP3B–TDRD3 complex may show a higher degree of dependence on TOP3B topoisomerase activity. We hypothesize that the mRNAs altered in the same directions from both TOP3B-KO and TDRD3-KO cells (Figure 3D, E and Supplementary Table S6) are co-regulated by the entire TOP3B–TDRD3 complex and investigated how these mRNAs are affected in TOP3B-Y336F and FMR1-KO cells using heatmaps. Comparing to WT cells, the percentage of decreased mRNAs in both TOP3B-KO and TDRD3-KO cells is roughly equal to that of the increased mRNAs in RNA-seq (52% versus 48%); and about 50% fewer in Ribo-seq (40% versus 60%) (Figure 8C, D), suggesting that the TOP3B–TDRD3 complex can affect gene expression either positively or negatively. There is strong overlap between RNA-seq and Ribo-seq data in both TOP3B-KO and TDRD3-KO cells: 60–78% for the decreased DEGs, and 52–94% for increased DEGs (Figure 8C, D), suggesting a coordinated regulation by TOP3B–TDRD3. To determine whether the complex acts transcriptionally or post-transcriptionally, we analyzed PRO-seq levels for these DEGs, and found that only about 20–30% of these DEGs exhibit the same directions of alteration, whereas majority (70–80%) do not (Figure 8C, D), which suggest that the TOP3B–TDRD3 complex mainly regulates gene expression post-transcriptionally, in mRNA translation and turnover.
We found that for TOP3B–TDRD3 co-regulated mRNAs identified above, about one-third of their decreased DEGs and two-thirds of their increased DEGs, exhibited the same directions of alteration in Y336F-KI cells by either RNA-seq or Ribo-seq assays (Figure 8C-D). We noticed in the two sets of comparisons by Ribo-seq: the percentage of TOP3B–TDRD3 co-regulated mRNAs altered in the same directions in Y336F-KI cells (31% and 58%, for decreased and increased DEGs, respectively) are 2–5-fold higher than those altered in the same directions between TOP3B-KO and Y336F-KI cells (12% and 13%, respectively). The data suggest that the mRNAs regulated by the entire TOP3B–TDRD3 complex are more dependent on topoisomerase activity than those regulated by TOP3B alone.
We also analyzed TOP3B–TDRD3 co-regulated mRNAs in FMR1-KO and found that about 20–30% of them were altered in the same directions by RNA-seq or Ribo-seq (Figure 8C, D, columns 7 and 10). The data thus suggest that some but not all mRNAs regulated by the TOP3B–TDRD3 complex are under the control of the topoisomerase activity of TOP3B and FMRP.
TOP3B promotes translation of CHD8 mRNA resulting in an increase of its mRNA stability
The data above based on RPF level analysis suggested that CHD8 mRNA was bound and translationally regulated by TOP3B–TDRD3 in a topoisomerase activity dependent manner. Our analysis based on RPF patterns produced a list of mRNAs containing ribosome stalling site (Supplementary Results; Supplementary Table S10), but CHD8 is not on the list. A codon-by-codon bedGraph analysis confirmed that RPF levels in CHD8 mRNA are largely continuously reduced throughout the CDS region in TOP3B-KO cells, and do not display a pattern of ribosomal stalling (Supplementary Figure S11A versus Figure 2A). This resembles that of TOP3B transcript, which serves as a positive control showing a similar continuous reduction in TOP3B-KO cells, but differs from that of GAPDH mRNA, which shows no reduction (Supplementary Figure S11C, D).
We used two other methods, polysome profiling coupled with RT-qPCR and immunoblotting (47), to verify the Ribo-seq data that CHD8 mRNA translation is reduced in the absence of TOP3B. Polysome profiling showed that the peak of CHD8 mRNA in the heavy actively translating polysome fractions of TOP3B-KO cells was decreased, while the RNA associated with the light polysome fractions was increased, in comparison to that of WT cells (Figure 9A), consistent with the Ribo-seq data showing that CHD8 translation was reduced. As controls, the level of TOP3B mRNA (positive control) was also decreased in the heavy polysome fractions but increased in the lighter molecular weight polysomes in TOP3B-KO cells; and the distribution of GAPDH mRNA encoding a housekeeping gene was similar in both cell types, as expected (Figure 9A). Immunoblotting further confirmed reduced CHD8 protein levels in TOP3B-KO, TDRD3-KO and Y336F-KI cells, but not in FMR1-KO cells; and the levels of a loading control protein, GAPDH, was unchanged in all cells (Figure 9B). These data are consistent with the Ribo-seq data from all four mutant cells generated by CRISPR-Cas9, and suggest that the translation of CHD8 mRNA is facilitated by the entire TOP3B–TDRD3 complex and its topoisomerase activity.
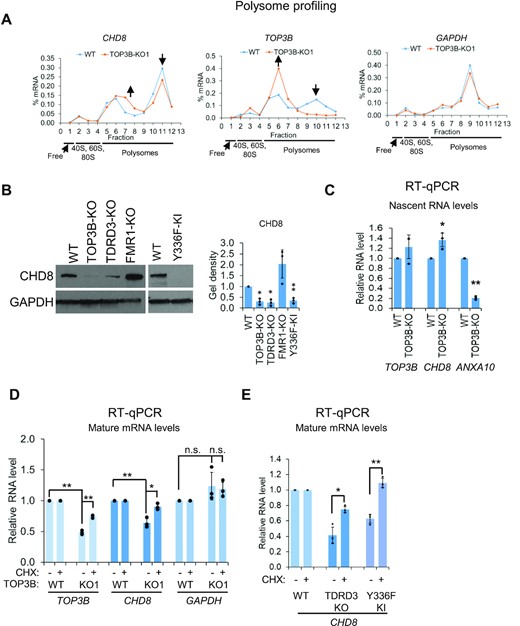
The deficiency of TOP3B reduces the translation of CHD8 mRNA resulting in a reduction of CHD8 mRNA stability. (A) Graphs from polysome profiling analysis show the reduced translation of CHD8 mRNA in TOP3B-KO cells, as evidence by its decreased level in the heavy polysome fractions, and increased level in light polysome fractions. The relative distributions (%) of the mRNAs on the sucrose gradients were quantified by RT-qPCR analysis. TOP3B and GAPDH were used as controls. The translation of TOP3B mRNA was significantly reduced in TOP3B-KO1 cells caused by pre-mature stop codon induced by CRISPR-Cas9 editing. No obvious difference of the translation was observed for GAPDH mRNA. The results were reproducible, but only one representative result was shown here. (B) Immunoblotting images and quantification show that CHD8 protein levels were reduced in TOP3B and TDRD3 mutant cells, but not in FMR1-KO cells, as indicated on top. (C) The nascent mRNA levels of representative genes were detected by RT-qPCR. The results showed that there was no significant change for TOP3B gene, slightly increased for CHD8 and significantly reduced for ANXA10 gene, which were consistent with the PRO-seq results (Supplementary Table S1). (D, E) RT-qPCR results showing the mRNA levels of the representative genes. Cycloheximide (CHX) treatment (100μg/ml) for 3 hours increased TOP3B and CHD8 mRNA levels in TOP3B-KO cells compared with non-treatment cells (D). CHX treatment also increased CHD8 mRNA levels in TDRD3-KO and Y336F-KI cells (E). These data indicate that the reduced mRNA levels of TOP3B and CHD8 were translation related. For the bar graphs, all the values are normalized to WT and log-transformed before P-value calculation *P-value < 0.05, **P-value < 0.01.
We noticed that there was a slight (20–30%) and insignificant (P > 0.05) reduction of CHD8 mRNA level by RNA-seq in TOP3B-KO cells (Figure 2B). RT-qPCR, which is more quantitative than RNA-seq, confirmed this reduction (about 30%), and found it to be statistically significant (P < 0.05) (Figure 9D). As a control, no significant difference was observed in GAPDH mRNA level. This reduction of CHD8 mRNA level should not be caused by decreased transcription, because the nascent transcript level of CHD8 in TOP3B-KO cells was found to be unchanged by PRO-seq (Figure 2B), or increased by RT-qPCR (Figure 9C). As a positive control, a gene regulated by TOP3B in transcription based on PRO-seq (Supplementary Table S1), ANXA10, showed reduced nascent RNA level by RT-qPCR (Figure 9C). As a negative control, TOP3B transcript showed no change in nascent RNA levels by PRO-seq and RT-qPCR in TOP3B-KO cells (Supplementary Table S1; Figure 9C).
It is known that the mRNA substrates of translation-associated mRNA decay pathways can be destabilized by translation, and this destabilization can be reversed by inhibiting translation elongation (46,59,60). To study whether CHD8 mRNA becomes a substrate of these pathways when TOP3B–TDRD3 is inactivated, we pre-treated cells with a translational elongation inhibitor, cycloheximide (CHX), which should stabilize the mRNAs subject to translation-associated mRNA decay (61). The CHD8 mRNA in TOP3B-KO, but not WT cells, was significantly increased by CHX treatment (Figure 9D), indicating that the reduced level of this mRNA is due to aberrant translation in the absence of TOP3B. As a positive control, TOP3B mRNA level was also increased by CHX treatment in TOP3B-KO1 but not WT cells (Figure 9D). This is expected because the TOP3B frameshift mutations in KO1 cells create premature stop codons in the earlier exons, making this mRNA a substrate of nonsense-mediated mRNA decay (NMD) that can be stabilized by inhibiting translation elongation (61). As another control, CHX treatment did not affect the mRNA level of GAPDH. Notably, the reduction of CHD8 mRNA in TDRD3-KO and Y336F-KI cells can also be rescued by inhibiting translation with CHX treatment (Figure 9E). Together, these data suggest that TOP3B–TDRD3 and its topoisomerase activity promote normal translation of CHD8 mRNA, and this process stabilizes the mRNA by preventing it from translation-associated decay (see model in Figure 10A).
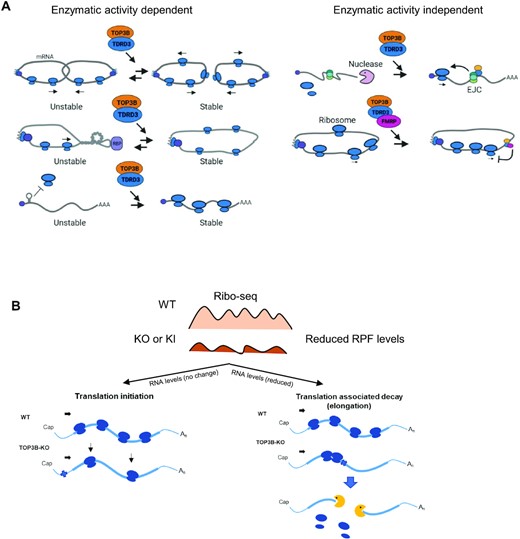
Models showing the roles of the TOP3B–TDRD3 complex in mRNA translation and turnover. (A) Models to explain how TOP3B–TDRD3 can regulate mRNA translation in topoisomerase activity dependent (left panel) and independent manners (right panel). The left panel shows three models. One, the TOP3B–TDRD3 complex may resolve (decatenate) two tangled mRNAs to promote their translation and stability. This model is supported by in vitro assays showing TOP3B can catalyze catenation of RNA circles (3,8). Two, an mRNA may become topologically constrained by circularization during translation. A supercoil or knot-like structure may be formed and required an RNA topoisomerase to release (3). It is possible that TOP3B may induce formation of the above topological structures to repress translation. Three, The TOP3B–TDRD3 complex may promote translation initiation by resolving topological stress at 5’UTR regions. The right panel shows two models of enzymatic activity independent mechanisms. The first model suggests the TOP3B–TDRD3 complex may recruit EJC complex to its target mRNAs to enhance their translation and reduce their degradation by nucleases (2). The second model depicts that TOP3B–TDRD3 may regulate translation of its targets by recruiting FMRP (2,3,9). (B) A cartoon shows two models to explain how TOP3B regulates translation of mRNAs that show continuous reduction of RPF levels across the entire CDS region. This RPF pattern (top) has been observed in all representative differentially-expressed mRNAs in the main figures (Figure 2A). Both models predict that inactivation of TOP3B–TDRD3 induces topological stress in mRNAs (marked by a cross). The first model hypothesizes that the stress inhibits initiation, whereas the second model suggests that it inhibits elongation. The second model fits mRNAs (such as CHD8) that are subject to translation-associated mRNA decay(46), whereas the first model fits other mRNAs (such as SMC3) that show no reduction of their levels. See Supplementary Figure S11 for RPF patterns of CHD8 and SMC3 mRNAs on codon-by-codon beGraphs. The details are described in the main text. The nucleases are depicted by yellow.
DISCUSSION
TOP3B–TDRD3 and its topoisomerase activity can regulate mRNA translation and turnover
One challenging question for the topoisomerase field is whether mRNA metabolism produces topological stress that depends on a topoisomerase to solve. TOP3B has been suggested to work with TDRD3 and FMRP to regulate mRNA translation (3,7,13,15), but direct evidence supporting this suggestion is lacking. It also remains unclear whether TOP3B depends on its topoisomerase activity to function on mRNA. Here, we analyzed mRNA translation and turnover in HCT116 cells in which TOP3B was depleted, or the TOP3B catalytic activity was inhibited, or one of its two partners was ablated. We obtained evidence that TOP3B–TDRD3 can bind specific mRNAs and regulate their translation and turnover in topoisomerase activity-dependent or independent manners. To our knowledge, our findings provide the first evidence indicating the importance of a topoisomerase and its associated enzymatic activity in mRNA translation. Moreover, our data suggest that mRNA metabolism could produce topological stress that depends on a topoisomerase to solve. However, because we were unable to identify the exact topological stress generated during mRNA translation, future work is needed to identify such stress to provide a more conclusive answer to this important question.
We demonstrated that one representative mRNA, CHD8 mRNA, is bound by TOP3B–TDRD3 and regulated in a topoisomerase activity dependent manner. We found that in cells lacking either subunit of the TOP3B–TDRD3 complex or TOP3B catalytic activity, CHD8 mRNA shows reduced translation, lower abundance, and increased turnover; and the CHD8 protein similarly displays decreased levels in these mutant cells. Interestingly, we found that the lower CHD8 mRNA abundance was due to abnormal translation because inhibiting translation elongation can restore the levels of CHD8 mRNA in all three mutant cells. This feature resembles that of mRNA substrates of translation-associated decay pathways, which can also be stabilized by inhibiting translation (59). The data support a model whereby when TOP3B–TDRD3 and its catalytic activity are inactivated, CHD8 mRNA translation may produce topological stress, which not only reduces translation, but also activates translation-associated decay pathways to degrade the transcript. This model is consistent with our earlier proposal that mRNA translation can produce topological problems that depend on a topoisomerase to solve (Figure 10A, left) (3,4).
We noted that whereas some mRNAs bound by TOP3B–TDRD3 are positively regulated in translation (such as CHD8 mRNA), others are negatively regulated (such as EML3 and FAT1 mRNAs). We have previously discussed several models on how TOP3B may negatively regulate mRNA metabolism (62). One model is based on findings that TOP3B can induce formation of RNA catenanes and knots (3,8), which may repress translation (Figure 10A, left). It is worth noting that other topoisomerases (TOP1 and TOP2) have also been reported to negatively regulate gene expression (63,64), akin to what we see for some TOP3B targets.
TOP3B–TDRD3 may function at either initiation or elongation during mRNA translation
We studied how TOP3B–TDRD3 regulates translation by analyzing both RPF levels and distribution patterns in cells lacking TOP3B, TDRD3 or TOP3B enzymatic activity, and found that the strongest effect by coordinated actions of the complex and its topoisomerase activity is on RPF levels. This is evidenced by either decreased or increased RPF levels across the entire CDS regions of many mRNAs in all three mutant cells (TOP3B-KO, TDRD3-KO and Y336F-KI) (Figure 10B; also see Figure 2A, 4A, and 8A for the RPF patterns of 4 representative mRNAs), suggesting that TOP3B–TDRD3 can either enhance or reduce translation. This pattern resembles those observed in Ribo-seq data from Fmr1-KO mice or flies (65,66,49), hinting that TOP3B–TDRD3 and FMRP may share common molecular mechanisms of action. We propose two models to explain the observed RPF pattern for this group of mRNAs. The first model hypothesizes that inactivation of TOP3B–TDRD3 can alter translation initiation, which can lead to either decreased or increased Ribo-seq signals throughout the entire CDS, but no change in RNA-seq levels (Figure 10B; see representative SMC3 mRNA in Supplementary Figure S11B). This model predicts that TOP3B–TDRD3 may either relieve or induce topological stress within the 5’-UTR or near the start codon.
The second model hypothesizes that inactivation of TOP3B–TDRD3 can result in faulty translation elongation, which renders the mRNA a substrate of ribosome quality control (RQC) pathways (67,68) (Figure 10B). The model further predicts the existence of topological stress during mRNA elongation in cells inactivated of TOP3B–TDRD3, leading to ribosomal collision or stalling. It has been reported that ribosome collision or stalling often makes the translating mRNA a substrate of RQC pathways (67,68). This model can explain the observed findings for transcripts such as CHD8 mRNA, whose RPF levels and mRNA levels are both reduced in the TOP3B–TDRD3 mutant cells, and the reduction in mRNA levels can be restored by inhibiting translation elongation (Figure 10B; Figure 9D-E; Supplementary Figure S11A). We have specifically searched for mRNAs containing ribosomal stalling based on their RPF patterns (Supplementary Results), but the obtained lists do not include CHD8 mRNA (Supplementary Table S10-11). The rapid degradation of these mRNAs may preclude us from detecting the stalled ribosomes. Future work using new methods such as disome-seq analysis (69) may help to detect the stalled ribosomes in these mRNAs.
TOP3B–TDRD3 can function in topoisomerase activity-independent mechanisms
If the only function of TOP3B is to catalyze topoisomerase reaction, the DEGs from cells inactivated of its catalytic activity (Y336F) are expected to strongly overlap with those from its KO cells, which lack the entire protein. However, our RNA-seq and Ribo-seq datasets showed that the majority of DEGs from these two cells do not overlap, suggesting that TOP3B should have more functions than that of a catalytic enzyme. Consistent with this notion, the current evidence suggests that TOP3B protein has at least three activities: one, it catalyzes topoisomerase reactions; two, it binds mRNAs through its RGG box domain, which should stabilize mRNAs as other RNA-binding proteins do; and three, it stabilizes TDRD3, which allows TDRD3 to act as a scaffold to assemble multiprotein complexes with other regulatory molecules, including pol II, FMRP, and EJC. TOP3B-Y336F is a loss-of-function mutant for only the first activity, whereas TOP3B-KO has lost all three, which may provide a partial explanation on why majority of DEGs from the two mutant cells do not overlap. Moreover, in Y336F-KI cells, the mutant protein may have a “gain-of-function”, as the catalytically inactive TOP3B-Y336F-TDRD3 complex should still be able to interact with pol II, FMRP and EJC, as well as to DNA and RNA targets to block the access of other DNA or RNA processing enzymes. These events may trigger downstream effects not found in WT cells, resulting in different set of DEGs compared to TOP3B-KO cells in which TOP3B–TDRD3 is completely absent on DNA or RNA. Thus, it is possible that some DEGs observed in Y336F-KI cells are not due to loss of TOP3B catalytic activity, but due to gain-of-function of the TOP3B-Y336F mutant complex. Although using a single-point knock-in mutation in cell lines or animals to determine the importance of the catalytic activity of an enzyme is a widely accepted strategy, this strategy is not perfect, as the enzyme may be part of a multiprotein complex (as is TOP3B), and the catalytically inactive complex could have a gain-of-function. Future work is needed to distinguish the effects of loss-of-function from those of gain-of-function for TOP3B-Y336F mutant. Nevertheless, our unpublished studies showed that Y336F-KI cells resemble TOP3B-KO cells in defective stress-induced transcription (manuscript in preparation). The results are consistent with the prevailing model that topoisomerases depend on their catalytic activity to stimulate transcription. The data could serve a positive control indicating that the defective gene expression observed in Y336F-KI cell line can be caused by loss of TOP3B catalytic function.
A word of caution should be included that our findings on TOP3B topoisomerase activity-dependent and independent mechanisms are based on one catalytic mutant of TOP3B (Y336F). These findings need to be verified using additional loss-of-catalytic function mutants of TOP3B in the future.
How does TOP3B–TDRD3 function on mRNA in topoisomerase activity-independent mechanisms? Our findings that TOP3B-bound mRNAs show overall reduced levels in TOP3B-KO but not Y336F-KI cells (Figure 5D & Supplementary Figure S6A) suggest that one such mechanism is through mRNA binding, which can stabilize its targets. It is known that many RNA binding proteins (RBPs), including FMRP, can stabilize the mRNAs bound to the RBP (49,70), and TOP3B possesses an mRNA-binding activity that strongly depends on its RNA-binding domain (RGG-box) (3,15). We propose that TOP3B–TDRD3 complex may protect bound mRNAs from nuclease attacks, or otherwise assemble the mRNAs into a higher order complex that is more stable (Figure 10A, right). In another mechanism, TOP3B–TDRD3 may bind mRNAs through the RNA-binding domain of TOP3B, and recruit translation factors, including FMRP and EJC, through the Tudor and CTD domains of TDRD3 (2,3). FMRP and EJC can then regulate translation and/or stability of the bound mRNAs (Figure 10A, right).
Interestingly, we found that the most obvious effect of TOP3B inactivation on its bound mRNAs is to increase their turnover, whereas its effect on their translation is more complex, which could be either positive or negative (Figure 5D,E and Figure 6A, B). One possible explanation is that when TOP3B binds an mRNA, it may not necessarily catalyze topological reactions on this mRNA to alter its translation. It is known that for TOP1 and TOP2, their DNA targets identified by ChIP-seq are often different from those identified by capturing the intermediates (DNA-topoisomerase cleavage complex) of topoisomerase reactions (71). The targets identified by the latter methods are more likely to represent the genes that are catalytically regulated by the topoisomerases. A TOP3B mutant (R338W) that can induce TOP3B-DNA or -RNA cleavage complexes was reported recently (16). However, our effort of using this mutant to identify TOP3B-cleaved mRNAs was not successful. Future work is needed to develop a TOP3B inhibitor to trap TOP3B-mRNA cleavage complex to identify TOP3B-catalytically regulated mRNAs.
DATA AVAILABILITY
All next-generation sequencing data were deposited at GEO, and the accession number is GSE188574.
SUPPLEMENTARY DATA
Supplementary Data are available at NAR Online.
ACKNOWLEDGEMENTS
We’d like to thank Dr David Schlessinger for reading the manuscript and giving helpful advice. We are grateful to the anonymous reviewers for their valuable suggestions on how to improve the manuscript. This work utilized the computational resources of the NIH HPC Biowulf Cluster and NIA computer servers.
FUNDING
Intramural Research Program of the National Institute on Aging, National Institutes of Health [Z01 AG000657-08, in part]; Intramural Research Program of the National Institute of Diabetes and Digestive and Kidney Disease, National Institutes of Health [ZO1 DK015602-09]. Funding for open access charge: NIH [Z01 AG000657-08].
Conflict of interest statement. None declared.

Comments