


Abstract
Kaposi's sarcoma-associated herpesvirus (KSHV) expresses miRNAs during latency. However, regulation of viral miRNAs remains largely unknown. Our prior studies demonstrated that MCPIP1 regulates KSHV miRNA biogenesis by degrading most KSHV pre-miRNAs through its RNase activity. Some viral pre-miRNAs are partially resistant to degradation by MCPIP1. Here, we further characterized MCPIP1 substrate specificity and its antiviral potential against KSHV infection. In vitro cleavage assays and binding assays showed that MCPIP1 cleavage efficiency is related to binding affinity. Motif-based sequence analysis identified that KSHV pre-miRNAs that are well degraded by MCPIP1 have a 5-base motif (M5 base motif) within their terminal loops and this motif region consists of multiple pyrimidine-purine-pyrimidine (YRY) motifs. We further demonstrated that mutation of this M5 base motif within terminal loop of pre-miRNAs inhibited MCPIP1-mediated RNA degradation. We also revealed that MCPIP1 has an antiviral effect against KSHV infection. MCPIP1 can reduce the expression of Dicer, which in turn restricts KSHV infection. Conclusively, our findings demonstrated that MCPIP1 inhibited KSHV infection and suppressed viral miRNA biogenesis by directly degrading KSHV pre-miRNAs and altering the expression of miRNA biogenesis factors.
INTRODUCTION
MicroRNAs (miRNAs) are ∼22 nucleotide long non-coding RNAs that regulate gene expression at the post-transcriptional level by inhibiting translation or destabilizing mRNA transcript (1,2). miRNAs are initially transcribed to produce primary miRNAs (pri-miRNA), which are then processed into hairpin structured precursor miRNAs (pre-miRNA) by the Microprocessor complex comprising of RNase type III enzyme, Drosha and DGCR8. Another RNase type III enzyme, Dicer, in cooperation with TAR RNA-binding protein (TARBP) cleaves the pre-miRNAs to generate mature miRNAs, which are then incorporated into the RNA-induced silencing complex (RISC) (1,2). Subsequently, RISC binds to complementary region of target mRNA resulting in repressing gene expression (1,2). Kaposi's sarcoma-associated herpesvirus (KSHV), also known as human herpesvirus-8 (HHV-8), is etiologically associated with several malignancies including Kaposi's sarcoma (KS) and primary effusion lymphoma (PEL), as well as multicentric Castleman's disease (MCD), a lymphoproliferative disorder. These all develop primarily in immunosuppressed individuals. In common with Herpesviridae family, the KSHV lifecycle has two distinct phases of lifecycles, latent and lytic infection. During latent infection, KSHV expresses a limited number of viral genes such as latency-associated nuclear antigen (LANA), vCyclin; ORF72, vFLIP, kaposin (K12) and a cluster of viral microRNAs, all of which are located within KSHV latency associated region (KLAR) (3).
Within this latency region, KSHV encodes 12 pre-miRNAs, which are processed into 25 mature miRNAs (4). Host factors targeted by KSHV miRNAs are associated with apoptosis, immune response, and angiogenesis (5,6), thus levels of miRNA expression are highly linked to function and biological significance of these miRNAs. The levels of KSHV miRNAs expression vary depending on cell types and viral life cycles (7,8). However, it is poorly understood how expression of KSHV miRNAs are regulated during KSHV infection.
Monocyte Chemoattractant Protein-1 Induced Protein 1(MCPIP1, encoded by ZC3H12A), also known as Regnase1 is a member of CCCH-type zinc finger family, whose expression is induced by proinflammatory cytokines such as TNF-α, MCP-1 and IL-1β (9–11). MCPIP1 plays crucial roles in regulating immune response by destabilizing transcripts of cytokines such as IL-1β, IL-2, IL-6 and IL-12β, using its intrinsic endoribonucleolytic activity (9,12,13). Virus-induced inflammatory cytokines play crucial roles in pathogenesis of virus-associated diseases. MCPIP1 can inhibit the levels of inflammatory cytokines that are induced by hepatitis B virus (HBV), hepatitis C virus (HCV), and coxsackievirus B3 (CVB3) (14–16).
In addition to regulating expression of cytokines, antiviral functions of MCPIP1 against certain viruses have been identified(14–19). MCPIP1 restricts replication of human immunodeficiency viruses (HIV), Japanese encephalitis virus (JEV), dengue virus (DEN), hepatitis B virus (HBV), hepatitis C virus (HCV) and coxsackievirus B3 (CVB3) via its RNase activity for targeting viral RNA(14–19). However, it remains unknown whether MCPIP1 is antiviral against KSHV infection.
MCPIP1 has also been identified as a new negative regulator of human miRNA biogenesis by degrading certain human pre-miRNAs through its RNase activity and also inhibiting Dicer activity as a result of competition with Dicer for binding to pre-miRNAs (20). Our prior studies demonstrated that MCPIP1 negatively regulates KSHV miRNA biogenesis by directly degrading KSHV-encoded pre-miRNAs (11). We also found that MCPIP1 preferentially degrades these viral pre-miRNAs.
In this study, we aimed to elucidate the mechanisms underlying MCPIP1 substrate specificity toward viral and human pre-miRNAs. Our studies revealed that MCPIP1 cleavage efficiency is positively correlated with binding affinity. Furthermore, sequence analysis revealed that a 5-base motif (M5 base motif) presents within terminal loop of pre-miRNAs positively contribute to MCPIP1 cleavage efficiency. Exogenous MCPIP1 expression downregulated the levels of Dicer expression. Dicer1 depletion negatively regulates KSHV infection. We also assessed whether MCPIP1 has an antiviral activity against KSHV infection. We demonstrated that expression of Dicer is beneficial for KSHV infection and that MCPIP1 inhibits KSHV infection at least in part by suppressing the expression of Dicer. Our novel findings expand the knowledge of MCPIP1 substrate specificity in human, KSHV, and Epstein-Barr virus (EBV) miRNAs, which contributes to regulation of miRNA biogenesis during viral infection. Antiviral function of MCPIP1 on KSHV infection suggests a potential novel therapeutic strategy to inhibit infection.
MATERIALS AND METHODS
Cell culture and reagents
Human umbilical vein endothelial cells (HUVECs; Lonza) were maintained in EGM-2 BulletKit (Lonza) for up to five passages. Doxycycline (DOX)-inducible GFP-MCPIP1 293T cells were cultured in Dulbecco's modified Eagle's medium (DMEM) with 10% tetracycline-free fetal bovine serum (FBS) and a penicillin and streptomycin and glutamine solution (Life Technologies) and maintained with 1 μg/ml puromycin and 200 μg/ml G418 as described previously (18). These cells were induced with DOX (10 ng/ml) to express GFP-MCPIP. iSLK cells were obtained from the Renne lab (21). iSLK cells are cultured in DMEM medium with 10% FBS, 1 μg/ml puromycin, and 250 μg/ml G418, and 1200 μg/ml hygromycin. KSHV infected B cell line isolated from primary effusion lymphoma (BCBL-1) was maintained in RPMI supplemented with 10% FBS and 55 μM β-mercaptoethanol. All cultures were grown at 37°C with 5% CO2. The cytokine, IL-1β was purchased from Peprotech and used for a final concentration of 5 ng/ml.
LNA gapmer or siRNA transfection
ON-TARGETplus SMARTpool Small interfering RNA (siRNA) targeting Dicer1 and locked nucleic acid (LNA) gapmers targeting MCPIP1 were purchased from Dharmacon and Qiagen, respectively. For the transfection of siRNAs and LNA gapmers, HUVECs were seeded at 0.5 × 10⁴/well in 12-well plates overnight. Transfections were performed with 5 nM siRNA or 5 nM LNA gapmer using 0.5 μl/well DharmaFECT1 (Dharmacon) according to the manufacturer's instructions.
In vitro cleavage assays
Pre-miRNA or RNA were synthesized with 5′IRD800CWN labels. Recombinant MCPIP1 protein was prepared as described previously (11). Fluorescently labelled pre-miRNAs or RNA (4nM) were incubated with recombinant MCPIP1 protein or MCPIP D141N (365nM) in 15 μl reactions containing 5 mM MgCl2, 0.5 mM ATP, 20 mM Tris pH 7.5, 100 mM KCl, 10% glycerol, 5 mM DTT, 5 ng total RNA extracted from 293T cells (non-specific competitor). Reactions were incubated at 37°C for 2 h and then loaded onto a 15% denaturing urea gel. A DNA ladder was visualized by staining with SYTO 60 (Life Technologies) for size markers. Gels were scanned using an Odyssey scanner (Li-Cor) and quantified using Li-Cor Image Studio software. Percent of uncleaved pre-miRNAs or RNA was calculated as the total signal per lane minus the amount of degraded RNA and multiplied by 100. The sequence of synthesized pre-miRNAs is listed in Supplementary Table S1.
RNA electrophoretic mobility shift assay
Different concentrations of MCPIP1 D141N were incubated with fluorescently labeled pre-miRNA (12nM) in 10 mM HEPES, 20 mM KCl, 1 mM MgCl2, 1 mM DTT, 10% glycerol, 0.05% NP40 at room temperature for 60 min. Then, samples were run on a 0.8% agarose gel. Gel was visualized by Odyssey scanner (LI-COR) and quantified by LI-COR image Studio software. MCPIP1 D141N bound pre-miRNA was calculated as the intensity of the shifted species divided by the intensity of the free RNA and the shifted species. The equilibrium dissociation constant (Kd) was determined by non-linear fitting using a one site-specific binding model to the following equation: fraction bound = Bmax (maximum fraction bound) |$ \times$| MCPIP1 concentration/(Kd + MCPIP1 concentration). The sequence of synthesized pre-miRNAs is listed in Supplementary Table S1.
RT-qPCR
Total RNA was extracted using the RNeasy kit (Qiagen) or Direct-zol (Zymo Research). cDNA was synthesized using 200 ng RNA, random primers, and high-capacity cDNA reverse transcription kit (Applied Biosystems). Total DNA from infected and mock-infected cells was isolated using a Qiagen DNeasy tissue kit. Quantitative PCR was performed with FastStart universal SYBR green master mix (Roche), Taqman Universal PCR master mix (Applied Biosystems), or THUNDERBIRD qPCR mix (Toyobo) on an ABI StepOnePlus real-time PCR system (Applied Biosystems). Relative gene expression was computed using the threshold cycle (ΔΔCT) method with genes coding for β-actin, GAPDH and BRCA1 as the reference genes. Viral genome copies were analysed as previously described (22). The sequence of primer and probe used for RT-qPCR is listed in Supplementary Table S2.
Western blot assay
Total protein was extracted in radioimmunoprecipitation assay (RIPA) buffer containing protease inhibitors. Protein concentration was determined using Quick Start Bradford Dye Reagent (Bio-Rad). For western blotting, equal amounts of total proteins were loaded onto a NuPAGE 4–12% Bis–Tris Gel (Invitrogen) followed by transfer onto a nitrocellulose membrane (Invitrogen) by iBlot (Invitrogen). Primary antibodies include: mouse anti-Dicer (Abcam), mouse anti-LANA (Leica Biosystems), rabbit anti-MCPIP1 (Genetex), rabbit anti-Lamin B (Cell Signaling Technology), mouse anti-HSP90 (Abcam), rabbit anti-ACT (Sigma-Aldrich). Seconday antibodies conjugated to the infrared fluorescing dyes IRDye 800CW and IRDye 680 were obtained from Li-Cor. Membranes were scanned using Li-Cor Odyssey infrared scanner and quantified using Li-Cor Image Studio software. Changes in protein levels were first normalized to the internal loading standard (HSP90 for cytoplasmic LANA, Lamin B for nuclear LANA, and β-actin for MCPIP1 and Dicer), then fold change was obtained relative to values for the respective negative controls.
KSHV production and de novo KSHV infection
To prepare BCBL-1 virus from BCBL-1 cells, cells were treated with 300 μM of valproic acid for 6 days. To prepare BAC16 virus from iSLK cells, iSLK cells were maintained in DMEM containing 1 μg/ml DOX and 1 mM valproate to induce lytic cycle for 3 days. Collected supernatant was centrifuged at 2000 rpm for 10 min and then filtered through 45 μm filter flask. Filtered supernatant was concentrated with Vivaflow 50 (Satorius) or ultracentrifugation at 28 000 × g for 2 h. The virus containing pellet was re-suspended in serum free EGM-2 or DMEM. For KSHV de novo infection, HUVECs and DOX-inducible GFP-MCPIP1 HEK293T cells grown to 50–70% confluence were infected with KSHV diluted in EGM-2 medium containing 8ug/ml polybrene. The viruses used to infect HUVECs gave ∼60–70% of primary infection efficiency as monitored by staining of LANA for BCBL-1 virus infection or GFP expression for BAC16 virus infection. For de novo infection with BCBL-1 virus, cells were washed with PBS and replaced with fresh medium at 6 h post infection. For de novo infection with BAC16 virus, cells were washed with PBS and replaced with fresh medium at 24 h post infection. Cells were refed every 2 days until harvest. KSHV used in Figures 5 and 6 was derived from BCBL-1 cells. BAC16 virus isolated from iSLK was used in Figure 9.
Statistical analysis
At least three biological replicates were used for each analysis and experiment conditions were compared to the appropriate negative control. Averages and standard deviations were plotted using Prism (Graphpad Software). For analysing statistically significant differences, t tests were used with as indicated in the legends. Values of *P < 0.05 were regarded as statistically significant. Prism (Graphpad Software) was used to calculate Pearson's correlation coefficient. A P-value of < 0.05 was considered significant.
Scientific Illustration
BioRender.com was used to create a diagram.
RESULTS
MCPIP1 binding affinity correlates with cleavage efficiency
Our prior studies have demonstrated that MCPIP1 regulates KSHV miRNA biogenesis by directly degrading viral pre-miRNAs (11). Interestingly, we also found that MCPIP1 did not degrade all KSHV pre-miRNAs with the same efficiency (11). Extending on this work, we evaluated the substrate specificity of MCPIP1. For this study, we examined whether the differences in cleavage efficiency of pre-miRNAs correlate with pre-miRNAs binding affinity. To compare cleavage efficiency of pre-miRNAs, in vitro cleavage assay was performed using fluorescently labelled KSHV and human pre-miRNAs, as well as recombinant MCPIP1 protein. Recombinant MCPIP1 WT and MCPIP1 D141N proteins used in our studies were prepared as described (11). An RNase-dead mutant, MCPIP1 D141N in which aspartic acid was replaced with asparagine at position 141 impaired RNase activity, but still retained RNA binding ability (Figures 1B, 3B, 4B and 8) (11,12). As predicted, MCPIP1 cleaved pre-miRNAs with different efficiencies (Figure 1A). The miRNAs kshv-mir-K12–3 and hsa-let-7c were relatively efficiently targeted by MCPIP1 substrates compared to the other KSHV and human pre-miRNAs (Figure 1A). kshv-mir-K12-6 was the least degraded by MCPIP1 (Figure 1A), which is consistent with previous observations that kshv-miR-K12-6-3p was highly abundant in KSHV-infected patient-derived cell lines (23). We next performed electrophoretic mobility shift assay (EMSA) to determine whether MCPIP1 preferentially binds pre-miRNAs. MCPIP1 D141N was utilized in these binding studies to impede the degradation of pre-miRNAs. As expected, shifted pre-miRNA bands were not observed in the absence of the MCPIP1 D141N (Figure 1B). MCPIP1 D141N showed the improved binding affinity in a concentration dependent fashion (Figure 1B and C). We found that MCPIP1 D141N had a lower binding affinity for kshv-mir-K12–6 whereas kshv-mir-K12–3 and hsa-let-7c more efficiently bound to MCPIP1 (Figure 1B and C). In addition to the predominant MCPIP1 D141N-bound band, we also found some labelled pre-miRNA that was retained in the gel wells (Figure 1B). This is likely resulting from interactions between MCPIP1 and pre-miRNAs because this signal was enhanced in a concentration dependent fashion while fluorescent signal was not detected in the absence of MCPIP1 D141N (Figure 1B). Previous studies have also shown that the MCPIP1-RNA complex was retained in the well of gel due to oligomer formation of MCPIP1 (24,25). Subsequently, equilibrium dissociation constant, Kd was plotted against percent uncleaved pre-miRNA remaining to assess the Pearson correlations between cleavage efficiency and binding affinity (Figure 1D). Our results demonstrated that percent full-length remaining pre-miRNA showed strong positive correlation with Kd (Figure 1D). Taken together, differences in cleavage efficiency of pre-miRNAs are related to MCPIP1 binding affinity.
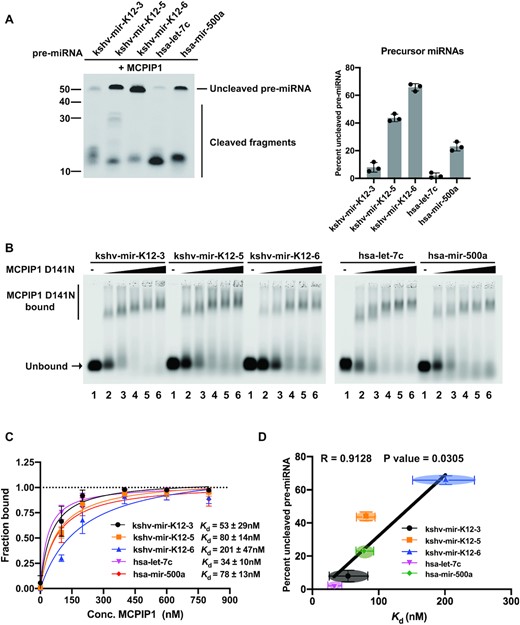
Determining the correlation of MCPIP1 cleavage efficiency and binding affinity. (A) Cleavage efficiency was evaluated by in vitro cleavage assay. Fluorescently labelled pre-miRNAs were incubated with recombinant MCPIP1, before separation on a denaturing urea gel. The percent of full-length pre-miRNAs remaining was quantified in the accompanying graph. Size markers (left) as well as full length and cleaved RNA products (right) are indicated. (B and C) Binding affinity was determined by electrophoretic mobility shift assay (EMSA). (B) Fluorescently labelled pre-miRNAs at 12 nM were incubated with recombinant MCPIP1 D141N (RNase dead mutant) at 0, 100, 200, 400, 600 and 800 nM (lanes 1- 6, respectively), before separation on a 0.8% agarose gel. The unbound RNA and MCPIP1 D141N bound RNA complexes are marked on the left. (C) The fraction of bound RNA was plotted against MCPIP1 concentration to calculate the equilibrium dissociation constant, Kd. (D) The relation between Kd and the percent of full-length pre-miRNAs were plotted. Correlation was analysed using Pearson's correlation coefficient (r) and linear regression line is overlaid. A P-value of <0.05 was considered significant. Each point represents results obtained from each pre-miRNA. All results are represented as means ± SD of data from independent experiments, N = 3.
An M5 base motif present in the terminal loop of KSHV pre-miRNAs that were more degraded by MCPIP1
As reported previously, MCPIP1 preferentially cleaves terminal loops of some human pre-miRNAs (20), but the sequence specificity of MCPIP1 is still unclear. Therefore, to determine essential motifs of KSHV pre-miRNAs for MCPIP1 mediated degradation and binding affinity, we analysed the terminal loop regions of 11 KSHV pre-miRNAs excluding kshv-mir-K12–12 using MEME (26), a discriminative motif discovery algorithm in which sequences of MCPIP1-resistant and MCPIP1-degraded pre-miRNA sequences were used as inputs for the analysis (Figure 2). The positive set represents KSHV pre-miRNAs that were well degraded by MCPIP1 and MCPIP1-resistant KSHV pre-miRNAs were used as a negative set (Figure 2A). These two classes were defined by having greater or <40% uncleaved pre-miRNAs remaining after incubation with MCPIP1 (Figure 2A). We identified a 5 base motif (M5 base motif) present in the terminal loop of positive set except kshv-mir-K12-2, but not in that of negative set (Figure 2B). High-throughput sequencing of RNA isolated by crosslinking immunoprecipitation (HITS-CLIP) revealed that pyrimidine-purine-pyrimidine (YRY) sequence was enriched in the stem loops of mRNAs bound by MCPIP1 and this YRY motif is crucial for MCPIP1 mediated mRNA suppression (27). RNA immunoprecipitation sequencing (RIPS) also showed that top 10 human pre-miRNAs with high reads associated MCPIP1 binding contain multiple YRY motifs within or near stem loop (20). We observed that last three bases of an M5 base motif are composed of conserved YRY motif and guanine(G) not adenine(A) occupied the purine (R) of an M5 base motif (Figure 2B). Furthermore, we also found that multiple YRY motifs were enriched in the region of the M5 base motif in MCPIP1-sensitive pre-miRNAs (Figure 2B and Supplementary Figure S1).
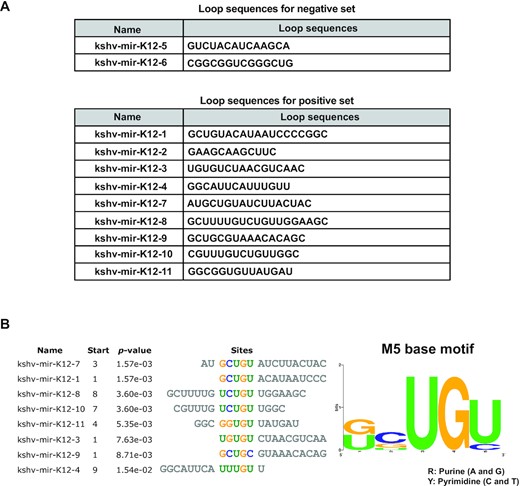
Analysis of terminal loop sequences of KSHV pre-miRNAs. (A) Loop sequences of KSHV pre-miRNAs for the negative set (less degraded by MCPIP1) and the positive set (more degraded by MCPIP1) that used in MEME program for motif discovery. (B) M5 base motif was found by the MEME program within the terminal loops of KSHV pre-miRNAs that were well degraded by MCPIP1.
An M5 base motif within the terminal loop of pre-miRNAs is one of determinants for MCPIP1 specificity
To investigate the contribution of an M5 base motif toward cleavage efficiency and binding activity, we made mutations within an M5 base motif present in the terminal loop of kshv-mir-K12–3 and hsa-let-7c without significant changes in the stem loop structure (Figure 3A). Human let-7c (hsa-let-7c) has a modified 5 base motif in which purine site is composed of A not G, and pyrimidine(Y) at the third base of a 5 motif is cytosine (C) instead of uracil (U). In vitro cleavage assay showed that kshv-mir-K12–3 WT and hsa-let-7c WT were more efficiently degraded by MCPIP1 compared to their respective M5 base motif mutant pre-miRNAs (Figure 3A). MCPIP1 D141N binding affinity for kshv-mir-K12–3 WT was also stronger than the two different pre-miRNA mutants with disrupted M5 base motifs (Figure 3B). Relatively better MCPIP1 D141N binding affinity to kshv-mir-K12-3 mut1 was observed compared to kshv-mir-K12–3 mut2, possibly due to slight change in the predicted stem loop size (Figure 3B). In contrast, we did not find major differences in MCPIP1 D141N binding affinity between hsa-let-7c WT and its M5 base motif mutant, suggesting that M5 base motif may enhance MCPIP1 binding to a pre-miRNA in a form that is better suited for degradation by MCPIP1 (Figure 3B). The correlation between Kd and percent full-length remaining was measured. Similar to the results shown in Figure 1, a positive correlation between Kd and percent uncleaved pre-miRNA was found (Figure 3C).
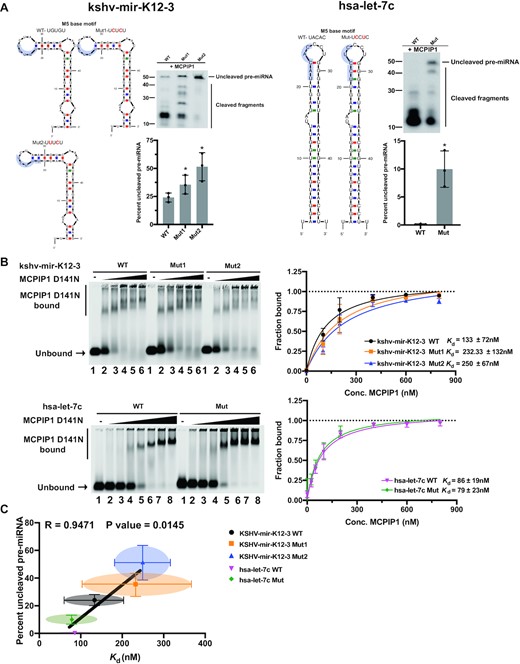
Comparison of binding properties and cleavage efficiency of wild type and M5 base motif mutant pre-miRNAs with MCPIP1. (A) Predicted secondary structure of kshv-mir-K12–3 WT and its M5 base motif mutants (left) and hsa-let-7c WT and its M5 base motif mutant (right) based on mfold structure predictions. M5 base motif is highlighted. Cleavage efficiency was evaluated by in vitro cleavage assay. Fluorescently labelled pre-miRNAs were incubated with recombinant MCPIP1, before separation on a denaturing urea gel. The percent of full-length pre-miRNAs remaining was quantified in the accompanying graph. Size markers as well as full length and cleaved RNA products are indicated. WT, wild type and mut, mutant. (B) Binding affinity was determined by EMSA. Fluorescently labelled kshv-mir-K12–3 WT and its M5 base motif mutants (up) or fluorescently labelled hsa-let-7c WT and its M5 base motif mutant (low) were incubated with recombinant MCPIP1 D141N at 0, 100, 200, 400, 600 and 800nM (lanes 1–6) or at 0, 25, 50, 100, 200, 400, 600 and 800nM (lanes 1–8) respectively, before separation on a 0.8% agarose gel. The unbound RNA and MCPIP1 D141N bound RNA complexes are marked on the left. The fraction of bound RNA was plotted against MCPIP1 concentration in nM to calculate the equilibrium dissociation constant, Kd. (C) The relation between Kd and the percent of full-length pre-miRNAs were plotted. Correlation was analysed using Pearson's correlation coefficient (r) and linear regression line is overlaid. A P-value of < 0.05 was considered significant. Each point represents results obtained from each pre-miRNA. All results are represented as means ± SD of data from independent experiments, N = 3–4.
Interestingly, the M5 base motif mutant pre-miRNAs were still degraded by MCPIP1, albeit to a lesser extent than wild type indicating that mutations within the M5 base motif of pre-miRNAs was not sufficient to completely impair MCPIP1 mediated degradation (Figure 3A). Mutations of the M5 base motif in pre-miRNAs were also unable to fully abolish MCPIP1 D141N binding (Figure 3B). These observations suggest possible contributions of additional sequence or structural factors to help determine overall MCPIP1 degradation specificity (Figure 3B). MCPIP1-sensitive pre-miRNAs have an M5 base motif within the terminal loop, but different binding affinities and cleavage efficiencies have been found between these pre-miRNAs, supporting roles of additional determinants in MCPIP1 specificity (Figures 1 and 2).
In addition, the M5 base motif was introduced into the terminal loop of the MCPIP1-resistant pre-miRNA, kshv-mir-K12–6 (Figure 4A) and we evaluated whether introduction of the M5 base motif increases cleavage efficiency (Figure 4B). In the absence of MCPIP1 protein, cleaved pre-miRNAs were not detected (Figure 4B) (11). As expected, MCPIP1 D141N did not degrade pre-miRNAs (Figure 4B). M5 base motif introduced kshv-mir-K12–6 mutant was better cleaved by MCPIP1 compared to its wild type, strengthen the importance of the M5 base motif for MCPIP1 cleavage efficiency (Figure 4B). Together, the M5 base motif within terminal loop of pre-miRNAs promotes MCPIP1 cleavage efficiency.
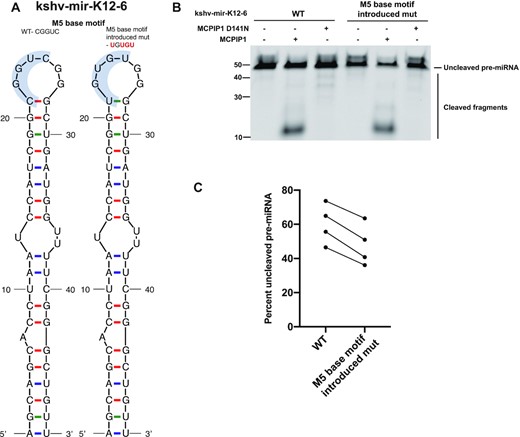
Comparison of cleavage efficiency of wild type and M5 base motif introduced mutant kshv-mir-K12–6 with MCPIP1. (A) Predicted secondary structure of kshv-mir-K12–6 WT and its M5 base motif introduced mutant based on mfold structure predictions. (B) Cleavage efficiency was evaluated by in vitro cleavage assay. Fluorescently labelled kshv-mir-K12–6 and its mutant were incubated with recombinant WT MCPIP1 or MCPIP1 D141N, before electrophoresis on a denaturing urea gel. Size markers as well as full length and cleaved RNA products are indicated. (C) Each replicate of full-length pre-miRNAs remaining following MCPIP1 treatment was quantified in the graph, corresponding to lanes 2 and 5 in panel (B).
MCPIP1 restricts de novo KSHV infection
We investigated whether MCPIP1 plays a role in the regulation of KSHV infection. To explore the impact of MCPIP1 overexpression on KSHV infection, we utilized 293T-GFP-MCPIP1 cells, in which MCPIP1 expression can be induced by adding doxycycline (DOX) into the culture medium, as previously described (18). MCPIP1 was induced before, after infection, or both before and after KSHV infection to determine when MCPIP1 expression might affect infection (Figure 5A). Dox treatment for 24 and 48 h efficiently induced the levels of MCPIP1 transcript in 293T-GFP-MCPIP1 cells while there was no effect on MCPIP1 expression in 293T-GFP cells (Figure 5B). At 96 h post infection, elevated levels of MCPIP1 transcripts and exogenous GFP-MCPIP1 protein were detected following dox treatment before and after KSHV infection in 293T-GFP-MCPIP1 cells (Figure 5C and D). KSHV infection reduced the levels of endogenous MCPIP1 protein in HUVECs (11). However, we were unable to observe endogenous MCPIP1 protein in 293T-GFP-MCPIP1 cells (Figure 5D). MCPIP1 expression after infection led to a potent reduction of viral genome accumulation as well as viral transcript levels of latent gene, ORF73(LANA), and lytic genes including ORF50(RTA, immediate early), ORF6(delayed early), ORF60(delayed early), ORF34(delayed early) and K8.1(late gene) (Figure 5E and F) (28). In support of observations in Figure 5E and F, there was a dramatic reduction in the levels of LANA protein in both nuclear and cytoplasmic lysates (Figure 5G). Conversely, MCPIP1 expression before infection was unable to effectively repress either viral genome accumulation or levels of viral transcripts, suggesting that MCPIP1 does not contribute the early stage of KSVH infection (Figure 5E and F). Unexpectedly, we found a slight increase in genome copies when MCPIP1 was expression before KSHV infection (Figure 5E). Perhaps induced MCPIP1 expression before infection inhibits establishment of latency and spurious lytic replication occurs for a short time. Some results that support this hypothesis as shown in Figure 5F, where we found increased lytic gene expression (ORF6 and others) in some replicates when MCPIP1 expression was induced only before infection. In addition, MCPIP1 expression before infection may inhibit the expression of some antiviral cytokines, which possibly provides a temporary benefit for the virus. Inducing MCPIP1 expression before and after infection does not cause a greater reduction in viral genome copies and gene expression levels, supporting that MCPIP1 expression before infection is not as important as after infection (Figure 5E and F). DOX treatment had no major effect on viral genome copies and gene expression in control cells that do not induce MCPIP1 expression (293T-GFP) irrespective of time points of DOX treatment ruling out the possibility of a DOX effect on viral infection (Figure 5E and F). Together, ectopic expression of MCPIP1 inhibits KSHV infection at later times of de novo KSHV infection.
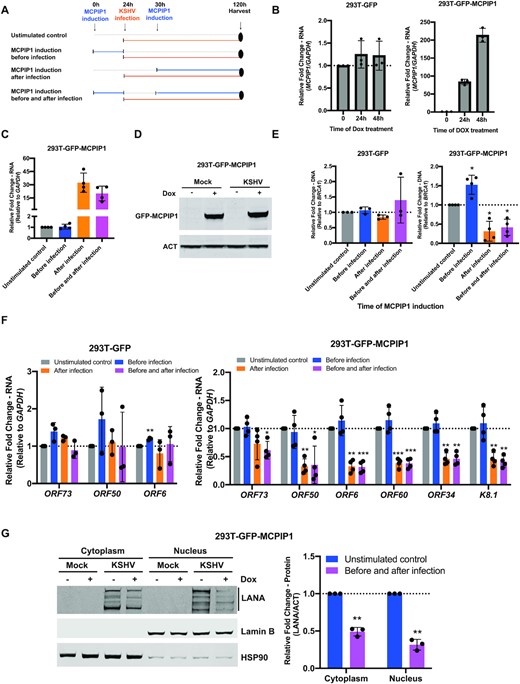
MCPIP1 overexpression inhibits de novo KSHV infection. (A) Schematic of KSHV infection timeline following MCPIP1 overexpression. 293T-GFP and 293T-GFP-MCPIP1 cells were stimulated with 10 ng/ml doxycycline (DOX) or DMSO (unstimulated control) for 24 h prior to KSHV infection (before infection), 6h post infection (after infection), or both prior to and following infection (before and after infection). At 96h post KSHV infection, MCPIP1 expression (C and D), viral genome copies (E), and viral gene expression (F and G) were analysed. (B) 293T-GFP and 293T-GFP-MCPIP1 cells were exposed to 10 ng/ml DOX for 0, 24h, and 48h. The levels of MCPIP1 transcripts were analysed by qPCR. Results are shown relative to GAPDH and normalized to DMSO treated control. (C) Levels of MCPIP1 transcripts was analysed by qPCR. Results are shown relative to GAPDH and normalized to unstimulated control. (D and G) MCPIP1 was induced before and after infection followed by KSHV infection in 293T-GFP-MCPIP1 cells. (D) Levels of MCPIP1 protein were analysed. β-actin (ACT) was used as a loading control. (E) Viral genome copies were measured by qPCR using primers specific to the KSHV ORF73(LANA) gene. Results are shown relative to BRCA1 and normalized to unstimulated control (F) Levels of ORF73(LANA), ORF50(RTA), ORF6, ORF60, ORF34 and K8.1 transcripts were analysed by qPCR. Results are shown relative to GAPDH and normalized to unstimulated control (G) Level of LANA protein was measured by immunoblot in nuclear and cytoplasm extracts from cells. Nuclear and cytoplasmic fractions were determined by Lamin B (nuclear marker) and HSP90 (cytoplasmic marker). All results are represented standard error of the mean from independent experiments, N = 3–4 and statistical analysis was done with a Student's t test. *P < 0.05, **P < 0.01, ***P < 0.001.
To determine if this impact of MCPIP1 could be shown under physiological levels of expression, we silenced MCPIP1 expression using locked nucleic acid (LNA) gapmers, which knockdown mRNA in an RNase H-dependent manner in human umbilical vein endothelial cells (HUVECs) followed by KSHV infection. MCPIP1 expression is maintained at low levels in most cell types. Some of the proinflammatory cytokines that are upregulated following KSHV infection can induce MCPIP1 expression (9,10,29). We previously observed the elevated levels of MCPIP1 expression in response to IL-1β, TNFα, and TWEAK in HUVECs (11). To increase the expression range of MCPIP1 in KSHV infections, we also induced MCPIP1 expression using IL-1β following MCPIP1 knockdown to maximize differences in MCPIP1 expression levels between the negative control and MCPIP1 knockdown conditions. At 24 h post-transfection with the LNA gapmers, HUVECs were pre-treated with IL-1β for 2 h followed by KSHV infection (Figure 6A). At 26 h post transfection, the levels of MCPIP1 transcripts were measured to verify the efficiency of the knockdown and IL-1β mediated induction (Figure 6B). As expected, elevated levels of MCPIP1 transcript were exhibited following IL-1β treatment (Figure 6B). All MCPIP1 gapmers greatly reduced both endogenous and IL-1β induced MCPIP1 expression (Figure 6B). At 98 post transfection, IL-1β still efficiently induced MCPIP1 expression, and knocked down MCPIP1 went back to almost similar levels of MCPIP1 transcripts as negative gapmer transfected control (Figure 6C). Regardless of IL-1β induction, MCPIP1 knockdown resulted in increased accumulation of viral genome levels, further confirming that MCPIP1 inhibits KSHV infection (Figure 6D). In summary, the data shown in Figures 5 and 6 revealed that MCPIP1 negatively regulates KSHV infection.
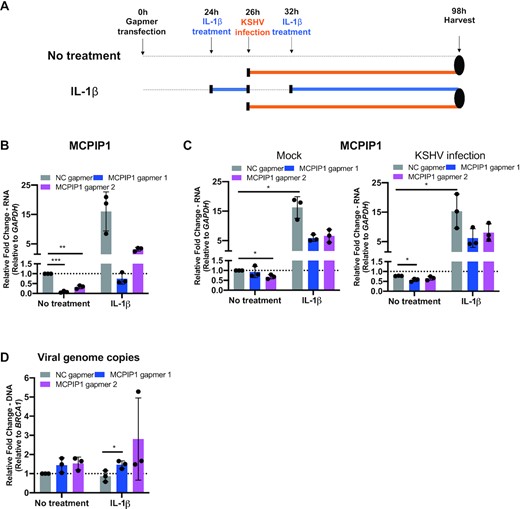
MCPIP1 knockdown enhances viral genome accumulation. (A) Schematic of timeline of KSHV infection in HUVEC following MCPIP1 knockdown. HUVECs were stimulated with IL-1β for 2 h following transfection with negative control Locked Nucleic Acid (LNA) gapmer or LNA gapmers targeting MCPIP1 for repression, subsequently the cells were infected by KSHV. At 6 h post infection, IL-1β was treated until samples were collected. At 72 h post infection, cells were harvested. (B) At 26 h post-transfection, efficiency of MCPIP1 knockdown in HUVECs was determined by qPCR. Results are shown relative to GAPDH and normalized to negative gapmer control (C) At 98 h post transfection, MCPIP1 expression was analysed by qPCR. Results are shown relative to GAPDH and normalized to negative gapmer control (D) Viral genome copies were measured by qPCR using primers specific to the ORF73(LANA). Results are shown relative to BRCA1 and normalized to negative gapmer control. All results are represented standard error of the mean from independent experiments, N = 3 and statistical analysis was done with a Student's t test. *P < 0.05, **P < 0.01, ***P < 0.001.
MCPIP1 reduced Dicer1 expression
Our previous studies reported that MCPIP1 expression was downregulated and Dicer1 expression was upregulated following de novo KSHV infection in HUVECs (6). A previous cross-linking and immunoprecipitation (CLIP) report found binding hits of MCPIP1 in the 3′UTR of the Dicer1 transcripts (27), suggesting that MCPIP1 might directly target Dicer1 mRNA for degradation. This combined information led us to ask whether elevated levels of Dicer1 expression were resulting from lower levels of MCPIP1 expression. To determine if MCPIP1 regulates Dicer expression, we examined Dicer expression following ectopic MCPIP1 expression. 293T-GFP-MCPIP1 or 293T-GFP cells were exposed to DOX for 0, 24 and 48 h, followed by measuring the levels of MCPIP1 and Dicer1 transcripts. In 293T-GFP-MCPIP1 cells, DOX treatment enhanced the levels of MCPIP1 transcripts in a time dependent manner (Figure 5B). The levels of Dicer1 transcript were suppressed following DOX treatment in the same cells (Figure 7A). Expression of MCPIP1 and Dicer1 shows negligible changes in 293T-GFP following DOX treatment, indicating no DOX effect on MCPIP1 and Dicer1 expression (Figure 5B and 7A). At 48 h post-DOX treatment, elevated levels of exogenous GFP-MCPIP1 protein were detected (Figure 7B). In 293T-GFP-MCPIP1 cells, DOX treatment suppressed the levels of Dicer protein, which was not observed in 293T-GFP cells (Figure 7B). These results are consistent with our previous observations that MCPIP1-deleted mouse embryonic fibroblasts (MEFs) expressed higher levels of Dicer compared to wild type MEFs (11). Our current observations and prior findings suggest that MCPIP1 expression inhibits Dicer expression.
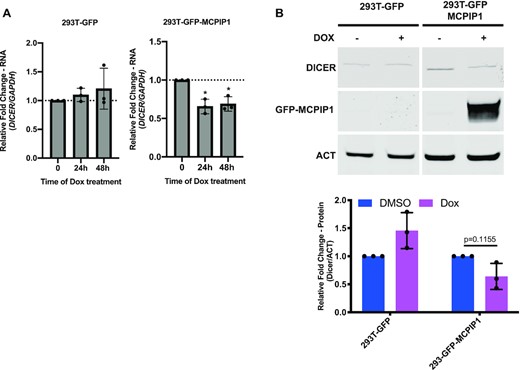
Examination of Dicer expression following MCPIP1 overexpression. 293T-GFP and 293T-GFP-MCPIP1 cells were exposed to 10 ng/ml DOX for 0, 24 and 48 h (A) or for 48 h (B). (A) The levels of Dicer1 transcripts were measured by qPCR. Results are shown relative to GAPDH and normalized to DMSO treated control. (B) Levels of Dicer and GFP-MCPIP1 protein were examined by immunoblot. Results are shown relative to actin and normalized to unstimulated control. All results are represented as means ± SD of data from independent experiments, N = 3 and statistical analysis was done with a Student's t test. *P < 0.05.
To better characterize the role of MCPIP1 in inhibition of Dicer expression, we performed in vitro cleavage assay using two of MCPIP1 target regions in 3′UTR of the Dicer1 transcripts and their mutant RNAs that have mutations within YRY motif of the loop structure. As expected, both MCPIP1 target regions of Dicer1 transcripts were greatly degraded by MCPIP1 (Figure 8). However, their respective mutants were also vastly degraded by MCPIP1 (Figure 8). We did not observe that the YRY motif inhibits MCPIP1-mediated degradation of Dicer1 transcripts (Figure 8). Perhaps the strong degradation of the 3′UTR of the Dicer1 transcripts might be the reason why we were not able to observe inhibition of degradation by these mutations in the YRY motif.
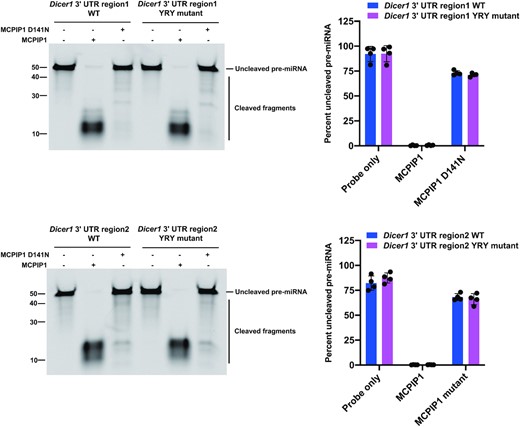
Cleavage efficiency of Dicer1 3′ UTR regions was evaluated by in vitro cleavage assays. Fluorescently labelled Dicer1 3′ UTR fragment RNAs were incubated with recombinant MCPIP1 or MCPIP1 D141N, before electrophoresis on a denaturing urea gel. The percent of full-length RNAs remaining for Dicer1 3′ UTR region1 and its YRY mutant (up) and Dicer1 3′ UTR region2 and its YRY mutant were quantified in the accompanying graph. Size markers(left) as well as full length and cleaved RNA products are indicated. All results are represented as means ± SD of data from independent experiments, N = 3.
Knockdown of Dicer1 inhibits de novo KSHV infection
To explore the impact of Dicer on KSHV infection, HUVECs were infected with KSHV at 24 h post-siRNA transfection. We confirmed the efficiency of Dicer knockdown by measuring the levels of Dicer1 transcript and Dicer protein. At 24 h post-transfection, siRNAs targeting Dicer1 potently reduced endogenous Dicer1 transcripts (Figure 9A). Dicer protein levels were also efficiently silenced at 24 and 48 h post-transfection (Figure 9B). At 3 days post infection, Dicer1 expression was maintained lower levels compared to control siRNAs transfected group (Figure 9C). Consistent with previous observations (11), KSHV infection induces the expression of Dicer1 when cells were transfected with negative control siRNA (Figure 9C). In response to the knockdown of Dicer1 expression, the levels of not only genome copies (Figure 9D), but also viral transcripts such ORF73(LANA) and ORF50(RTA) (Figure 9E) were reduced, indicating that Dicer is beneficial for KSHV infection. In conclusion, we demonstrated that Dicer positively regulates de novo KSHV infection.
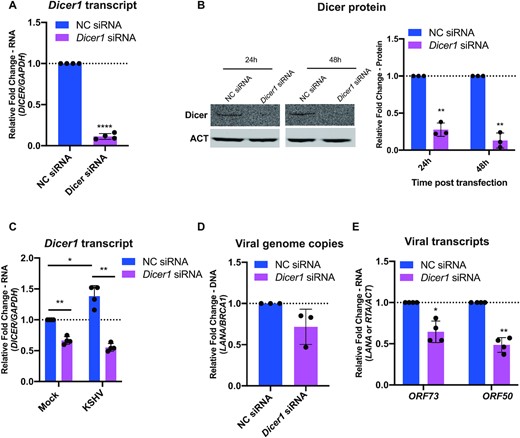
Dicer1 knockdown inhibits de novo KSHV infection. (A and B) Efficiency of Dicer1 knockdown in HUVECs was determined at 24 h post-transfection by qPCR (A), and at 24 and 48 h post-transfection by western blot (B). Results are shown relative to GAPDH (A) or β-actin (ACT) (B) and normalized to negative siRNA control. (C, D, and E) HUVECs were transfected with negative control siRNA and Dicer1 siRNA and 24 h later, cells were infected with BAC16 virus. At 3 days post infection, cells were harvested. (C) Levels of Dicer1 transcripts were analysed by qPCR. Results are shown relative to GAPDH and normalized to negative siRNA control. (D) Viral genome copies were measured by qPCR using primers specific to the ORF73(LANA) gene. Results are shown relative to BRCA1 and normalized to negative control siRNA. (E) Levels of ORF73(LANA) and ORF50(RTA) transcripts were analysed by qPCR. Results are shown relative to β-actin (ACT) and normalized to negative control siRNA. All results are represented as means ± SD of data from independent experiments, N = 3 and statistical analysis was done with a Student's t test. *P < 0.05, **P < 0.01, ***P < 0.001, ****P < 0.001.
DISCUSSION
MCPIP1 has been identified as a key negative regulator during human miRNA biogenesis (20). Our prior studies reported that MCPIP1 plays critical roles in regulation of KSHV miRNA biogenesis by directly degrading viral pre-miRNAs through its RNase activity (11). In these studies, MCPIP1 cleavage efficiency appeared to have substrate specificity in KSHV and human pre-miRNAs (11). Understanding MCPIP1 substrate specificity can contribute to elucidating how expression of individual KSHV miRNAs are regulated although most KSHV miRNAs are generated from a common transcript within the latent locus (8,31). To extend our previous findings, in the current study, we investigated MCPIP1 substrate specificity by evaluating correlations between MCPIP1 RNase activity and binding affinity under in vitro conditions. We showed that MCPIP1 cleavage efficiency displayed a positive correlation with binding affinity (Figure 1D and 3C). Motif-based sequence analysis further revealed an M5 base motif present in the terminal loop of KSHV pre-miRNAs that were well cleaved by MCPIP1 (Figure 2B). Mutational analysis was utilized to evaluate the importance of M5 base motif conferring MCPIP1 substrate specificity. We found that MCPIP1 preferentially degraded pre-miRNAs containing an M5 base motif present in terminal loops (Figures 3 and 4). In order to activate MCPIP1 catalytic reaction, RNAs need to bind to active site of MCPIP1, and specificity of MCPIP1-mediated degradation can vary depending on structural features and sequences of pre-miRNAs. We speculate that M5 base motif is critical to form a catalytically-active complex between MCPIP1 and pre-miRNAs. Although strong differences in MCPIP1 binding affinity between hsa-let-7c WT and its M5 base motif mutant were not observed, hsa-let-7c WT was more efficiently degraded by MCPIP1 compared to its M5 base motif mutant (Figure 3A and B), suggesting that in this case, MCPIP1 may form a catalytically impaired interaction with hsa-let-7c M5 base motif mutant even though MCPIP1 bound to hsa-let-7c M5 base motif mutant as efficiently as its WT resulting in reduced cleavage efficiency. To our surprise, M5 base motif mutant pre-miRNAs and pre-miRNAs without M5 base motif (kshv-mir-K12–6) within terminal loop did not completely inhibit MCPIP1 degradation (Figures 1 and 3), thereby raising the possibility that M5 base motif is not the only determinant for MCPIP1 substrate specificity. In addition to the M5 base motif, multiple factors such as structural features and additional sequences of pre-miRNAs may determine MCPIP1-mediated degradation by allowing the pre-miRNAs to successfully interact with the catalytic pocket of MCPIP1. Additional factors responsible for MCPIP1-mediated pre-miRNA recognition and cleavage need to be further investigated.
Multiple YRY motifs were enriched within or near stem loop regions of top ten human pre-miRNAs associated with MCPIP1 (20), and four of them have the exact M5 base motif described here. This M5 base motif was found in 67% of KSHV pre-miRNA loops, but only 26% of human pre-miRNAs expressed in human HepG2 cells. Results from other groups and our results suggest the importance of YRY motif in MCPIP1-mediated degradation of both human and KSHV pre-miRNAs. However, further investigation is still needed to characterize how M5 base motif affects MCPIP1 specificity on regulation of human and KSHV miRNA biogenesis.
In addition, we also asked whether MCPIP1 also preferentially cleaves pre-miRNAs of another γ-herpesvirus member, EBV. In vitro cleavage assay revealed that MCPIP1 selectively degrades both KSHV and EBV pre-miRNAs, strengthening the importance of MCPIP1 on regulation of miRNA biogenesis of gamma-herpesviruses, including KSHV and EBV (Supplementary Figure S2).
In our earlier studies, ectopic expression and knockdown of MCPIP1 demonstrated that MCPIP1 suppressed the expression of KSHV miRNAs in transfected KSHV-miRNA expressing cells as well as in KSHV latently infected cells (11). In those studies, MCPIP1 specificity was also observed, but with a smaller set of studied pre-miRNAs (11). Although MCPIP1 itself can bind and degrade pre-miRNAs, enzymatic actions of MCPIP1 may be more sophisticated in the context of the cellular environment following infection than the in vitro conditions that we tested due to involvement of additional RNA binding-proteins, diverse subcellular environments, and viral gene products. For example, expression of MCPIP1 and miRNA biogenesis factors, Dicer and TARBP is dynamically controlled during KSHV infection (6). In addition, UPF1, an RNA helicase is known to participate in MCPIP1 mediated mRNA decay (27). Further studies will uncover how MCPIP1 coordinates miRNA biogenesis in conjunction with cellular and viral factors during different stages of viral infection. Considering that MCPIP1 expression dynamically changes during viral infection, the expression of KSHV miRNAs might vary with different stages of viral infection. Additionally, it will be interesting to evaluate the biological significance of MCPIP1 substrate specificity on miRNA degradation observed in in vitro in additional cell types.
The studies here demonstrate that MCPIP1 has antiviral activity against KSHV via unique mechanisms. Antiviral roles of MCPIP1 against certain RNA viruses such as Flaviviruses, Sindbis virus, Encephalomycarditis virus (EMCV), HCV, Simian Immunodeficiency virus (SIV), CVB3 and HIV and DNA virus including Adenovirus and HBV have been uncovered but most of these antiviral activities were linked to degradation of viral RNA genome or mRNA through its RNase activity (14–19). Ectopic expression and knockdown of endogenous MCPIP1 studies have elucidated antiviral functions of MCPIP1 (Figures 5 and 6). KSHV enters cells, delivers its genome to cellular nucleus, and modulates the levels of cellular transcripts involved in key signal pathways within 2 h following infection in endothelial cells (22,32). MCPIP1 expression from 6 h post-KSHV infection exhibited antiviral effects in the current study (Figure 5), suggesting antiviral roles of MCPIP1 in establishment and maintenance of latency at later times of de novo infection.
Dicer restricts adenovirus replication by degrading adenovirus-encoded small RNAs (33). In contrast, HSV-1 replication is reduced in Dicer-deficient cells, compared to wild-type cells (34). Similar to observations from HSV-1 (34), we also found that MCPIP1 suppressed the expression levels of Dicer that benefits to KSHV infection (Figures 7–10). RNA-interference mediated Dicer1 knockdown in KSHV latently infected PEL cells induced the expression of lytic genes, ORF50 and ORF59 as well as lytic replication (35), implying the supportive roles of Dicer in maintenance of KSHV latent infection. We further need to investigate additional mechanisms by which MCPIP1 inhibits KSHV infection.
Expression of miRNA biogenesis factors change during KSHV infection. MCPIP1 expression was downregulated whereas expression levels of Dicer1 and TARBP1/2 were upregulated in de novo KSHV-infected HUVEC cells (6). MCPIP1 expression is induced by proinflammatory cytokines such as TNF-α, MCP-1 and IL-1β, many of which are stimulated at the site of KSHV infection (9–11). This suggests that inflammatory induction of MCPIP1 might serve as an antiviral response to degrade viral pre-miRNAs shortly after infection. However, KSHV appears to have evolved mechanisms to inhibit MCPIP1; the KSHV pre-miRNA, miR-K6, which is resistant to MCPIP1-mediated degradation, generates a mature miRNA that suppresses MCPIP1 expression by directly targeting the 3′ UTR of MCPIP1 mRNA for degradation (11). It is also reasonable to consider the involvement of additional viral and cellular factors in the suppression of MCPIP1 expression. MCPIP1 expression inhibits the levels of Dicer1 transcripts and Dicer protein (Figure 7A and B), explaining inverse expression between MCPIP1 and Dicer1 during KSHV de novo infection (6). HITS CLIP revealed three MCPIP1 binding sites within Dicer1 mRNA, with two sites in the 3′ UTR stem loop of Dicer1 mRNA and contains a YRY motif (27), raising the possibility that MCPIP1 directly degrades Dicer1 transcript by targeting the 3′ UTR site in the Dicer1 mRNA. Our results from in vitro cleavage assay demonstrated that MCPIP1 robustly degraded both target regions in 3′ UTR of Dicer1 transcripts (Figure 8). However, YRY motif did not affect MCPIP1 mediated degradation of these two regions (Figure 8). The RNA binding protein, AU-binding factor-1 (AUF1), is a cellular factor that is also suppressed after KSHV infection (11). AUF1 reduces the stability of Dicer1 mRNA and may also contribute to increased levels of Dicer1 expression after KSHV infection (36). In addition, KSHV miRNAs such as kshv-miR-K12–2 and kshv-miR-K12–5 induced increased expression of Dicer1 and TARBP1/2 possibly by silencing genes that inhibit their expression (11). Taken together, KSHV alters the expression of miRNA biogenesis factors to facilitate its miRNA biogenesis.
KSHV infection induces the expression of cytokines such as IL-6 and IL-10 (37,38). Human IL-6 is a major factor in the pathogenesis of KSHV associated diseases (39,40). MCPIP1 downregulates the levels of IL-6 mRNA by targeting its 3′ UTR using RNase activity (12). Our previous observations that exogenously expressed MCPIP1 reduced the levels of IL-6 expression during KSHV infection (11) also support MCPIP1 as a suppressor of IL-6. Additional studies will be needed to elucidate how regulation of MCPIP1 may influence the regulation of cytokines as well as the clinical outcome in the context of KSHV infection. In summary, our findings demonstrated that MCPIP1 inhibits KSHV infection and suppresses viral miRNA biogenesis by directly degrading KSHV pre-miRNAs and suppressing the expression of Dicer (Figure 10).

A schematic model depicting the MCPIP1 mediated inhibition of KSHV infection. Upon KSHV infection, positive miRNA biogenesis factors, Dicer expression levels are enhanced while the expression of the negative miRNA biogenesis factor, MCPIP1, is suppressed to provide favourable environment for viral miRNA biogenesis. However, the human host induces the expression of inflammatory cytokines upon infection, which upregulates MCPIP1 expression. MCPIP1 expression inhibits KSHV miRNA biogenesis by directly degrading KSHV miRNAs and by suppressing the expression of a positive miRNA biogenesis factor, Dicer. Furthermore, MCPIP1 inhibits KSHV infection by suppressing the expression of Dicer that positively regulates KSHV infection.
SUPPLEMENTARY DATA
Supplementary Data are available at NAR Online.
ACKNOWLEDGEMENTS
The DOX-inducible GFP-MCPIP 293T cells were a generous gift from Tianyi Wang. Recombinant MCPIP1 protein was generated by Jane Jones at Leidos Biomedical Research, Inc. We would like to acknowledge Robert Yarchoan, Ramya Ramaswami, Kathryn Lurain, Xinhua Ji, Shou Gu, Laurie Krug, Vladimir Majerciak, Anna Serquiña, and Takanobu Tagawa for their insight and critical reading of this manuscript. Additional data are found in the supplementary data section.
FUNDING
Intramural Research Program of the Center for Cancer Research, National Cancer Institute, National Institutes of Health [1ZIABC011176]. Funding for open access charge: Laboratory budget from NCI.
Conflict of interest statement. None declared.

Comments