


Abstract
Expression of Salmonella enterica loci harboring undermethylated GATC sites at promoters or regulatory regions was monitored by single cell analysis. Cell-to-cell differences in expression were detected in ten such loci (carA, dgoR, holA, nanA, ssaN, STM1290, STM3276, STM5308, gtr and opvAB), with concomitant formation of ON and OFF subpopulations. The ON and OFF subpopulation sizes varied depending on the growth conditions, suggesting that the population structure can be modulated by environmental control. All the loci under study except STM5308 displayed altered patterns of expression in strains lacking or overproducing Dam methylase, thereby confirming control by Dam methylation. Bioinformatic analysis identified potential binding sites for transcription factors OxyR, CRP and Fur, and analysis of expression in mutant backgrounds confirmed transcriptional control by one or more of such factors. Surveys of gene expression in pairwise combinations of Dam methylation-dependent loci revealed independent switching, thus predicting the formation of a high number of cell variants. This study expands the list of S. enterica loci under transcriptional control by Dam methylation, and underscores the relevance of the DNA adenine methylome as a source of phenotypic heterogeneity.
INTRODUCTION
Non mutational variation plays multiple roles in bacterial populations. For instance, formation of cell types with different surface antigens permits evasion of the immune system inside animal hosts (1). In biofilms, cell-to-cell variation can foster division of labor (2). Phenotypic heterogeneity can also facilitate survival in the presence of antibacterial agents (3,4) and of bacteriophages (5,6). The benefits of phenotypic variation remain hypothetical in other cases, mainly due to experimental difficulties. However, game theory analysis supports the view that cell-to-cell variation has adaptive value for bacterial populations, especially in variable and hostile environments (7,8). The variety of mechanisms that produce cell diversification, which is indicative of independent origin, provides additional, indirect evidence that phenotypic variation may have evolved by natural selection (9–11).
A widespread mechanism for formation of phenotypic variants in a population of isogenic bacterial cells is epigenetic control by DNA methylation (12). For instance, certain DNA methyltransferases belonging to restriction-modification systems undergo reversible switching between active and inactive states, thus generating cells in which the genome is methylated and cells in which the genome is nonmethylated (13–15). If the methylation state of promoters or regulatory regions affects transcription, each cell lineage displays a distinct transcriptomic profile. In turn, transcriptome differences can cause phenotypic differences, and the literature contains an increasing list of examples in which such differences affect virulence of bacterial pathogens (13,14,16).
Formation of bacterial lineages under DNA methylation control is also found in bacterial species that harbor DNA methyltransferases that are not part of restriction-modification systems (11). Paradigms of this class are the Dam methylase of gamma-proteobacteria and the CcrM methylase of alpha-proteobacteria, which methylate the adenosine moiety in 5′GATC3′ and 5′GANTC3′ motifs, respectively (17–19). In Escherichia coli and Salmonella enterica, most GATC sites are fully methylated except for a short period of hemimethylation after passage of the DNA replication fork (17,18,20). Certain GATC sites, however, can remain stably undermethylated (hemimethylated or nonmethylated) if the activity of Dam methylase is prevented by binding of proteins to cognate DNA sites (12,18). Hindrance of Dam methylase activity is favored at GATC sites flanked by nucleotide sequences that decrease Dam processivity (21), and nonmethylation occurs when DNA methylase activity is blocked during two consecutive DNA replication rounds (22).
Combinations of methylated and undermethylated GATCs at regulatory regions upstream of promoters can regulate transcription in a bistable manner, giving rise to OFF and ON cells (22). In such systems, the existence of two or more binding sites for a transcription factor permits alternative binding patterns, one of which activates transcription. A paradigm of bistable expression regulated by Dam methylation is pap, a fimbrial operon of uropathogenic E. coli under transcriptional control the leucine-responsive regulatory protein, Lrp (23–25). Alternative patterns of Lrp binding and GATC undermethylation generate the OFF and ON states, which give rise to nonfimbriated and fimbriated subpopulations (23). Additional examples of formation of DNA methylation patterns involve the transcriptional regulators OxyR, Fur and HdfR (26–31). The number of GATC sites involved and the architecture of the regulatory region is different in each case but all have in common the formation of methylated and undermethylated GATCs (12).
Undermethylation of specific GATC sites can be detected by genome digestion with restriction enzymes followed by deep sequencing (32,33). An alternative procedure is whole genome analysis by single molecule real-time sequencing (SMRT), a technology that permits detection of N6-methyl-adenine at a single base resolution (34). In this study, we have used previously published SMRT sequencing data (28) to assemble a catalog of undermethylated GATC sites in the genome of S. enterica ser. Typhimurium strain ATCC 14028. Single cell analysis using fluorescent reporter proteins GFP, mCherry and mOrange reveals that a fraction of such loci undergo heterogeneous expression under Dam methylation control, with concomitant formation of cells in ON and OFF transcriptional states. We thus identify novel loci with heterogeneous expression controlled by Dam methylation in S. enterica. We also show that seven such loci undergo ON/OFF switching in an independent manner, an observation that outlines the relevance of the DNA adenine methylome as a powerhouse for the formation of phenotypic variants.
MATERIALS AND METHODS
Bacterial strains, bacteriophages and strain construction
The strains of S. enterica used in this study belong to serovar Typhimurium and derive from strain ATCC 14028 (Supplementary Table S1). For simplicity, S. enterica serovar Typhimurium is named S. enterica throughout the text. Plasmid pTP166 (35) was kindly provided by Martin G. Marinus, University of Massachusetts, Worcester, MA. For construction of gfp transcriptional fusions, a fragment containing the promoterless green fluorescent protein (gfp) gene and the chloramphenicol resistance cassette was amplified from pZEP07 (36) using primers listed in Supplementary Table S2. The constructs were integrated into the chromosome of S. enterica using the lambda Red recombination system (37). For construction of strains harboring mCherry transcriptional fusions, a DNA fragment containing the promoterless mCherry gene and the kanamycin resistance cassette was PCR-amplified from pDOC-R, an mCherry-containing derivative of plasmid pDOC (a gift from Steve Busby's lab, University of Birmingham, UK). For construction of strains harboring mOrange transcriptional fusions, the mOrange2 gene and the kanamycin resistance cassette were PCR-amplified from pGEMT-mOrange (kindly provided by Carmen R. Beuzón, University of Málaga, Spain). Transductional crosses using phage P22 HT 105/1 [(38) and G. Roberts, unpublished] were used for construction of strains lacking individual transcription factors (OxyR, CRP, Lrp or Fur). Strains carrying pairwise combinations of GFP and either mCherry or mOrange fusions were also constructed by P22 HT transduction. The transduction protocol has been described elsewhere (39). To obtain phage-free isolates, transductants were purified by streaking on green plates (40).
Media and culture conditions
Bertani's lysogeny broth (LB) contained tryptone 10 g/l, yeast extract 5 g/l and NaCl 5 g/l. The composition of ISM (intracellular salts medium) was 5 mM KCl, 7.5 mM (NH4)2SO4, 0.5 mM K2SO4, 38 mM glicerol (0.3% v/v), 0.1% casamino acids, 8 μM MgCl2, 337 μM H3PO4, 80 mM MES (for titration to pH 5.8). Solid LB contained agar at 1.5% final concentration. All cultures were grown at 37°C. Oxygen limitation was achieved by growth without shaking in borosilicate tubes containining 5 ml of LB. To grow oxyR mutants on LB agar, 75 μl of a 10 mg/ml catalase solution (Sigma-Aldrich, St Louis, MO, USA) were spread on the surface of the plates.
Analysis of SMRT sequencing data
Bioinformatic analysis was performed on raw SMRT sequencing data described in a previous study (28). The Pacific Biosciences’ SMRT Portal platform, v. 2.1.0 was used to identify modQVs at each position. These values were computed as the −10 log (P-value) based on the distributions of the kinetics of interpulse durations (IPD ratios). A modQV score of 20 is the minimum default threshold and corresponds to a P-value of 0.01 (28). All the undermethylated positions detected in this work are under this threshold.
Identification of undermethylated GATC sites in the genome of Salmonella enterica Serovar Typhimurium ATCC 14028
A homemade Perl script was used to identify undermethylated GATC sites among the 19 229 GATCs present in the S. enterica ATCC 14028 genome. Another in-house Perl script identified pairs or higher order clusters of GATC motifs separated by <256 nucleotides (41). The Kolmogorov–Smirnov test for two samples, implemented in PAST (42), was used to test whether the distribution of undermethylated GATCs in the S. enterica genome was homogeneous or heterogeneous.
Identification of DNA sequence motifs for binding of transcription factors
The FIMO tool from the MEME software suite (43) with default settings was used to scan a sequence database set of DNA sequences from nine loci (carA, dgoR, holA, nanA, ssaN, STM1290, STM3276, gtr and opvAB) containing 600 bp upstream and 100 pb downstream of the transcription start site. Individual matches to OxyR, CRP and Fur binding motifs were sought.
Flow cytometry
Flow cytometry was used to monitor expression of transcriptional GFP fusions. Data acquisition was performed using a Cytomics FC500-MPL cytometer (Beckman Coulter, Brea, CA, USA) and data were analyzed with FlowJo X version 10.0.7r software (Tree Star, Inc., Ashland, OR). S. enterica cultures were washed and re-suspended in phosphate-buffered saline (PBS) for fluorescence measurement. Fluorescence values for 100 000 events were compared with the data from the reporter-less control strain, thus yielding the fraction of ON and OFF cells.
Fluorescence microscopy
Strains containing individual or pairwise combinations of GFP and mCherry/mOrange fusions were grown at 37°C. Samples of 1.5 ml were collected by centrifugation at 3400 × g for 5 min. Cells were placed on an agarose slab (0.9% agarose/1% LB medium) pre-warmed at 37°C. Images were captured with a Zeiss Apotome fluorescence microscope equipped with a 100× Plan Apochromat objective and an incubation system that allows cultivation and observation of living cells. Pictures were taken using an Axiocam 506 camera, and the images were analyzed using ImageJ software (Wayne Rasband, Research Services Branch, National Institute of Mental Health, MD, USA).
RESULTS
Distribution of undermethylated GATC sites in the Salmonella enterica genome
The methylation state of GATC sites in the chromosome of S. enterica strain ATCC 14028 grown in LB was inferred from raw SMRT data obtained in a previous study (28). Bioinformatic analysis revealed the presence of 46 undermethylated GATC sites. Among such sites, 20 were hemimethylated, and 13 were nonmethylated (Supplementary Table S3). A Kolmogorov–Smirnov test for uniform distribution indicated that the 33 undermethylated GATCs were not randomly distributed in the S. enterica genome. A list of the 46 nonmethylated sites detected (20 in hemimethylated GATCs and 26 (13 × 2) in nonmethylated GATCs is presented in Supplementary Table S3, indicating the DNA strand and the genome location. Most undermethylated sites (42/46) were located in clusters that included 2, 3, or 4 GATC sites at distances below the 1/256 distance predicted for random occurrence (41). Table 1 includes only the 16 loci containing GATC sites at promoters or regulatory regions (known or putative), and indicates their methylation state. The distribution of these sites was as follows: one undermethylated GATC in the dgoR gene; two in carA, ssaN, slrA, STM1290 and yihU; three in STM5047, STM5308, STM3726 and STM2047; four in ftnB, gtr, opvAB and STM4889; five in holA; and eight in nanA. The list includes undermethylated GATC sites previously shown to be involved in transcriptional control of the gtr and opvAB operons (28,29). This observation served as an internal control, indicating that the bioinformatic analysis was reliable.
Loci harboring undermethylated GATCs in regulatory regions
| Locus | Gene product | Number of GATCs | Number of undermethylated GATCs | Position(s) of GATC undermethylated A(s)a | Methylation stateb |
|---|---|---|---|---|---|
| carA | Carbamoyl-phosphate synthase small chain | 2 | 2 | −511, −206 | N, H |
| dgoR | Galactonate operon transcriptional repressor | 1 | 1 | −147 | H |
| ftnB | Ferritin-like protein | 4 | 2 | −340, −156 | H, H |
| gtr | O-antigen glycotransferase | 4 | 2 | −69, −56 | N, N |
| holA | DNA polymerase III, delta subunit | 5 | 1 | +4 | H |
| nanA | N-acetylneuraminate lyase | 8 | 1 | −58 | H |
| opvAB | O-antigen chain length regulation | 4 | 2 | −178, −105 | N, N |
| slrA | Glucitol/sorbitol-specific enzyme IIC component | 2 | 1 | −86 | H |
| ssaN | Type III secretion ATP synthase | 2 | 1 | −202 | N |
| STM1290 | N-acetylmannosamine-6-phosphate-2-epimerase | 2 | 1 | −465 | N |
| STM2047 | Hypothetical protein | 3 | 1 | −68 | H |
| STM3726 | Putative mannitol dehydrogenase | 3 | 1 | −68 | H |
| STM4889 | Putative Na+/galactosidase symporter | 4 | 1 | −171 | N |
| STM5047 | Putative cytoplasmic protein | 3 | 1 | −108 | H |
| STM5308 | Sugar transporter | 3 | 1 | −66 | N |
| yihU | Hypothetical oxidoreductase | 2 | 1 | −66 | N |
aRelative to known or predicted transcription start sites.
bN: nonmethylated; H: hemimethylated.
Expression patterns of loci harboring undermethylated GATC sites in putative regulatory regions
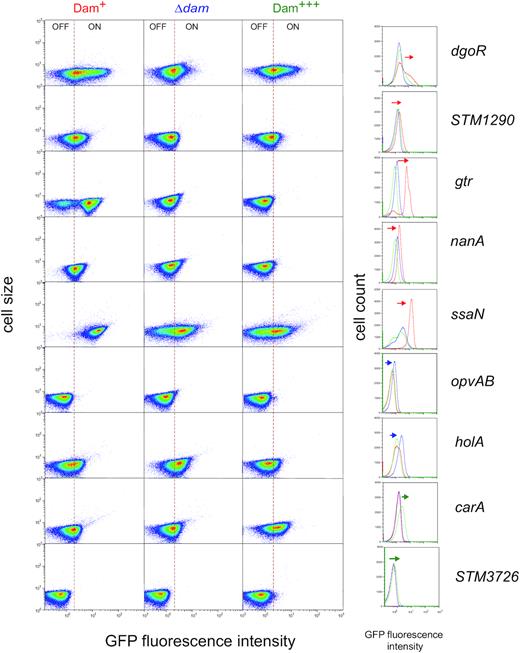
The expression patterns of the 16 loci harboring undermethylated GATC sites potentially involved in transcriptional control (dgoR, carA, ssaN, slrA, yihU, STM1290, STM5047, STM5308, STM3726, STM2047, nanA, ftnB opvAB, gtr, holA and STM4889) were investigated using transcriptional fusions with the green fluorescent protein (GFP) gene. Each fusion was constructed downstream of the locus under study, and expression was monitored by flow cytometry. Cultures were grown in LB under aerobiosis, LB under microaerophilia and intracellular salts medium (ISM). These choices took into consideration the Salmonella lifestyle: LB under microaerophilia permits reductionist imitation of the intestinal environment (44) while ISM mimics the intracellular environment (45). Expression of six loci (ftnB, slrA, yihU, STM2047, STM4889 and STM5047) was low or absent under every growth condition (Supplementary Figure S1), and the loci were excluded from further analysis. GFP fusions in the remaining 10 loci were found to be active, and a remarkable observation was that expression appeared to be heterogeneous in one or more culture conditions, with formation of cells in OFF and ON states (Figure 1, panel A). Visualization of individual S. enterica cells by fluorescence microscopy confirmed the existence of ON and OFF cells (Figure 1, panel B).

Expression of loci harboring undermethylated GATC sites at putative promoters or regulatory regions, monitored by single cell analysis. (A) Flow cytometry analysis of strains carrying gfp transcriptional fusions downstream of the loci under study. The GFP fluorescence intensity distribution was examined in cultures grown in LB under aerobiosis, LB under miare OKcroaerophilia and intracellular salts medium (ISM). Dot plots represent the forward scatter (cell size) versus fluorescence intensity. (B) Visualization of Salmonella cells by fluorescence microscopy. For each locus, the image shown was obtained under the growth condition in which bistability was most conspicuous (LB under microaerophilia for carA, dgoR, gtr, holA, STM1290, STM3276 and STM5308, and LB under aerobiosis for opvAB and ssaN). White arrows signalize ON cells. Scale bars indicate 5 μm.
For certain loci, different proportions of OFF and ON cells were found depending on the growth conditions, indicating that expression of such loci is susceptible to environmental influence. For instance, the OFF subpopulation found in LB under microaerophilia for dgoR, carA and nanA decreased or even disappeared in ISM and in LB under aerobiosis (Figure 1). Differences in subpopulation sizes depending on growth conditions were also detected for ssaN, holA and STM1290 (Figure 1).
Role of Dam methylation in transcriptional control of undermethylated loci
Loci showing heterogeneous expression (carA, dgoR, gtrA, holA, nanA, opvAB, ssaN, STM1290, STM3276 and STM5308) were tested for Dam methylation control by monitoring the levels of GFP fluorescence in three genetic backgrounds: the wild type strain, a dam mutant, and a strain carrying the dam gene on the multicopy plasmid pTP144 (35). GFP fluorescence was measured by flow cytometry under the three growth conditions described above. Both heat maps and histograms are shown because each of these representations is more informative depending on the locus (Supplementary Figure S2). A simplified version of the same results is presented in Figure 2, which shows the expression pattern of each locus under the growth conditions that revealed Dam methylation-dependent control in a most conspicuous manner. STM5308 is not included in Figure 2 because Dam-dependent regulation was not detected (see Supplementary Figure S2). The Dam methylation-dependent expression patterns observed for the remaining loci were as follows:
In a dam background, the size of ON subpopulations decreased at four loci (dgoR, STM1290, gtr and ssaN), suggesting that GATC methylation is involved in transcriptional activation (Figure 2). In turn, a larger ON subpopulation was detected at two loci (opvAB and holA), suggesting Dam-dependent repression (Figure 2). Absence of Dam methylation had little effect, if any, on carA, nanA and STM3726 expression (Figure 2). As above, gtr and opvAB served as internal controls as these loci have been previously shown to undergo transcriptional upregulation (opvAB) and transcriptional downregulation (gtr) in a dam background.
Overexpression of Dam methylase increased the size of CarAON and STM3726ON subpopulations, thereby indicating Dam-dependent activation of transcription (Figure 2).
Detection of a smaller HolAON subpopulation upon Dam methylase overexpression confirmed Dam-dependent repression (Figure 2). At nanA, repression was especially severe, and Dam methylase overproduction abolished formation of the NanON subpopulation (Figure 2).
Single cell analysis of Dam methylation-dependent control of carA, dgoR, gtr, holA, nanA, opvAB, ssaN, STM1290 and STM3726. Gene expression was measured by flow cytometry in the wild type (left column and red line in the histograms), in a dam mutant (middle column and blue line in the histograms) and under Dam methylase overproduction (right column and green line in the histograms). Dot plots represent the forward scatter (cell size) versus fluorescence intensity. Histograms represent the frequency of cells with different GFP intensities, and changes in the pattern of expression are indicated with arrows. The growth condition shown for dgoR, STM1290, holA and carA is LB under microaerophilia; for gtr, nanA, opvAB and STM3726 is LB under aerobiosis; and for ssaN is ISM minimal medium. More detailed information is provided in Supplementary Figure S2.
Identification of regulators involved in transcriptional control
Undermethylation of GATC sites is usually a consequence of protein binding which hinders DNA methylase activity (11,12). The presence of undermethylated GATC sites upstream of genes (Table 1 and Supplementary Table S3) thus suggested that these sites might be located within or near binding sites for transcription factors. Because transcription factors OxyR, LRP, CRP and Fur have been previously shown to direct undermethylated GATC formation (12), expression of the loci under study was monitored in the absence of individual transcription factors. For this purpose, gfp fusions were transferred to oxyR, lrp, crp and fur mutants using P22 HT transduction. The resulting strains were grown, as above, in LB under aerobiosis, LB under microaerophilia and ISM medium, and the expression of the gfp fusions was monitored by flow cytometry. Strains harboring the same fusions in a wild type background were used as controls. The results from these experiments are shown in Supplementary Figure S3. A simplified version of the same results is presented in Figure 3, showing the expression pattern of each locus under the growth conditions in which altered expression is most easily seen. With the exception of STM3726, the remaining loci under study changed their expression pattern in one or more mutant backgrounds (Figure 3). However, none of the loci under study was found to be under Lrp control. Changes in the expression patterns of gtr and opvAB in an oxyR background are in agreement with the literature (28,29) thus serving as internal controls for the trials (Figure 3). Relevant observations can be summarized as follows:
The subpopulations of CarAOFF, DgoROFF, NanAOFF, SsaNOFF and STM1290OFF cells were larger in the absence of CRP, thereby suggesting transcriptional activation. In contrast, the size of the HolAON and OpvABON subpopulations increased in a crp background, which may be indicative of repression by CRP. The ability of CRP to act either as a repressor or as an activator of transcription has been known for decades (46).
In the absence of Fur, the size of the OpvABON subpopulation increased, suggesting Fur-mediated repression. A Dam methylation-dependent locus repressed by Fur has been described in E. coli (27,47).
In the absence of OxyR, the frequencies of SsaNON and OvpABON cells decreased. The role of OxyR as an opvAB activator has been described previously (48).
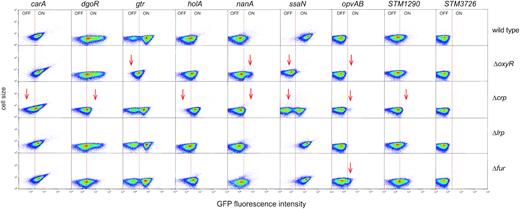
Flow cytometry analysis of carA, dgoR, gtr, holA, nanA, opvAB, ssaN and STM1290 expression in the absence of individual transcriptional factors. Dot plots represent the forward scatter (cell size) versus fluorescence intensity. For dgoR, holA, nanA, STM1290 and STM3726, the growth condition shown is LB under microaerophilia; for gtr and opvAB is LB under aerobiosis; and for carA and ssaN is ISM. More detailed information is provided in Supplementary Figure S3.
To investigate whether the expression changes detected by flow cytometry might provide evidence for transcriptional control, potential DNA binding motifs for the transcription factors under study were sought at sequences flanking the GATCs. The FIMO tool from the MEME software suite was used for this purpose (49). Subsequently, Tomtom was used to compare the motifs found by MEME with known motifs contained at the Collect TF database, https://www.uniprot.org/database/DB-0198. Results from these searches are shown in Table 2 and Supplementary Table S4, and can be summarized as follows:
Putative CRP binding sites were identified upstream of carA, dgoR, nanA, ssaN and STM1290 (Table 2), in agreement with the observation that these loci are under positive control by CRP. In dgoR and nanA, GATCs where found within the putative CRP binding sites while in carA, STM1290 and ssaN, GATC sites were found near (but not within) the putative CRP binding sequence. Note that ‘outsider’, nearby GATC sites can anyway be involved in transcriptional control, presumably as a consequence of the formation of higher order DNA structures in regions bound by transcription factors active as dimers or multimers (28).
Putative OxyR binding sites were found in gtr, opvAB, and ssaN, which is consistent with genetic evidence indicating regulation by OxyR (Figure 3). For gtr and opvAB, regulation by OxyR is also in agreement with the literature (28,29,48).
Putative binding sites for Fur were detected upstream of both opvAB and gtr (Table 2). Fur-mediated regulation was indeed detected for opvAB (Figure 3) but not for gtr, perhaps because the experimental conditions were not appropriate.
Failure to identify binding sites for CRP upstream of holA (Table 2) might be indicative of indirect control.
Identification of potential binding sites for transcription factors
| Locus | Transcription factor involved | Predicted TF binding site (5′-3′) | Location relative to transcription start site |
|---|---|---|---|
| carA | CRP | CGATTGTAATTCTTATTACATTG | −499 to −477 |
| dgoR | CRP | TTTTGTGATCTAAATTGTA | −154 to −132 |
| gtr | CRP | TAACTTTAAACTATTGAATA | −100 to −82 |
| OxyRb | GATCGGTAACAACGATC | −134 to −119 | |
| OxyRb | GATCGTTTATATCGATC | −70 to −55 | |
| Fur | AATTAATAAGATAACAATAACTTTAAACTATTGAATA | −118 to −82 | |
| holA | CRP | Not found | |
| nanA | CRP | AAATGCGGTAGCGATCGCA | −145 to −127 |
| CRP | GTTTAGTGAAGCAGATCGCAC | −113 to −94 | |
| OxyR | ATTGTGATTGTTGATGCCAT | −260 to −241 | |
| opvAB | CRP | AAAGTGTGCTCTGGTTTGCAA | −489 to −469 |
| OxyRa | ATAGTTTATATCTAT | −161 to −147 | |
| OxyRa | GATCGATTTTAATTAT | −129 to −115 | |
| OxyRa | ATAGTTTTTATCTAT | −88 to −74 | |
| OxyRa | GATCGATATAACCAGT | −56 to −42 | |
| Fur | CGTCACATAAAACAAAAACGATCAATTTTATTTATATGA | −199 to −161 | |
| ssaN | CRP | GTCTTATTTTCGGCACCTTAA | −435 to −415 |
| OxyR | CATTAATAAAATCGCTGAAACTTTGCAACGGCTTGT | −500 to −465 | |
| STM1290 | CRP | ATGTGACCAAGCGCTAAAAAT | −428 to −408 |
| CRP | TGTGATGCATTTCATACTG | −283 to −265 | |
| CRP | TATGACTGTGTTCACATTT | −102 to −84 |
In summary, in most cases genetic evidence for regulation by a given transcription factor was accompanied by the detection of a putative binding site for such a factor. Because our trials have been restricted to transcription factors previously known to be involved in Dam-dependent transcription (12), one cannot exclude that expression of the loci under study may be subjected to additional controls.
A notion well established in the literature is that GATC undermethylation is typically caused by DNA binding proteins (e.g. transcription factors) that hinder Dam methyltransferase activity (12,24,50). On this ground, we examined the methylation state of the nanA promoter in crp+ and crp– backgrounds. Different methylation patterns were detected (Supplementary Figure S4), thus providing evidence that nanA GATC undermethylation is indeed a consequence of CRP binding. Methylation occlusion by transcription factors CRP, Fur and OxyR may likewise produce undermethylation at the other loci considered in this study.
Tests of co-ordinated vs independent switching
The existence of locus-specific expression patterns and the variety of transcription factors involved raised the possibility that each locus might undergo independent switching. However, certain regulators appeared to control more than one Dam-methylation locus, thus suggesting the alternative possibility that co-ordinated regulation might occur. To address this issue, tests were performed to determine whether the loci under study undergo ON−OFF switching in a co-ordinated manner or independently. For this purpose, strains that carried pairwise combinations of a GFP fusion and either an mCherry or mOrange fusion were constructed, and the presence of OFF and ON cells was monitored by fluorescence microscopy. Altogether, 10 pairwise combinations were tested: ssaN versus gtr, ssaN versus carA, nanA versus gtr, nanA versus ssaN, opvAB versus gtr, opvAB versus ssaN, dgoR versus gtrA, dgoR versus ssaN, holA versus gtr and holA versus ssaN. Cells that expressed either mCherry/mOrange or GFP were detected in all trials, together with cells that expressed both fusions and cells that did not express mCherry/mOrange nor GFP. These observations provide evidence that the loci under examination are capable of independent switching (Figure 4).
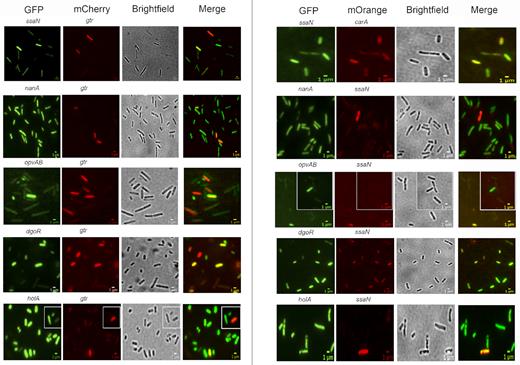
Tests of co-ordinated and/or independent switching of loci under transcriptional control by Dam methylation. Fluorescence images of S. enterica cells are shown, visualizing the expression of 10 pairwise combinations of gene fusions (ssaN versus gtr, ssaN versus carA, nanA versus gtr, nanA versus ssaN, opvAB versus gtr, opvAB versus ssaN, dgoR versus gtrA, dgoR versus ssaN, holA versus gtr and holA versus ssaN). Each row shows a strain containing a GFP and either an mCherry or an mOrange transcriptional fusion. The growth condition shown for ssaN versus gtr, nanA versus gtr, opvAB versus gt, ssaN versus carA, nanA versus ssaN, opvAB versus ssaN, dgoR versus ssaN and holA versus ssaN is LB under aerobiosis; for dgoR versus gtr, and holA versus gtr, the growth condition shown is LB under microaerophilia. Scale bars indicate 1 μm.
DISCUSSION
Heterogeneous gene expression in isogenic populations of cells can be the consequence of stochastic fluctuation of cell components, a phenomenon known as noise (51,52). In certain cases, cell-to-cell variations generated by noise can be propagated by feedback loops, giving rise to subpopulations of cells with distinct phenotypes (10,11,53). When two phenotypic lineages are formed, the phenomenon is known as bistability or bimodality (53,54). In bacterial populations, examples of noise-driven bistability include (among others) control of sporulation, activation of genetic competence, antibiotic resistance, biofilm formation and myo-inositol utilization (9,53,55).
Alongside bistable switches that combine random and deterministic components, bacteria can employ purely deterministic strategies to generate phenotypic lineages, and a well known mechanism is transcriptional control by DNA methylation (12). In gamma-proteobacteria, control of bistability by DNA adenine (Dam) methylation usually requires the formation of methylation patterns (combinations of methylated and undermethylated GATC sites) at promoters and/or nearby regions involved in transcriptional control. Undermethylation (stable hemimethylation or nonmethylation) of a GATC site occurs when Dam methyltransferase activity is hindered by a DNA-bound protein (12). In E. coli and Salmonella, the list of proteins that are known to cause undermethylation of GATC sites includes transcription factors Lrp, OxyR, Fur and HdfR (12).
In this study, we have used undermethylated GATC sites in the S. enterica genome as indicators of transcriptional control by Dam methylation. Indeed, among 16 loci containing undermethylated GATCs at promoters or regulatory regions (known or putative), nine showed distinct expression patterns depending on Dam methylase availability (Figure 2). Detection of undermethylated DNA sites upon SMRT sequencing may thus be considered a fairly productive approach, alternative or complementary to genetic and transcriptomic screens (56,57), to identify genes under DNA methylation control.
A remarkable trait shared by the nine Dam-dependent loci under study is bistable expression, with concomitant formation of cells in OFF and ON transcriptional states (Figure 1). Altered OFF and ON subpopulation sizes upon lack and/or overproduction of Dam methyltransferase confirmed that bistability is under Dam methylation control (Figure 2 and Supplementary Figure S2). An additional observation was that the ON/OFF ratios for the Dam-dependent loci under study varied depending on the medium and/or the growth conditions (Figure 2 and Supplementary Figure S2), in agreement with seminal studies describing conditions that affected the formation of undermethylated GATC sites in the E. coli chromosome (58,59).
Evidence for environmental influence, together with the fact that undermethylation is usually caused by protein binding (18,50), led us to search for S. enterica factors that might be involved in transcriptional control of the loci under study. Single cell analysis in mutant strains lacking individual transcription factors OxyR, CRP and Fur confirmed that subpopulation formation was under the control of one or more such factors (Figure 3 and Supplementary Figure S3). Detection of transcriptional control of opvAB and gtr by OxyR was confirmatory of published data (28,29,48), thus providing an internal control for the survey. Among the novel observations made, variations in the size of the OpvABON lineage were detected in the absence of either CRP or Fur (Figure 3 and Supplementary Figure S3), suggesting that these regulators may contribute to transcriptional control of the opvAB operon. Because opvAB controls O-antigen chain length (48), CRP and/or Fur might perhaps skew ON/OFF switching under specific environmental circumstances. Environmental control of bistability may be also envisaged, again in a speculative manner, for CRP-mediated control of dgoR, nanA and perhaps holA. Dam methylation-dependent control of ssaN, a gene of Salmonella pathogenicity island 2 (SPI-2) (60), might play a role in the interaction of Salmonella with the animal host. The ssaN gene product, an ATPase, is essential for the activity of the type III secretion apparatus encoded by SPI-2, which permits survival inside macrophages (61). Formation of SsaNOFF and SsaNON subpopulations thus raises the possibility that SPI-2 expression inside macrophages may be bistable. Under laboratory conditions, formation of SsaNOFF and SsaNON lineages is under positive control by OxyR and under negative control by CRP (Figure 3 and Supplementary Figure S3), which may suggest a complex regulation, perhaps responsive to environmental cues. Speculations on the physiological significance of Dam methylation-dependent bistability in housekeeping loci like holA, a gene involved in DNA replication, and dgoR, a metabolic gene, would be even more premature than for the genes discussed above.
In contrast with our tentative, uncertain speculations on the physiological roles of Dam-dependent bistability in the loci under study, a clear-cut conclusion was obtained in trials aimed at determining whether switching of the loci under study was co-regulated or independent. Indeed, fluorescence microscopy observation of ON and OFF cells in strains that carried pairwise combinations of distinct fluorescent fusions revealed independent switching of seven loci (ssaN, gtr, carA, dgoR, nanA, opvAB and holA) (Figure 4). Dam-dependent control of bistability can thus generate a high degree of transcriptional heterogeneity, as illustrated by the simple calculation that independent switching of n bistable loci can produce 2n types of cell variants. If this prediction is fulfilled in natural environments, independent switching of the seven loci shown in Figure 4 may be able to produce 128 types of cells. Transcription factors responsive to environmental conditions may further modulate phenotypic heterogeneity by controlling the subpopulation sizes.
Despite its relative success, our survey of the formation of phenotypic cell variants under Dam methylation control may fall short to ponder the contribution of DNA methylation to nonmutational polymorphism. After all, the identification of loci harboring undermethylated GATC sites and the analysis of their expression patterns were done under specific laboratory conditions. Furthermore, the Dam methylase is merely one example among the many DNA methyltransferases present in bacterial genomes (62,63). Undermethylated DNA methyltransferase targets are frequently detected in SMRT sequencing trials (62), thus raising the possibility that DNA methylation hindrance by transcription factors may be a common phenomenon (33). Furthermore, target undermethylation and concomitant lineage formation can be also produced by phase variation in DNA methyltransferase synthesis, a phenomenon that may be widespread among human pathogens (13–15,64). DNA methylation can thus be a powerhouse for the formation of phenotypic variants in bacterial populations, and the known examples of DNA methylation-dependent control of gene expression may be the tip of an iceberg whose magnitude remains unknown.
SUPPLEMENTARY DATA
Supplementary Data are available at NAR Online.
ACKNOWLEDGEMENTS
We thank Steve Busby and Carmen R. Beuzón for providing strains, and Ignacio Cota for helpful discussions. We are also grateful to Modesto Carballo, Laura Navarro and Cristina Reyes (Servicio de Biología, CITIUS, Universidad de Sevilla) and Alberto Álvarez (Servicio de Técnicas Aplicadas a la Biociencia, Universidad de Extremadura, Badajoz) for their efficient and friendly help with experiments performed at the facilities.
FUNDING
Ministerio de Ciencia e Innovación, Spain [BIO2016-75235-P]; European Regional Fund. Funding for open access charge: Ministerio de Ciencia e Innovación [BIO2016-75235-P].
Conflict of interest statement. None declared.

Comments