


Abstract
BEERE (Biomedical Entity Expansion, Ranking and Explorations) is a new web-based data analysis tool to help biomedical researchers characterize any input list of genes/proteins, biomedical terms or their combinations, i.e. ‘biomedical entities’, in the context of existing literature. Specifically, BEERE first aims to help users examine the credibility of known entity-to-entity associative or semantic relationships supported by database or literature references from the user input of a gene/term list. Then, it will help users uncover the relative importance of each entity—a gene or a term—within the user input by computing the ranking scores of all entities. At last, it will help users hypothesize new gene functions or genotype–phenotype associations by an interactive visual interface of constructed global entity relationship network. The output from BEERE includes: a list of the original entities matched with known relationships in databases; any expanded entities that may be generated from the analysis; the ranks and ranking scores reported with statistical significance for each entity; and an interactive graphical display of the gene or term network within data provenance annotations that link to external data sources. The web server is free and open to all users with no login requirement and can be accessed at http://discovery.informatics.uab.edu/beere/.
INTRODUCTION
Following high-throughput biology experiments, biomedical researchers frequently find themselves asking a repeated question, ‘which gene or protein should I test first among dozens or even hundreds of significant genes or proteins determined from the high-throughput biology studies?’ Meanwhile, conventional hypothesis-driven researchers, after performing literature studies of a biological research topic, may also find it challenging to follow through a comprehensive list of candidate biological concepts, including genes, diseases, drugs, phenotypic features and clinical attributes, from which they often ask, ‘which disease attribute or features should I focus my study on next?’ In this work, we are motivated by the need to address the two types of recurring questions mentioned above for biomedical researchers.
To address the first question on how to characterize a list of genes or proteins, bioinformaticians typically implement gene ranking or gene set based enrichment analysis to avoid ‘cherry-picking’ of genes for subsequent experimental validations (1). High-throughput biological studies using Genome-Wide Association Studies (GWAS) or RNA-sequencing have yielded an overwhelming amount of candidate genetic variants and candidate genes for manual examinations, thus presenting opportunities for gene prioritization analysis (2). In the past decade, there have been a limited number of web-based online gene prioritization tools such as PINTA (3), ToppGene (4), SUSPECTS (5), PROSPECTR (6) and ENDEAVOUR (7), but the majority are not web-based (8). These tools work by performing statistical characterizations of genetic linkage patterns, sequence annotations, gene co-expression patterns, protein–protein network linkage patterns or correlated pathways (9–14). In particular, with the comprehensive accumulation of scored gene-to-gene correlative relationships into knowledgebases such as the STRING database (15) and the HAPPI 2.0 database (16), network-based gene prioritization methods have been shown to have an overall high accuracy and low system-level bias, as long as the threshold may be controlled to balance between network data coverage and data quality (15). Examples of network-based gene prioritization applications include discovering disease genes for complex human genetic disorders (8), finding drug targets (17,18) and repositioning drugs (19).
Few existing web-based tools can help researchers address the second question on how to characterize a list of biomedical terms. A major bottleneck is the lack of a comprehensive biomedical term-to-term association knowledge-base until recently (20). Extracting semantic information from the biomedical literature or the clinical databases at the PubMed scale has been challenging for several reasons: a lack of standard ontology and their application to annotate all PubMed sentences (20), a lack of advanced natural language processing techniques that have been tested at scale (21), the limitation for large-scale application that impedes further data analysis (22). Furthermore, there are few available tools to help prioritize biomedical concepts across broad Unified Medical Language System (UMLS) concept categories, except for Phenolyzer that covers two categories only—‘diseases’ and ‘genes’ (23). Therefore, to perform general-purpose web-based ‘biomedical term prioritizations’, new tools must be developed to integrate advanced entity disambiguation techniques (24–27), network-based prioritization techniques and biomedical semantic relationship database repositories (20).
In this paper, we report the development of a new easy-to-use web server called Biomedical Entity Expansion, Ranking and Explorations (BEERE). BEERE aims to prioritize user-provided biomedical entities for detailed investigations of the related concepts, known associative relationships among them, supporting literature evidence, their relative significance to one another and the relationship network context in which they reside. BEERE works in two input modes: a gene input mode and a term input mode. In the gene input mode, BEERE can take the input of a list of gene symbols or gene IDs (28), retrieve annotated protein–protein interaction relationships among them with optional gene neighborhood expansions, rank the retrieved genes using entity prioritization methods and construct a gene network for user examinations of highly relevant genes and their relationships to other genes supported by literature references. In the term input mode, BEERE can take the input of a list of concept terms as words/phrases or as Concept Unique Identifiers (CUIs) (29), retrieve annotated term-to-term semantic relationships among them with optional term neighborhood expansions, rank the retrieved terms using entity prioritization methods and construct a concept term network for user examinations of highly relevant terms and their relationships to other terms supported by literature references. The two modes of BEERE search analysis may be performed independently, simultaneously or sequentially (as we show in the case study). When performed simultaneously, users with a mixture of gene and other entity terms may search at least the subset of input list containing genes only using both input modes to compare the resulting relative rank and network context information constructed from the protein–protein interaction knowledgebase (for gene input mode) and the PubMed literature (for term input mode). BEERE enables users to search for semantic relationships based on specific categories including gene–drug, gene–disease, drug–gene or drug–disease relationships, using intuitive web graphical user interfaces, tables, charts and network graphs. We expect BEERE to become a useful web server in biomedical entity network exploratory analysis and hypothesis generations.
MATERIALS AND METHODS
Entity-to-entity association data sources and pre-processing
We downloaded protein–protein interaction (PPI) data from the HAPPI 2.0 database (16), which included 2,922,202 quality-ranked PPI data from both experimental and computational platforms its 2017 release. HAPPI database is a quality-ranked comprehensive PPI repository that uses ‘H-score’—a probabilistic score between 0 and 1 to express any PPI as true and reliable (16)—control data quality versus coverage tradeoffs. In BEERE, we set the minimal quality of reported PPI data to be at the ‘3-star grade’ and above to achieve a proper balance between data coverage and quality. This filter allows us to retain ∼22% of all the downloaded PPIs.
We downloaded Subject-Predicate-Object triples called predications to represent known semantic relationships between biomedical entities from the SemMedDB version 31_R (updated on 30 June 2018) (30), which contained 19,836,578 unique predications extracted from PubMed. SemMedDB uses SemRep (31), a natural language processing engine, to scan PubMed article titles and abstracts, extract semantic information from biomedical text, and map extracted Subjects-Predictes-Objects to UMLS standard vocabularies wherever applicable. In BEERE, we quantitatively evaluate each semantic relationship between a Subject and an Object using a statistical test based on a hypergeometric distribution model. The test works by assessing the statistical significance of observing a specific count of PubMed citations that support a given Subject-to-Object pair for each Predicate category against a background distribution. We then calculate a Relation Density Score (RDS) for each Subject-to-Object relationship, based on the P-value derived from each statistical significance test performed (for details, refer to Supplementary Data). In all, 18,376,458 out of all 19,836,578 predications have a calculated RDS score > 0.
Biomedical entity identification and expansion
We downloaded standard gene symbol and gene alias information from the NCBI Gene database to resolve gene symbol entries in the gene input mode. In the term input mode, we standardize all input biomedical terms to the term dictionary compiled by the SemMedDB. However, gene name entity recognition in the SemMedDB is not always accurate, even though gene symbols and gene IDs are standardized. For example, we found that the ‘ENO1’ term (CUI = 2023) and the ‘ENO1 gene’ term (CUI = C1414402) were kept separate from each other in the SemMedDB, but they refer to the same semantic concept. Ongoing work of using both NCBI gene thesaurus and gene ontology to map and resolve gene entities is still needed. For the same reason, we are keeping the gene input mode separate from the term input mode in the current implementation of BEERE.
To map input biomedical terms to those represented in the SemMedDB term dictionary, we provide three user-selected term matching strategies: ‘exact match’, ‘substring match’ and ‘fuzzy match’. An exact match requires the user input term to match exactly an entry in the SemMedDB term dictionary. BEERE chooses this option by default. A substring match requires the user input term to match a term in the SemMedDB term dictionary using a regular expression match to the closest term by length. A fuzzy match utilizes the Levenshtein-distance (L-distance) function in the Oracle database to retrieve all candidate terms. Since the term semantics can be heavily altered by a deletion or a replacement of characters in a term, we set the penalty score of deletion or replacement to be 5, higher than the penalty score of insertion at 1. BEERE returns the term with the lowest L-distance as the best match and users have the option of overriding this by selecting more than one best match in the advanced mode.
Network data quality control
To quantitively evaluate the network’s quality before the biomedical entity ranking, BEERE introduces two metrics: index of aggregation (IOA) and seed’s coverage in the network (SCN). IOA assumes that the network possessing high quality will contain as much as connected nodes in the largest network. IOA is calculated using the number of the nodes in the largest network divided by the total input. SCN is a broad aggregation index that assumes that the higher quality network, the higher connected nodes than isolated nodes. SCN is calculated by the number of connected nodes divided by the total input.
Network-based entity prioritization
BEERE provides an initial ranking algorithm and two iterative ranking algorithms. The initial ranking algorithm applies a heuristic relevance score calculation developed in (1). The relevance score calculation is a fast evaluation of the hub nodes by involving the weighted neighborhood and it successfully ranks the top biological relevant genes in Alzheimer’s disease. The two iterative ranking algorithms, PageRank and ant-colony algorithm, are widely used in different knowledge domains with considerable successful applications. We describe the full details of PageRank, modified ant-colony algorithm and the statistical evaluation in BEERE ranking in the Supplementary Data.
Network visualization and annotation
The word-cloud visualization (https://github.com/timdream/wordcloud2.js/) of the entity ranking is implemented in BEERE. The biomedical entity font size in word-cloud is generated based on the square-root of the ranking score divided by the square root of the total entity’s number and multiplied by a scale factor. The default scale factor is set to be 40. The histogram visualization of the ranking score distribution is supported by d3.js. The bin size of the distribution is the log2-scale ranking score. The sigma.js (http://sigmajs.org/) javascript is implemented to visualize the network. The enhanced network visualization features, such as draggable nodes, hover effect, color grouping, clickable nodes and edges, and layout algorithms, are supported by the modified plugins from sigma.js adapted to BEERE.
Data provenance
Both PPI data provenance and term-to-term association data provenance are managed in BEERE. We manage PPI data provenance from both the HAPPI 2.0 database download and the PubTator (32) results. In the gene annotation, PubTator reports F1 scores as 82.97 using the GeneTUKit and 92.89 using the GenNorm. HAPPI 2.0 databases contain reference sources of all compiled PPIs, which we compiled into the BEERE web server. Pubtator applies text mining technique to process all PubMed articles (both titles and abstracts) into a gene2Pub file, while also compiled into BEERE. The 09/2018 version that we incorporated into BEERE contained 7,677,876 gene-to-PMID relationship pairs, where PMID refers to the PubMed article identifier. We manage predication data provenance directly using 96,363,098 predication-to-PMID PubMed text citations in the SemMedDB version 31_R.
Web server design and data management architecture
We developed BEERE as an integrated, searchable, knowledge-based web server. BEERE was developed using PHP5, Javascript and an open-source CodeIgniter infrastructure developed by EllisLab (https://www.codeigniter.com/). The ranking algorithms and statistical analysis in BEERE are written in python 3.0. The algorithms are optimized by parallel processing and the application programming interface (API) service is supported by Django (https://github.com/django/django). DataTables (https://datatables.net/), a plugin for jQuery is used for displaying the tables, a plugin for jQuery was used for displaying the tables. Oracle Database 12g (https://www.oracle.com/database/12g-database/) is used in the database server. The compatibility of BEERE is shown in the help session online.
RESULTS
Summary of features
The pages of BEERE consist of three components: main body, left sidebar and right sidebar. The main body returns the intermediate/final table or graphs. The left sidebar is used for displaying the parameter panel or advanced input in advanced mode, and the right sidebar is used to show additional details such as data provenance during network exploratory analysis sessions.
BEERE offers advances to the other popular web servers such as ToppGene (4), Phenolyzer (23) and Semantic MEDLINE (33), by implementing several advanced features. We summarize the contribution of BEERE with respect to algorithms, data and quality control, and the visualization shown in Table 1. Given the input of fewer than 1000 entities, BEERE will return reasonable respective interactivity within the limited time using parallel processing and the iterative ranking algorithms in BEERE capture preference of the given item versus all of the others, not just immediate neighbors. The quality control of PPI and the biomedical term-to-term relationships enable the users to expand the seed to a certain extent. The network expansion allows BEERE to increase the index of aggregation by introducing the ‘bridge’ nodes that connect to at least two seeds. Therefore, BEERE can monitor the network quality and seed’s coverage in quantitive quality control. The biomedical term and term-to-term relationships have been introduced in the BEERE, which can be a huge interest to the hypothesis-driven analysis. The network with detail information in the visualization panel provides an intuitive way for the users to grasp the critical biomedical entities. More features such as entity grouping annotation and layout algorithm options enable the users to easily observe new biomedical entity patterns in the network.
The features comparison between BEERE and other three web servers: ToppGene, Phenolyzer and Semantic Medline
| Feature | BEERE | ToppGene | Phenolyzer | Semantic MEDLINE | |
|---|---|---|---|---|---|
| Algorithm | Ranking algorithm | PageRank, ant-colony | k-step Markov, PageRank, HITS | Gene-disease score | Not mention |
| Iterative ranking | yes | yes | no | no | |
| Evaluation | Statistical model | yes | yes | no | no |
| Data and quality | Relationship quality control | yes | no | yes (factor control) | no |
| Network extension with IOA evaluation | yes | yes (neighbor distance) | no | no | |
| Biomedical term | yes | no | yes (disease) | yes | |
| Visualization | Network with provenance data | yes | yes (provide networks) | yes | yes |
| Grouping annotation | yes | no | no | no | |
Grouping annotation: The node color visualization using the annotation, e.g the genes annotated in different pathways can be visualized in the network using different colors.
Given a list of biomedical entities, BEERE provides a five-step procedure to generate the biomedical rank and visualization panels shown in the ‘Graphical abstract’.
Searching the databases with a list of terms or genes
The input page allows users to enter a gene list or a biomedical term list, and BEERE will retrieve the matched entity and relationships from the databases HAPPI 2.0 and SemMedDB respectively. We use two as examples. One is a gene list consisting of 200 glioblastoma (GBM) genetic candidates from the OMIM database. The other is a term list consisting of three different vitamins and Alzheimer’s disease. The advanced parameters setting allows users to control relationships quality. In PPI retrieval, the parameter ‘PPI confidence’ provides three PPI cutoffs ‘0.45’, ‘0.75’ and ‘0.9’ and a ‘customized cutoff’ option. Those three PPI cutoffs are equivalent to the 3-star, 4-star and 5-star PPI’s quality in the HAPPI 2.0 database. In the term-to-term relationship retrieval, users can enter a number varied from 0 to max-value of the RDS. The parameter ‘expanded’ provides the option for network one-layer expansion, which potentially increases the index of aggregation by introducing the ‘bridge’ nodes to the network. In biomedical term retrieval, the parameter ‘matching’ offers ‘fuzzy matching’, ‘substring matching’ and ‘exact matching’ options to maximize the retrieving power. The parameter ‘predicate’ provides a list of predicates for a single or multiple selections.
Verifying retrieved terms against search terms
The retrieved biomedical entity page helps the user to verify the query. In the matched entity table, the matches and mismatches are displayed for users to review and search again. In the example of a gene list, the gene matching table shows the queried gene symbols, matched gene and Seed/Expanded/none tag ‘S/E/-’. If the user’s input gene is an alias or a gene synonym, BEERE will automatically map the queried gene to HAPPI 2.0 database gene symbols. In the example of a term list using ‘substring’ matching, the table shows matches and modified matches with the lowest Levenshtein’s distance (L-distance) as the best candidates. In the advanced model, all the potential mismatches are displayed for an adjustment.
Retrieving known relationships
In the retrieved related relationships page, the relationships table shows the quality of the relationships. Reviewing the two tables, users can choose to ‘refine the table and try to match again’ or ‘process to entity prioritization’. In advanced search, users can adjust the parameters ‘iteration’, ‘sigma’ and ‘method.’ The parameter ‘iteration’ provides the recursive ranking score. The parameter ‘method’ provides the ‘page rank’ and ‘ant colony’ algorithms. The parameter ‘sigma’ provide a damping factor varying from [0,1] (default value is 0.8), which determines the probability of randomly choosing a relationship will eventually stop choosing.
Rank entities from the network
The biomedical entity prioritization page provides the table and two visualization panels. In the prioritization table, there are six parameters: ‘entity name’, ‘in-expanded network’, ‘ranking score’, ‘rank’, ‘adjust P-value’ and ‘significance’. Each row is clickable and it is linked to the entity information page. The page shows the attributes of the biomedical entity and the relationships specific to the selected entity. In the visualization panels, two graphic figures help users to intuitively view the significant entities and the ranking score distribution. The word-cloud graph deploys the highly significant biomedical entities in the center with relative larger fonts.
Visual exploration of network relationship data
The network visualization page provides an interactive graphical panel to allow users intuitively to discover the critical entities and interactions with provenance. Three layout algorithms, directed-force (default), DEMA and circular have been provided. The current view of the network can be exported as a PNG image and the network’s edge and node information can be exported as an SVG file. The left side advanced function panel offers a customized entity association input for adding the grouping information, and by clicking ‘next’ button, BEERE visualizes the color-grouped nodes in the network and shows the grouping information table below the network graph. The edges are clickable that can trigger the right side panel and show the table of entity relationship’s detail and the provenance of the relationships.
CASE STUDY
While BEERE supports user analysis with either ‘a gene list as the input’ or ‘a term list as the input’ independently, we will demonstrate a more sophisticated case study in which genes and terms are analyzed in conjunction with each other. In this case study, a user is presumably interested in exploring all candidate genes for glioblastoma (GBM), an aggressive form of brain tumor with low patient survival, to understand which genes may be worth validating experimentally and whether there are additional candidate genes not yet curated in public databases.
To prepare the BEERE web-based data analysis, a BEERE user first performs a search for disease-specific candidate genes against the NCBI-hosted OMIM database (34), which contains disease–gene curations for more than 6300 disease phenotypes and more than 4000 genes. Upon search with the term ‘glioblastoma’, the OMIM database returned 241 entries, among which 200 are gene candidates. The user then saves the gene list (‘seed genes’ or the ‘seed’) to perform a ‘gene list as the input’ query against the BEERE web server (refer to Example B on the web server to obtain this gene list). Since the user is also interested in finding new gene candidates, user can set the network expansion flag as ‘YES’, using HAPPI 2.0 PPI data with the quality filter of 0.75 (four-star ratings) and above.
After a user confirms the mapping of matched gene symbols in the BEERE’s database, BEERE shows (in step third) a list all the seed genes and network-expanded genes using the nearest neighbor network consisting of PPIs from the HAPPI 2.0 database, default PPI quality control parameters and the default gene ranking algorithm. The expanded gene network has a high IOA at 99% and seed gene coverage in the network (SCN) is 87% (Table 2). The result shows that seed gene ranking remains consistent regardless of whether there is an expanded network or not, because top-10 BEERE-ranked seed genes in the expanded network are also found in the top 10% in non-expanded network, except for PLK1 (Table 3). The entire gene rank of the expanded and non-expanded networks are shown in Supplementary Tables S1–4. The PLK1 ranks in the top due to its high connectivity to the expanded genes. About 250 out of 258 PLK’s interactors are expanded genes. Three of those expanded genes, UBC, APP and MYC, are statistically significant with P-values <0.05. Meanwhile, these genes are also reported to be ubiquitously expressed in brain (35). PLK1 is a Ser/Thr protein kinase gene belonging to the CDC5/Polo subfamily. It is highly expressed during mitosis and elevated levels of PLK1 are found in many cancers including glioblastoma (36,37). About 14 expanded genes are statistically significant at P-values ≤0.05 (Figure 1). All 14 genes except for the EGF gene, a gene with more than 384 PubMed abstract co-citations with the term ‘glioblastoma’, are also ranked by ToppGene in the top 5.5% (Table 4). Our BEERE results also highlighted the significance of performing biological entity expansions—expanding gene symbols to aliases and gene full names—to reduce false negatives.
The network quality control using different PPI cutoffs
| Expanded | Yes (0.9) | No | ||
|---|---|---|---|---|
| PPI Cutoff | 0.9 | 0.45 | 0.75 | 0.9 |
| IOA | 0.99 (1962/1984) | 0.76 (130/172) | 0.64 (110/172) | 0.52 (90/172) |
| SCN | 0.87 (150/172) | 0.78 (134/172) | 0.68 (117/172) | 0.59 (102/172) |
| Interaction | 6833 | 543 | 326 | 200 |
| Expanded | Yes (0.9) | No | ||
|---|---|---|---|---|
| PPI Cutoff | 0.9 | 0.45 | 0.75 | 0.9 |
| IOA | 0.99 (1962/1984) | 0.76 (130/172) | 0.64 (110/172) | 0.52 (90/172) |
| SCN | 0.87 (150/172) | 0.78 (134/172) | 0.68 (117/172) | 0.59 (102/172) |
| Interaction | 6833 | 543 | 326 | 200 |
IOA: Index of Aggregation, SCN: Seed's Candidate Coverage in Network
The top-10 ranked seed genes in expanded network compared to the ranks in non-expanded networks
| 5-star+Exp. | 3-star | 4-star | 5-star | |||||
|---|---|---|---|---|---|---|---|---|
| Seed Gene | Rank | P-value | Rank | P-value | Rank | P-value | Rank | P-value |
| TP53 | 1 | 0.00053 | 2 | 0.015 | 2 | 0.017 | 4 | 0.0028 |
| EGFR | 2 | 0.0011 | 4 | 0.03 | 4 | 0.034 | 5 | 0.0032 |
| PIK3R1 | 3 | 0.0016 | 5 | 0.037 | 3 | 0.026 | 2 | 0.0012 |
| AKT1 | 4 | 0.0021 | 3 | 0.022 | 6 | 0.051 | 8 | 0.0085 |
| CTNNB1 | 5 | 0.0027 | 1 | 0.0075 | 1 | 0.0085 | 1 | 0.00096 |
| PIK3CA | 6 | 0.0032 | 9 | 0.067 | 5 | 0.043 | 3 | 0.0027 |
| PLK1 | 7 | 0.0037 | 31 | 0.23 | 21 | 0.18 | 12 | 0.036 |
| RAC1 | 8 | 0.0043 | 11 | 0.082 | 10 | 0.085 | 6 | 0.0053 |
| RB1 | 9 | 0.0048 | 10 | 0.075 | 9 | 0.077 | 7 | 0.0065 |
| CCND1 | 10 | 0.0053 | 7 | 0.052 | 7 | 0.06 | 11 | 0.019 |
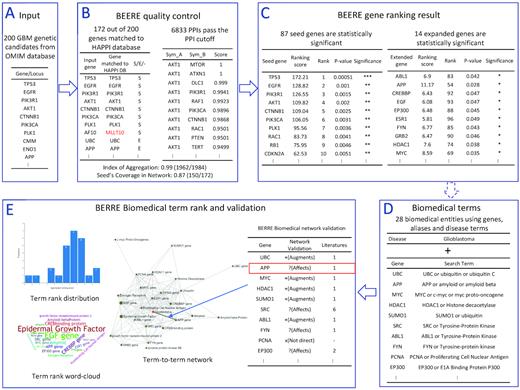
The pipeline overview of the conjunction analysis in glioblastoma (GBM) genetic candidate’s discovery. In the first part, BEERE offers a ranked order list of critical seed and expanded genes with statistical significance using the expanded network analysis. (A) The input is the 200 genetic candidate genes downloaded from OMIM databases. (B) In BEERE quality control, BEERE automatically maps the queried genes to HAPPI database gene symbols. By verifying the 172 genes matched to HAPPI database, BEERE returns 6833 PPIs passing the PPI cutoff. The network quality is good that Index of Aggregation = 0.99 and Seed’s Coverage in Network = 0.87. (C) BEERE generates the gene ranks. About 87 seed genes are statistically significant and 14 expanded genes are statistically significant. In the second part, BEERE reveals the critical mechanisms using comprehensive term mapping, heterogeneous network analysis, and term ranking. (D) About 28 biomedical entities using genes, aliases and disease terms are the input of the network meta-analysis. (E) The term ranking score distribution and term rank word-cloud intuitively show the important entities such as epidermal growth factors, amyloid genes, ubiquitin genes and tyrosine genes are tightly related to glioblastoma. The provenance of the gene to glioblastoma relationship is displayed on the selected edge such as APP affects glioblastoma with one literature support. The PMID and a link to outsource are displayed by clicking the entry with the detail of the relationships.
The expanded genes validation using the PubMed article term-to-term co-citations and network semantic relationship validation
| Gene | Search term | BEERE Top rank | P-value | ToppGene rank | ToppGene Normalized rank | PubMed Initial count | PubMed Extended count | Network validation | Literatures | PMID |
|---|---|---|---|---|---|---|---|---|---|---|
| UBC | UBC or ubiquitin or ubiquitin C | 1 (33) | 0.017 | 116 | 32 | 0 | 137 | Augments | 1 | 27766591 |
| APP | APP or amyloid or amyloid beta | 2 (54) | 0.028 | 1 | 1 | 23 | 61 | Affects | 1 | 15302999 |
| MYC | MYC or c-myc or myc proto-oncogene | 3 (69) | 0.035 | 17 | 5 | 300 | 300 | Augments | 1 | 26993778 |
| HDAC1 | HDAC1 or Histone decacetylase | 4 (74) | 0.038 | 46 | 13 | 12 | 12 | Augments | 1 | 27766591 |
| SUMO1 | SUMO1 or ubiquitin | 5 (75) | 0.038 | 373 | 102 | 3 | 138 | Augments | 1 | 27766591 |
| SRC | SRC or Tyrosine-Protein Kinase | 6 (76) | 0.039 | 31 | 9 | 165 | 167 | Affects | 6 | 3146045|15994925|15618223|20947248|19098899|25048528 |
| ABL1 | ABL1 or Tyrosine-Protein Kinase | 7 (83) | 0.042 | 142 | 39 | 4 | 10 | Augments | 1 | 23383209 |
| FYN | FYN or Tyrosine-protein kinase | 8 (85) | 0.043 | 93 | 26 | 17 | 23 | Affects | 1 | 15994925 |
| PCNA | PCNA or Proliferating Cell Nuclear Antigen | 9 (87) | 0.044 | 166 | 45 | 93 | 108 | Indirectly affect | - | - |
| EP300 | EP300 or E1A Binding Protein P300 | 10 (88) | 0.045 | 52 | 15 | 3 | 5 | Affects | 2 | 21489305|26722247 |
| GRB2 | GRB2 or Growth Factor Receptor Bound Protein | 11 (90) | 0.046 | 22 | 6 | 14 | 14 | Indirectly affect | - | - |
| CREBBP | CREBBP or CREB Binding Protein | 12 (92) | 0.047 | 83 | 23 | 1 | 4 | Indirectly affect | - | - |
| EGF | EGF or Epidermal Growth Factor | 13 (93) | 0.047 | 5146 | 1395 | 384 | 1419 | Produces | 1 | 3011820 |
| ESR1 | ESR1 or Estrogen Receptor 1 | 14 (96) | 0.049 | 34 | 10 | 5 | 6 | Produces | 1 | 20841389 |
To investigate whether the ‘new’ candidate genes discovered from BEERE gene-based analysis is valid, a user may continue the web-based analysis by switching to BEERE term-based analysis section, using terms including ‘glioblastoma’ and each of the 14 new candidate genes. After term expansion and ranking, BEERE helps users to construct a network in the last analysis step (step fifth) to allow users’ visual exploration of the heterogeneous biomedical entity-to-entity interaction network, which consists of both disease terms and gene symbols. BEERE-generated semantic predications help users to validate co-cited gene-to-disease pairs (Table 4) given the options of SemMed V30 and ‘fuzzy matching'. BEERE-generated ranks of the biomedical terms reveal that the epidermal growth factors, amyloid genes, ubiquitin genes and tyrosine genes are tightly related to glioblastoma. Further, exploring each candidate gene’s mechanisms of actions in glioblastoma shows that 11 out of 14 genes have a direct effect on glioblastoma. Among them, five genes (UBC, MYC, HDAC1, SUMO1 and ABL1) augment glioblastoma; four genes (APP, SRC, FYN and EP300) are associated with glioblastoma; a gene (EGF) and an estrogen receptor (ESR1) produce the glioblastoma (38,39). All the above relationships can be explored within the network visually and shown in the detailed HTML tables next to the network graph on the web server to reveal underlying PubMed articles referred by the predications. Interestingly, among the three genes (CREBBP, PCNA, ESR1) without direct relationships found within SemMedDB extracted predications, each gene connects to six (for CREBBP), seven (for PCNA) and six (for ESR1) existing genes, respectively. This suggests strong candidacy for these genes were investigated further for their molecular mechanism links to glioblastoma.
Furthermore, we believe the case study above demonstrated that BEERE not only as a tool for gene-based or term-based network expansion, ranking and exploration tools separately, but also as an iterative analysis platform for users who switch between biomedical entity relationship explorations and phenotypically significant gene network explorations. For example, having obtained the above results, a user may enter into ‘gene-based’ analysis again, using 200 previously OMIM-curated genes and 14 newly discovered candidate genes, to explore a gene-to-gene association network without network expansions. Such ranking may shed additional light on the relative significance of all candidate genes. Networks using disease, genes and drugs may also be expanded, ranked and explored iteratively from within the BEERE tool subsequently.
DISCUSSION
BEERE is a new web-based data analysis tool to help biomedical researchers characterize any input list of genes/proteins, biomedical terms, or their combinations against databases containing gene-to-gene relationships and semantic term-to-term relationships. We developed BEERE first to help users examine whether there is credible biological evidence of gene-to-gene associative relationships or term-to-term semantic relationships within the user input of a gene/term list. This is an important first step towards the interpretation of high-throughput Omics sequencing data or manually curated biological entities for hypothesis-driven research. Moreover, using the entire collection of biomedical entity-to-entity relationship pairs, we demonstrated that BEERE can help users uncover the inherent relative importance of each entity within the list, allow users to visually explore constructed global entity relationship network and assist users with examining different types of relationship pairs to trace back biomedical entity relationships of interest to the original cited PubMed articles. We demonstrated that BEERE could accelerate biomedical mechanistic studies downstream of Omics analysis or initial curation with its current set of features when proper parameters are set correctly. We envision biological users of BEERE could use the entity expansion, ranking and exploration features iteratively to examine gene-to-gene, gene-to-disease, gene-to-drug, gene-to-risk factors, and many types of biomedical entity relationships for their research. With ongoing database update and database coverage expansion to include additional contents from sources such as gene sets and gene signatures, e.g., PAGER (40) and GeneSigDB (41), we expect BEERE to become a useful web service for the biomedical research community.
SUPPLEMENTARY DATA
Supplementary Data are available at NAR Online.
FUNDING
University of Alabama at Birmingham (UAB) Informatics Institute; UAB Academic Enrichment Fund (to J.C.); Center for Clinical and Translational Science of the University of Alabama at Birmingham [1TL1TR001418–01 to J.C.]; National Center for the Advancement of Translational Science (NCATS); National Cancer Institute [U01CA223976 to J.C., C.D.W., A.B.H.)]. Source of open access charge: University of Alabama at Birmingham (UAB) Informatics Institute; UAB Academic Enrichment Fund (to J.C.); Center for Clinical and Translational Science of the University of Alabama at Birmingham [1TL1TR001418–01 to J.C.]; National Center for the Advancement of Translational Science (NCATS); National Cancer Institute [U01CA223976 to J.C., C.D.W., A.B.H.)].
Conflict of interest statement. None declared.

Comments