


Abstract
Guanine-rich DNA strands can fold into non-canonical four-stranded secondary structures named G-quadruplexes (G4). Experimental evidences suggest that G4-DNA surrounding transcription start sites act as cis-regulatory elements by either stimulating or inhibiting gene transcription. Therefore, proteins able to target and regulate specific G4 formation/unfolding are crucial for G4-mediated transcriptional control. Here we present data revealing that CNBP acts in vitro as a G4-unfolding protein over a tetramolecular G4 formed by the TG4T oligonucleotide, as well as over the G4 folded in the promoters of several oncogenes. CNBP depletion in cellulo led to a reduction in the transcription of endogenous KRAS, suggesting a regulatory role of CNBP in relieving the transcriptional abrogation due to G4 formation. CNBP activity was also assayed over the evolutionary conserved G4 enhancing the transcription of NOGGIN (NOG) developmental gene. CNBP unfolded in vitro NOG G4 and experiments performed in cellulo and in vivo in developing zebrafish showed a repressive role of CNBP on the transcription of this gene by G4 unwinding. Our results shed light on the mechanisms underlying CNBP way of action, as well as reinforce the notion about the existence and function of G4s in whole living organisms.
INTRODUCTION
Guanine rich single-stranded DNA may fold in vitro into G-quadruplex (G4) structures (1). The widely used canonical G3+N1-7G3+N1-7G3+N1-7G3+ putative G4 sequence (PQS) folds into an intramolecular secondary structure formed of at least three layers of G tetrads interconnected by loops and stabilized by Hoogsteen hydrogen bonds and monovalent cations chelation (mainly potassium) (2). Other PQSs including shorter G tracts, longer loops and bulges within G-tracts have also been described (3). Bioinformatic analyses of the human genome identified around 376 000 PQSs (1). Besides, a high-throughput sequencing method identified further ∼450 000 previously uncharacterized non-canonical long loop and bulged G4 structures (4). A significant body of work has also shown that PQSs are not randomly distributed throughout the genome, but tend to cluster in specific regions. PQSs are rare in protein coding regions but enriched in other noncoding functional regions of chromosomes such as telomeric regions, somatic copy number alterations related to cancer development, 5′ UTRs, splicing sites and the promoter regions of various genes (4). Interestingly, PQSs are enriched within the promoters of human oncogenes while under-represented in the promoters of housekeeping and tumor suppressor genes (4,5). In addition, evolutionarily conserved PQSs are significantly enriched in genes related to developmental biological processes (6). The existence of G4-DNA was proved in vivo in telomeres of Stylonychia lemnae (7–9) and in cellulo in the genome of mammalian cells (10). Evidences regarding the role in vivo of G4 in the transcriptional regulation of developmental genes in zebrafish embryos has been also recently reported (6).
The formation of G4 may be related with a variety of genetic disorders, hereditary diseases and cancer through favoring genome instability and modulating gene expression (11). Therefore, regulation mechanisms of G4s formation and unfolding are required to restrict their roles to specific regulatory processes in the cells. Various helicases have been identified unwinding G4 structure apparently playing specific roles in particular cellular processes (12,13). Consequently, an increasing number of different human genetic disorders have been associated with mutations in G4-resolvases (11).
CCHC-type zinc finger nucleic acid binding protein gene (CNBP), also referred as zinc finger protein 9 gene (ZNF9), encodes the highly conserved nucleic acid chaperone named cellular nucleic acid binding protein (CNBP) (14,15). CNBP is a nuclear-cytoplasmic protein (16–19) that preferentially binds to G-enriched RNA or DNA single-stranded sequences showing high score of G4 folding (20–23). CNBP is involved in proper organization of the zebrafish, chick and mouse forebrain (14). Both up and down regulation of CNBP adversely affect the formation and survival of a subpopulation of cranial neural crest cells, leading to a reduction in size and even loss of selected pharyngeal and craniofacial cartilaginous structures (14,24,25). Many years ago, CNBP was reported to enhance the transcription of human c-MYC (26) through binding to its promoter sequence; however, the mechanistic details of this process remain still unclear. It was reported that CNBP binds to the G-rich sequence of the c-MYC nuclease hypersensitive element (NHE) III1 and promotes the formation of G4 in vitro (16,27). These data are difficult to conciliate with the notion that G4 abrogates c-MYC transcription (28). CNBP was also reported to bind and stabilize the G4 in the promoter of heterogeneous ribonucleoprotein K (hnRNP K), resulting in transcription downregulation (29,30). On the other hand, CNBP has been recently reported to boost global translation by resolving G4 structures in the 5′ UTRs of mRNAs (23) and to regulate translation of ribosomal proteins in Cryptococcus neoformans through unwinding G4s located in the corresponding 3′ UTRs (31). These results suggest that CNBP is a component of a eukaryotic mechanism that prevents G4s formation. This new scenario questions the formerly reported G4-DNA -promoting activity of CNBP and encouraged us to study more deeply the CNBP way of action.
Rational in vitro studies carried out in this work reveal that CNBP unfolds G4-DNA structures in an adenosine triphosphate (ATP)-independent fashion. Experiments performed in HeLa cells and in vivo using zebrafish developing embryos suggest a role of CNBP in the transcriptional regulation of c-MYC and KRAS oncogenes and the NOG/nog3 developmental gene mediated by G4-unfolding. Our results also get insight into the mechanisms underlying G4s folding/unfolding in cells and whole multicellular organisms.
MATERIALS AND METHODS
Oligonucleotides and siRNAs
Synthetic single-stranded oligodeoxyribonucleotides (Supplementary Table S1) were purchased from Invitrogen, dissolved in bidistilled water and stored at −20°C until use. Concentrations were determined by spectrophotometry using extinction coefficients provided by the manufacturer. Radioactively 32P-5′-end-labeled oligonucleotides were desalted and separated from the remaining radioactively labeled ATP by gel-filtration chromatography (Bio-Spin 6 Columns, BIO-RAD). siRNAs (Supplementary Table S1) were purchased from Eurofins, dissolved in bidistilled water and stored at −20°C until use.
Recombinant expression and purification of tag-free human CNBP
The pET-32a-TEV-CNBP plasmid construction was performed as described in Supplementary Materials and Methods. Tag-free human and zebrafish CNBP purifications were done following the guidelines detailed elsewhere (32). Recombinant human CNBP (Supplementary Figure S1) was obtained in CNBP buffer (50 mM Tris–HCl pH 7.5; 300 mM NaCl; 1 mM DTT, 5 mM Imidazole and 0.1 mM ZnCl2) at ∼50 mg per liter of culture in a concentration of ∼1 mg/ml. CNBP buffer was used in several in vitro assays as a control.
Circular dichroism (CD) spectroscopy
Intramolecular G4s were folded by dissolving 2 μM DNA oligonucleotides in 10 mM Tris–HCl pH 7.5 and different KCl concentration, as indicated, heating for 5 min at 95°C and slowly cooling to 20°C. (TG4T)4 was formed by heating TG4T strand (8 mM) at 95°C in 10 mM Tris–HCl pH 7.5 and 100 mM KCl for 5 min and then slowly cooling to 20°C. Then, (TG4T)4 was diluted to 2 μM into 10 mM Tris–HCl pH 7.5 without adding KCl (0.1 mM final KCl concentration). Prior to CD spectroscopy, CNBP or bovine serum albumin (BSA) dissolved in CNBP buffer were added to the pre-folded G4 and incubated at 37°C for 30 min. CD spectra were recorded and analyzed as described elsewhere (6). Melting temperatures (Tm) were estimated according to Rachwal and Fox (33). Briefly, the normalized ellipticity expressed as percentage folded ((CD20°C-CDT)/(CD20°C-CD80°C)*100) was plotted versus temperature. CDT corresponds to the ellipticity value obtained at each temperature, CD20°C to the initial ellipticity value obtained at 20°C and CD80°C to the final ellipticity value obtained at 80°C. A nonlinear regression fitting (Sigmoidal, 3 Parameter) was used to estimate Tm, which represents the temperature corresponding to the mid-point of the melting curves at which the G4 is 50% folded. The shown spectra and melting curves are representative of at least three repeats with the same results.
Unwinding PAGE assay
Unwinding polyacrylamide gel electrophoresis (PAGE) assays were performed introducing some modifications to previously published protocols (34). Briefly, (TG4T)4 was formed as detailed for CD spectroscopy. Then, (TG4T)4 was 32P-5′-end-labeled, run in 20% (p/v) PAGE containing 25 mM KCl, eluted from the gel overnight in 10 mM Tris–HCl pH 7.5, 100 mM KCl buffer at 4°C, precipitated with 0.3 M KAc and 70% ethanol and finally resuspended in 10 mM Tris–HCl pH 7.5. Assays were carried out in reactions of 20 μl containing 20 mM Tris–HCl pH 7.5, 5 mM MgCl2, 2% (v/v) glycerol, 0.1 μg/μl BSA, 1 mM dithiothreitol (DTT), 0.125 pmol 32P-labeled (TG4T)4 and incubated in the absence or in the presence of increasing concentrations of CNBP for 30 min at 37°C. Two mM ATP was added in some reactions, as indicated. Reactions were stopped by adding 25 mM ethylenediaminetetraacetic acid pH 8.0, 0.5 (p/v) sodium dodecyl sulphate, 2 mg/ml proteinase K and incubating for 10 min at 37°C. At last, reactions were resolved in native 20% PAGE in 0.5× Tris/Borate/EDTA (TBE) buffer. Gels were exposed to a Storage Phosphor Screen (GE Healthcare) and scanned on a Typhoon FLA 7000 (GE) Scanner.
Nuclear magnetic resonance (NMR) 1D 1H
(TG4T)4 samples (20 μM) were diluted in CNBP buffer in the absence or in the presence of increasing CNBP molar equivalents. (TG4T)4 and CNBP were pre-incubated at 37°C for 30 min to allow G4:protein interactions before nuclear magnetic resonance (NMR) acquisitions. Control experiments with only (TG4T)4 in the presence of CNBP buffer were recorded for each titration point. NMR spectra were acquired at 20°C on a 700MHz Bruker Avance III spectrometer, using a triple resonance inverse NMR probe (5mm 1H/D-13C/15N TXI) equipped with z-axis self-shielded gradient coils. 1D 1H spectra were acquired using a pulse sequence with selective excitation in the spectral region of imino protons (selzg, from the Bruker library). For this purpose, we applied a square pulse of 0.004 watt for 1 ms centered at 11.5 ppm. Water suppression was performed by adding a standard pre-saturation pulse during the 1 s starting delay. Acquisition parameters were 8K (1H) complex points for a sweep width of 16 ppm and 1280 scans. NMR spectra were zero-filled to 32K points and processed by apodization with an exponential window function multiplication (LB 5 Hz). Baseline correction was applied between 10 and 12 ppm. All experiments were registered, processed and analyzed using Topspin (Bruker Biospin).
Electrophoretic mobility shift assay (EMSA)
Electrophoretic mobility shift assays (EMSAs) were performed as described previously (15). Labeled probes were used at a final concentration of approximately 2 nM. NaCl was omitted from the binding solution, and 100 mM KCl or LiCl were added, depending on the folding condition of the probe, as indicated. Apparent dissociation constants (Kd) representing the CNBP concentration that shifts 50% of the probe were estimated as described in Supplementary Figure S2.
Polymerase stop assay (PSA)
Polymerase stop assays (PSAs) were performed as described previously (16) introducing some modifications. LiCl or KCl were added to the reaction media for primer annealing and template folding, as indicated. Relative amounts of stop products (SP) and full-length products (FLP) were quantified from radioactive bands, and the FLP/SP ratios were normalized to the ratio obtained in the controls in presence of KCl and absence of CNBP to obtain relative FLP/SP ratios.
Cell lines and cell culture
Human cell lines were grown in Dulbecco's-modified Eagle's medium (DMEM) media (Fisher Scientific) supplemented with 10% fetal bovine serum, 125 U/ml penicillin and 125 μg/ml streptomycin at 37°C under 5% CO2 in a humidified atmosphere. HeLa CNBP-KDInd cells carry an inducible shRNA against human CNBP targeting the same sequence as siRNA-CNBP2 (Supplementary Table S1). HeLa CNBP-eGFP cells stably express the CNBP protein fused to enhanced green fluorescent protein (eGFP) and were maintained in DMEM media supplemented with 1 μg/ml puromycin. Constructions of HeLa CNBP-KDInd and HeLa CNBP-eGFP cell lines are detailed in Supplementary Materials and Methods.
Cell transfection and induction
HeLa cells (250 000 cells plated on 6-well plates 24 h prior to transfection) were transfected with 0.5 μM of specific siRNAs (Supplementary Table S1) and 5 μl of LipofectamineRNAiMAX Reagent (Invitrogen) in 200 μl of Opti-MEM media (Fisher Scientific) following manufacturer's instructions. Transfection was repeated after 24 h using the same protocol. Transfected HeLa cells were recovered at 48 h post-transfection (hpt), plated in 10 cm Petri dishes for additional 24 h and then used for RNA and protein extraction at 72 hpt. HeLa CNBP-KDInd cells (100 000 cells plated in 10 cm Petri dishes) were induced with doxycycline (5 μg/ml) for 6 days, and then used for RNA and protein extraction.
RNA extraction and RT-qPCR analyses
Cultured cells were recovered by trypsinization, washed with phosphate buffer saline (PBS) and the cell pellets used for total RNA extraction using the RNeasy Plus Mini kit (Qiagen). Real time quantitative polymerase chain reactions (RT-qPCR) were performed with 20 ng of total RNA and specific primers (Supplementary Table S1) using the iTaq Universal SYBR Green one-step kit and the CFX96 Real Time PCR detection system (Bio-Rad). Relative mRNA levels were determined by the ΔΔCt quantification method using the CFX Maestro software (Bio-Rad). GAPDH and HPRT mRNA levels were used as internal controls. RNA extraction from zebrafish larvae at 54 hours post-fertilization (hpf) followed by RT-qPCR were performed as described previously (35). Technical triplicates for each experimental condition were performed. The validity of the RTqPCR data was assured by following the MIQE guidelines (36).
Chromatin immuno-precipitation (ChIP)
Chromatin immuno-precipitation (ChIP) assays were performed using the Magnetic ChIP-IT Express Kit (Active Motif) following manufacturer's instructions. Thirty μg of DNA were incubated with 5 μg of anti-GFP antibody (Abcam ab290), 2 or 10 μg of purified rabbit anti-CNBP antibody (raised against recombinant purified untagged human CNBP by the facility of Laboratorio de Endocrinología y Tumores Hormonodependientes, Facultad de Bioquímica y Ciencias Biológicas, Universidad Nacional del Litoral) or 5 μg of rabbit IgG control antibody (Diagenode) overnight at 4°C. Immunoprecipitated DNA was recovered following manufacturer's instructions (Active Motif), purified using Qiaquick Nucleotide removal kit (Qiagen) and resuspended in a final volume of 100 μl. A total of 2 μl of isolated DNA were subjected to PCR or qPCR amplification using specific oligonucleotides (Supplementary Table S1) to amplify selected promoter regions. For qPCR SsoFast EvaGreen Supermix (Bio-Rad) was used. ChIP-qPCR data were normalized to Input DNA to calculate the percentage of chromatin recovered by immunoprecipitation and to IgG control signals to evaluate the specific binding to target regions expressed as fold enrichment.
Immunodetection of G4
G4-DNA foci were immunodetected using BG4 antibody (10). Briefly, induced and not induced HeLa CNBP-KDInd cells were seeded in 24-wells plate at 50 000 cells/well on glass coverslips. Forty-eight hours later, cells were fixed with paraformaldehyde 2% in PBS (10 min room temperature), washed with PBS and permeabilized for 15 min at room temperature with 10 mM Tris–HCl pH 7.5, 120 mM KCl, 20 mM NaCl, 0.1% Triton-X 100. Then, cells were washed with PBS and incubated for 1 h at 37°C in blocking buffer (20 mM Tris–HCl pH 7.5, 150 mM NaCl, 2% BSA, 0.2% fish gelatin, 0.1% Triton-X 100) containing 0.1 μg/μl of RNAse A prior to incubation with BG4 antibody (Ab00174-1.1, Absolute Antibody) at 250 ng/μl in blocking buffer overnight at 4°C. Cells were then washed with PBS-Tween 20 0.1% and incubated with anti-mouse Alexa 488 antibody (A11001, Invitrogen) diluted 1/500 in blocking buffer for 1 h at room temperature. At last, cells were washed with PBS-Tween 0.1% and stained with DAPI, and coverslips were mounted with Vectashield mounting medium (Vector Laboratories). Nuclear BG4 foci overlapping with DAPI staining were quantified with ImageJ software.
Zebrafish husbandry and microinjection
Animal handling during this study was carried out in strict accordance with relevant local, national and international guidelines. Protocols were approved by the Committee on the Ethics of Animal Experiments of the Universidad Nacional de Rosario (Expedient N° 6060/202; Resolution N° 425/2014). Adult zebrafish were maintained at 28°C on a 14 h light/10 h dark cycle. One-cell embryos were injected with 2–4 nl of 250 ng/μl of capped-mRNA coding eGFP or zebrafish Cnbp fused to eGFP (zCnbp-eGFP) in KCl 100 mM, and larvae were raised up to 54 hpf at 28°C to perform RT-qPCR or western blot. eGFP and zCnbp-eGFP capped-mRNA were synthesized using plasmids coding eGFP or zCnbp fused to eGFP cloned in pCS2+ plasmid (21,35) using SP6 mESSAGE mACHINE kit (Ambion) and following the manufacturer's instructions.
RESULTS
CNBP favors the unfolding of (TG4T)4in vitro
Results previously reported suggest that CNBP promotes the formation of G4s controlling transcription (16,27,29,30) but unfolds G4s governing translation (23,31). To solve this apparent discrepancy, several experiments were performed for assessing the role of CNBP on G4s using the well-characterized all-parallel-tetramolecular G4 model (TG4T)4. (TG4T)4 is a G4 formed by four TGGGGT DNA strands that was chosen as model for three main reasons: (i) the absence of interferences or unspecific effects due to G4-flanking or loops sequences; (ii) (TG4T)4 folds in Xenopus oocytes with a similar conformation than that found in vitro in the presence of K+ (37), (iii) (TG4T)4 unfolding or melting is kinetically irreversible at micromolar range concentrations (TG4T re-association is undetectable below 30 μM strand concentration) (38), making it an ideal model to study G4-protein interactions. Recombinant purified untagged human CNBP (Supplementary Figure S1) was used in all the assays performed in vitro. First, CD spectra were carried out in the absence or in the presence of CNBP, observing a reduction of (TG4T)4-specific ellipticity peaks (mainly the positive peak at ∼260 nm) at a 3:1 CNBP:(TG4T)4 molar ratio (Figure 1A). Melting temperature monitored by ellipticity at 260 nm decreased by ∼7°C in the presence of CNBP (Figure 1B). CNBP unspecific effect was ruled out, since the presence of BSA did not affect either (TG4T)4 CD spectra or melting temperature. As CD behavior suggested a helicase activity for CNBP, unwinding PAGE assays using 32P-labeled (TG4T)4 were carried out in the absence or presence of ATP in the reaction media. Increasing amount of CNBP led to a decrease in 32P-labeled (TG4T)4 signal regardless the presence of ATP (Figure 1C), suggesting an ATP-independent CNBP G4-unwinding capability. 1D 1H NMR was performed to detect the previously assigned and well characterized four imino protons peaks (G2–G5 in Figure 1D) specific for the all-parallel (TG4T)4 conformation (39) since their intensities are indicative of the integrity of (TG4T)4 G4 structure. Nearby low intensity peaks (indicated by arrowheads in Figure 1D) correspond to a previously described minor conformer formed in presence of K+ (39). The presence of CNBP caused a reduction in imino protons peaks intensities in a CNBP:G4 molar ratio-dependent behavior (Figure 1D and Supplementary Figure S3). The preferential reduction of the signals corresponding to guanines G3 and G4 at low CNBP:G4 molar ratios (1:1 and 1.5:1) suggests that these bases are the first to be bound and/or destabilized by CNBP. Detection of a new set of peaks centered at 11.12 and 11.45 ppm (indicated by asterisks in Figure 1D) probably reflects the formation of a CNBP-catalyzed G4 intermediate species. (TG4T)4-specific 1D 1H NMR peaks were barely undetectable at the highest CNBP:G4 molar ratio tested (3:1), suggesting that CNBP unfolded the G4 structure. The reduction of 1D 1H NMR imino protons peaks could be attributed to the formation of a slow tumbling high molecular weight complex with CNBP. Nevertheless, EMSA performed using (TG4T)4 and CNBP did not evidence shifted bands (Supplementary Figure S2A), even at CNBP concentrations two orders of magnitude above the Kd obtained for the CNBP consensus binding sequence (C14, Supplementary Figure S2B). Data suggest that CNBP do not stably bind to (TG4T)4 nor to TG4T strands. Results gathered so far indicate that CNBP promotes the ATP-independent unfolding of a generic tetramolecular parallel-stranded G4-DNA, regardless the presence of flanking or loops sequences.
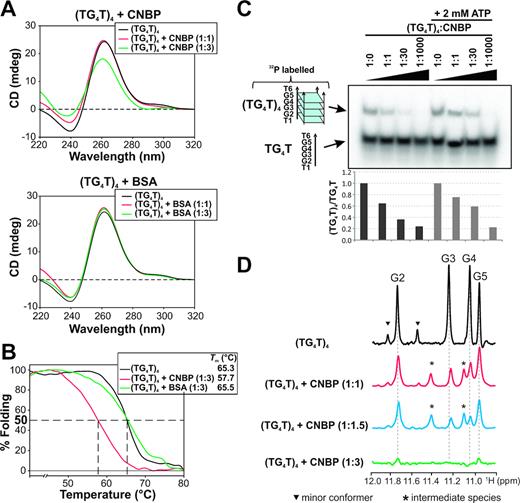
CNBP unfolds the tetramolecular G4 (TG4T)4. (A) Top: CD spectra obtained for 2 μM (TG4T)4 incubated in the absence of protein or in the presence of increasing CNBP molar ratios. Bottom: CD spectra obtained for 2 μM (TG4T)4 incubated for 30 min at 37°C in the absence of protein or in the presence of increasing BSA molar ratios. (B) CD melting curves obtained for (TG4T)4 incubated in the absence of protein or in the presence of 6 μM (1:3 molar ratio) CNBP or BSA. Estimated melting temperatures (Tm) are informed in the inset. (C) Top: Representative unwinding PAGE assay (n = 3) of the 32P-labeled (TG4T)4 incubated in the absence of protein or in the presence of increasing CNBP molar ratios. Results obtained in the absence of ATP are shown at the left and results obtained in the presence of 2 mM ATP are shown at the right. Bottom: histogram representing relative (TG4T)4/TG4T ratio of the bands in the unwinding PAGE assay. (D) 1D 1H NMR spectra obtained for (TG4T)4 incubated in the absence of protein or in the presence of increasing CNBP molar ratios. Peaks corresponding to imino protons of guanines 2, 3, 4 and 5 are labeled as G2, G3, G4 and G5, respectively. Peaks corresponding to a minor conformer formed under these experimental conditions are indicated with arrowheads (▾), and peaks corresponding to intermediate species are indicated with asterisks (*).
CNBP unfolds in vitro the G4 formed in the NHE III1 element of c-MYC promoter
As CNBP unfolds (TG4T)4, we evaluated in deep CNBP activity on the parallel G4 formed in the NHE III1 of c-MYC promoter. The 18-nucleotide sequence of the c-MYC NHE III1 (hereafter Pu18, Supplementary Table S1) comprising the four G-tracts involved in the biologically relevant G4 structure of this regulatory element (40) was used for CD, PSA and EMSA approaches. The presence of CNBP at a 3:1 molar ratio in respect of Pu18 reduced the G4-specific ellipticity peaks (mainly the positive peak at ∼260 nm) in CD spectra (Figure 2A). Melting temperature monitored by CD-ellipticity at 260 nm was reduced by ∼7°C in the presence of CNBP (Figure 2B). Increasing concentrations of CNBP in PSAs favored the formation of full-length product (FLP) at the expense of the stop-product (SP) (Figure 2C; left panel), producing a significant increase of the relative FLP/SP ratio (Figure 2C, right panel). EMSAs performed with 32P-labeled Pu18 probe in the presence of K+ (folded as G4) or in the presence of Li+ (unfolded) showed that CNBP bound to unfolded Pu18 with higher affinity (lower apparent Kd) than to the Pu18-G4 (Figure 2D; Supplementary Figures S4 and S8F). Apparent Kd values obtained when using CNBP consensus binding sequence (C14, Supplementary Table S1) as probe were similar either in the presence of K+ or Li+, thus ruling out direct influence of the cation nature on CNBP nucleic acid binding capability (Supplementary Figure S2B). The apparent Kd values obtained here for the human CNBP were of the same order of magnitude than the one reported for the zebrafish CNBP (zCnbp) binding to the same sequence (21). This finding denotes the existence of evolutionary conserved biochemical properties of zebrafish and human CNBPs, as expected for their high amino-acid sequence similarity (41).
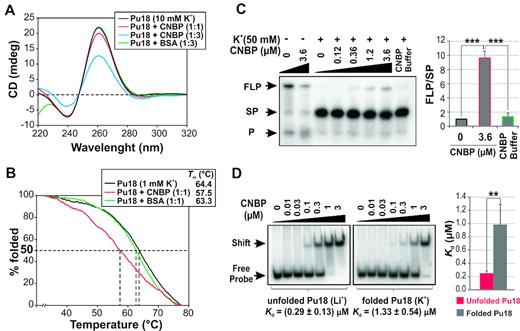
CNBP unfolds the G4 formed in the NHE III1 of c-MYC promoter. (A) CD spectra obtained for 2 μM Pu18 oligonucleotide folded as G4 in the presence of 10 mM K+ and incubated in the absence of protein or in the presence of increasing CNBP molar ratios or BSA in the maximum molar ratio. (B) CD melting curves obtained for Pu18 oligonucleotide folded as G4 with 1 mM K+ and incubated in the absence of protein or in the presence of CNBP or BSA. The estimated melting temperatures (Tm) for each curve are informed in the inset. (C) Left: autoradiography of a representative PSA performed with the template containing Pu18 sequence folded in the presence or absence of 50 mM K+ and then incubated in the absence of protein, in the presence of increasing concentrations of CNBP or in the presence of CNBP buffer. Right: histogram representing relative FLP/SP (mean ± SD) of three independent experiments. ***P< 0.001, ANOVA, n = 3. FLP, full-length product; SP, stop product; P, labeled primer. (D) Left: EMSAs performed using 32P-labeled Pu18 probe folded in the presence of Li+ 100 mM (unfolded, left) or K+ 100 mM (folded, right) and then incubated in the absence or in the presence of increasing concentrations of CNBP. Free and shifted probes are indicated by arrows at the left of the gels. Apparent Kd for each condition were estimated (Supplementary Figure S4) and are indicated below the gels. Right: histogram representing apparent Kd (mean ± SD) for three independent experiments. **P< 0.01, t-student, n = 3. Values of apparent Kd means are informed in Supplementary Figure S8F.
Results described above contrast with previous evidences showing that CNBP promotes the formation of G4 in the NHE III1 element of c-MYC promoter (16,27). Therefore, we performed CD spectra reproducing the formerly reported experimental conditions (16,27), but using tag-free human CNBP instead of His6-human CNBP (27) or GST-Chaunus arenarum CNBP (16) recombinant proteins. CNBP did not promote in vitro the formation of G4s in any of the experimental conditions tested; even more, the presence of CNBP favored G4 unfolding in most of them (Supplementary Figure S5). Discrepancies with previous studies could probably be explained by the presence of His6 tag or differences in the composition of culture media used for protein expression, in the composition of buffers used for protein purification, and/or in differences in buffers and cations used for G4s folding and in vitro assays.
In vitro results presented so far collectively suggest that CNBP indeed unfolds the G4 formed by the G-rich sequence present in the NHE III1 element of c-MYC promoter. This finding indicates that CNBP could enhance human c-MYC transcription by relieving the transcriptional repression due to G4 formation.
CNBP unfolds in vitro G4s that control the transcription of several oncogenes
Next, we explored the possibility that CNBP targets sequences capable of forming G4s in the promoters of oncogenes other than c-MYC. For this purpose, the presence of the reported CNBP DNA-consensus binding sequence (CNBP-CBS) (21) was analyzed in silico within the 1000 pb upstream the transcriptional start sites (proximal promoter regions or PPRs) of c-KIT, KRAS, PDGF, RET and VEGF oncogenes. Several putative CNBP-CBS overlapping with PQSs reported as transcriptional regulatory elements (42–46) were found (Supplementary Figure S6A and B).
The in vitro activity of CNBP on these G4s was assessed by CD, PSAs and EMSAs as described above. CD spectra showed a reduction in the parallel G4-specific ellipticity peaks (mainly positive ≈ 260 nm) when CNBP was added to the pre-folded G4s. A CNBP:G4 molar ratio of 1:1 was enough to unfold G4s present in PPRs of c-KIT, KRAS and RET. In a similar fashion than c-MYC, a 3:1 molar ratio was required to unfold G4s present in PPRs of PDGF and VEGF (Figure 3A). Differences in stoichiometry may be due to differences in G4s intrinsic stabilities as a consequence of different base compositions and/or lengths of loops (47) and tetrads number (48). A significant increase (ranging from ∼2- to 7-fold) of the PSAs relative FLP/SP ratios was observed by the presence of CNBP in all tested cases (Figure 3B and Supplementary Figure S7). EMSAs revealed that CNBP bound to the unfolded PQSs of PDGF, RET and VEGF with affinities significantly higher than to the G4-folded sequences (Figure 3C and Supplementary Figure S8A–F). Experimental evidences demonstrate that CNBP binds and unfolds in vitro the parallel G4s formed not only in c-MYC promoter but also in the PPRs of c-KIT, KRAS, PDGF, RET and VEGF. Therefore, it is tempting to speculate that CNBP enhance c-KIT, KRAS, PDGF, RET and VEGF transcription through G4s unfolding, in a similar manner to that suggested for c-MYC.
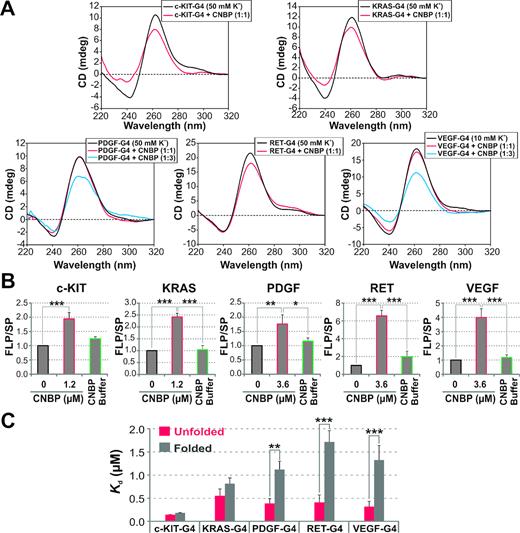
CNBP unfolds the G4s present in the PPRs of oncogenes other than c-MYC. (A) CD spectra obtained for 2 μM c-KIT-G4, KRAS-G4, PDGF-G4, RET-G4 and VEGF-G4 oligonucleotides (Supplementary Table S1) folded as G4 in the presence of the indicated K+ concentration and incubated in the absence of protein or in the presence of CNBP (1:1 molar ratio). In the case of PDGF-G4 and VEGF-G4, CNBP was also tested at 1:3 molar ratio. (B) Histograms representing the relative FLP/SP ratio (mean ± SD) of three independent PSAs. G4-templates were folded in the presence of 50 mM K+ and then incubated in the absence of protein, in the presence of 1.2 μM (in the case of c-KIT and KRAS) or 3.6 μM (in the case of PDGF, RET and VEGF) CNBP or in the presence of CNBP buffer. *P< 0,05, **P< 0.01, ***P< 0.001, ANOVA, n = 3. FLP, full-length product; SP, stop product. (C) Histograms representing the apparent Kd (mean ± SD) estimated as shown in Supplementary Figure S8A–E of three independent EMSAs performed using 32P-labeled c-KIT-G4, KRAS-G4, PDGF-G4, RET-G4 and VEGF-G4 probes folded in the presence of Li+ 100 mM (unfolded probe) or K+ 100 mM (folded probe), which were then incubated in the absence or presence of increasing concentrations of CNBP. **P< 0.01, ***P< 0.001, t-student, n = 3. Values of apparent Kd are informed in Supplementary Figure S8F.
CNBP depletion in human cells leads to KRAS transcriptional downregulation
CNBP activity on c-MYC transcription has been usually tested by transfecting cell lines with constructs containing diverse reporter genes controlled by different c-MYC promoter fragments and varying CNBP levels (26,27,49,50). Following a similar approach, we co-transfected HeLa cells with a construct allowing the overexpression of CNBP along with a construct containing the sequence coding for the firefly luciferase reporter gene controlled by either an 850 pb fragment of the c-MYC promoter (pGL3b-Del4) or a mutant version that abolishes G4 formation (pGL3b-Del4-M). Luciferase activity measurements confirmed that c-MYC G4 acts as a transcriptional repressor (Supplementary Figure S9A) and revealed that CNBP enhances the transcription of c-MYC in a dose-dependent manner (Supplementary Figure S9B). No differences were detected when the pGL3b-Del4-M construct was assessed (Supplementary Figure S9B), suggesting that CNBP enhances c-MYC expression through G4 unfolding.
To challenge this result on endogenous c-MYC and other oncogenes in cellulo, CNBP was transiently knocked-down in HeLa cell line by using two different siRNAs against CNBP mRNA (siRNA-CNBP1 and siRNA-CNBP2, Supplementary Table S1). Both siRNAs were effective in knocking down CNBP transcription. Compared to control siRNA (siRNA-CTRL), CNBP mRNA levels were reduced to ∼15% with siRNA-CNBP1 and to 5% when siRNA-CNBP2 was used (Figure 4A). Levels of CNBP protein were undetectable by western blot in cells treated with either of the two siRNAs (Supplementary Figure S10A). HeLa cells expressed low levels of c-KIT, RET and VEGF transcripts thus impairing further transcriptional expression analyses for these genes. PDGF and c-MYC mRNA levels measured at 72 hpt did not significantly change in CNBP silenced cells (Figure 4A). Endogenous c-MYC transcriptional levels similar to controls had also been reported in CNBP-depleted HeLa cells at 60 hpt (27). To further assess the role of CNBP on c-MYC transcriptional control, a stable inducible CNBP knock-down was generated in HeLa cell line (HeLa CNBP-KDInd, Supplementary Materials and Methods). A reduction in CNBP mRNA levels (to ∼30% in respect of not induced control cells) did not cause significant changes in c-MYC mRNA levels (Figure 4B and Supplementary Figure S10B). ChIP assay performed using a stable HeLa cell line expressing CNBP fused to eGFP (HeLa CNBP-eGFP) and anti-GFP antibody followed by qPCR showed a significant enrichment (∼9-fold) of c-MYC region comprising NHE III1 in respect of the IgG ChIP control. The promoter region of GAPDH was not enriched in CNBP-eGFP ChIP assays, indicating that enrichment of c-MYC promoter was specific. Results confirmed the in cellulo CNBP specific binding to the c-MYC PPR (Figure 4C), in agreement with previous work (27). As reported for the endogenous CNBP in HeLa cells (17), CNBP-eGFP was located in both the cytoplasm and the nuclei of HeLa cells (Supplementary Figure S11A).
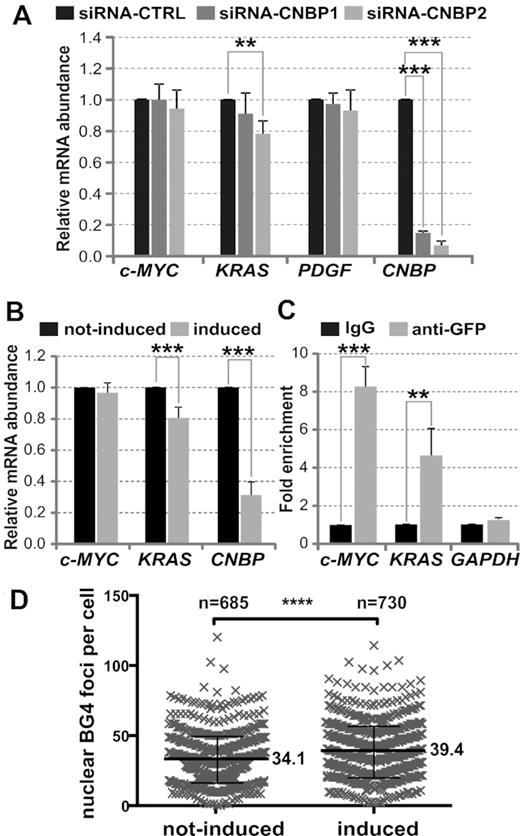
In cellulo effect of CNBP depletion on c-MYC, PDGF and KRAS transcriptional expression. (A) Relative abundance of c-MYC, KRAS, PDGF and CNBP mRNA measured by RT-qPCR in HeLa cells transfected with a control siRNA (siRNA-CTRL) and two different siRNAs (siRNA-CNBP1 and siRNA-CNBP2) that specifically target CNBP mRNA. (B) Relative abundance of c-MYC, KRAS and CNBP mRNA measured by RT-qPCR in not-induced and induced HeLa CNBP-KDInd cells. (C) Fold enrichment corresponding to the ChIP assay performed on HeLa CNBP-eGFP cells using anti-GFP antibody in respect of IgG antibody control. Immunoprecipitated chromatin was amplified by qPCR for specifically analyzing the binding of CNBP to the c-MYC and KRAS PPRs containing the analyzed PQSs, and to the GAPDH PPR as a control of a gene not regulated by CNBP. In all cases, bars represent the mean ± SD of three independent experiments. **P< 0.01, ***P< 0.001, t-Student test, n = 3. (D) Column scatter plots representing the numbers of nuclear BG4 foci detected per cell in not-induced and induced HeLa CNBP-KDInd cells (Supplementary Figure S13A). Results show the pooled data from two independent experiments including two or three technical replicates (Supplementary Figure S13B). Mean values are indicated for each group. ****P< 0.0001, Mann–Whitney test.
Remarkably, a significant decrease of KRAS mRNA levels to ≈ 80% in respect of controls was detected in both transient (Figure 4A) and stable (Figure 4B) CNBP knock-down HeLa cells. The KRAS mRNA half-life was unaffected by CNBP knock-down, thus ruling out post-transcriptional effects (Supplementary Figure S12A and B). ChIP assay performed using HeLa CNBP-eGFP cell line and anti-GFP antibody showed a specific and significant fold enrichment (∼5-fold) of KRAS PPR region containing the PQS, indicating that CNBP specifically binds in cellulo to KRAS promoter (Figure 4C). These results suggest that CNBP is a trans-acting factor involved in KRAS transcriptional regulation.
Noteworthy, G4 detection by means of specific BG4 antibody revealed a small but significant signal increase in the number of nuclear G4 foci (∼16%) detected in HeLa CNBP-KDInd (Figure 4D and Supplementary Figure S13). Thereby, it is tempting to speculate that the G4 unfolding activity of CNBP affects other target genes beyond those ones analyzed in this work.
CNBP regulates the transcription of NOGGIN/noggin3 through G4 unfolding
In silico analyses revealed that PQSs present in the PPRs of c-MYC, KRAS and other oncogenes are exclusive of humans (not shown), thus limiting the study of their biological functions to in cellulo approaches. However, it has been recently shown that the PPR of NOGGIN (NOG) contains an evolutionary conserved G4 able to enhance in vivo the transcription of noggin3 (nog3; the orthologous of human NOG in zebrafish) (6). NOG is one of the numerous genes required for proper chondrogenesis, process by which mesenchymal cells differentiate into chondrocytes. This developmental protein inhibits chondrogenesis by preventing condensation and differentiation of mesenchymal cells (51). Experimental evidences suggest that CNBP is required for proper craniofacial development (14,25). Cnbp loss-of-function in developing zebrafish adversely affects the formation and survival of craniofacial cartilaginous structures not only by controlling the ratio of cell proliferation and apoptosis but also by defining skeletogenic neural crest cell fate (24). These evidences led us to assess the role of CNBP in the G4-mediated NOG/nog3 transcriptional regulation.
In silico analysis revealed the presence of several putative CNBP-CBS in NOG and nog3 PPRs overlapping with PQSs reported as transcriptional regulatory elements (6) (Supplementary Figure S6C). The activity of CNBP on NOG and nog3 PQSs (hNOG-G4 and zNOG-G4, respectively, Supplementary Table S1) was analyzed in vitro by CD, PSAs and EMSAs. CD spectra showed a reduction in the G4-specific ellipticity peaks (mainly positive ∼260 nm) when CNBP was added to pre-folded G4s using a CNBP:G4 molar ratio of 1:1 (Figure 5A). In a similar fashion, zCnbp led to a reduction in the CD spectra of nog3 G4 (Supplementary Figure S14A). PSAs showed a significant increase of the relative FLP/SP ratio in the presence of CNBP for both cases (Figure 5B and Supplementary Figure S14B). EMSAs evidenced that CNBP bound to the unfolded PQSs with higher affinities than to G4-folded sequences (Figure 5C and Supplementary Figure S14C). Data demonstrate that CNBP binds and unfolds in vitro the G4s formed in NOG/nog3 PPRs in a similar way as described above for G4s present in the PPRs of oncogenes.
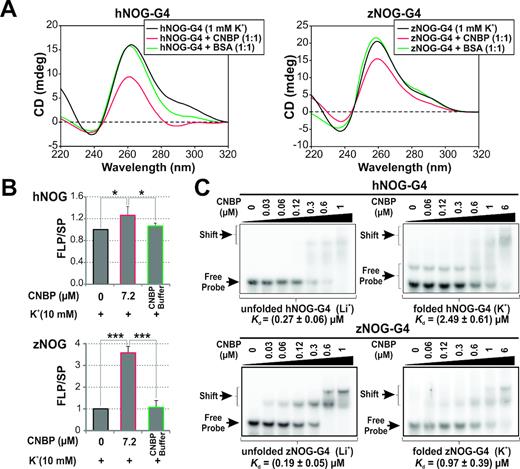
CNBP unfolds the G4s present in the PPRs of human NOG and zebrafish nog3 genes. (A) CD spectra obtained for 2 μM hNOG-G4 and zNOG-G4 folded as G4 in the presence of 1 mM K+ and incubated in the absence of protein or in the presence of CNBP (1:1 molar ratio) or BSA. (B) Histograms representing the relative FLP/SP ratio (mean ± SD) of three independent PSAs. Templates containing hNOG-G4 and zNOG-G4 were folded in the presence of 10 mM K+ and then incubated in the absence of protein, in the presence of 7.2 μM of CNBP or in the presence of CNBP buffer. *P< 0,05, ***P< 0.001, ANOVA, n = 3. FLP, full-length product; SP, stop product. (C) Representative EMSAs (n = 3) performed using 32P-labeled hNOG-G4 and zNOG-G4 probes folded in the presence of Li+ 100 mM (unfolded, left) or K+ 100 mM (folded, right) and then incubated in the absence or in the presence of increasing concentrations of CNBP. Free and shifted probes are indicated by arrows at the left of the gels. Apparent Kd values for each condition were estimated as shown in Supplementary Figure S14C and are indicated below the gels. The folded hNOG-G4 probe presents a minority band of lower mobility probably due to a self-assembled dimeric intermolecular G4.
G4s formed in NOG and nog3 PPRs enhance transcription (6). Therefore, we assessed the role of CNBP on NOG/nog3 transcription both in cellulo and in vivo. Significant increase of NOG mRNA levels of ∼60 and ∼80% were observed as a consequence of transient (Figure 6A) and stable (Figure 6B) CNBP knock-down in HeLa cells, respectively. Changes in NOG mRNA levels were not due to effects on NOG mRNA decay kinetics (Supplementary Figure S12C). Direct binding of CNBP to the PQS in NOG PPR was demonstrated by ChIP assays using anti-CNBP antibody followed by PCR analysis (Figure 6C, left panel). ChIP assays using the stable CNBP-eGFP HeLa cell line and anti-GFP antibody followed by qPCR showed a specific and significant ∼12-fold enrichment of NOG PPR containing the PQS in respect of IgG control (Figure 6C, right panel). On the other hand, the effect of CNBP on nog3 transcription was assessed in vivo by overexpressing zebrafish Cnbp fused to eGFP (zCnbp-eGFP) during zebrafish embryonic development. One-cell staged zebrafish embryos were microinjected with eGFP mRNA (controls) or zCnbp-eGFP mRNA. Green fluorescent specimens were raised up until 54 hpf and cnbp and nog3 mRNA levels were measured by RT-qPCR. Confocal microscopy of living embryos expressing zCnbp-eGFP showed that CNBP is mainly cytoplasmic at developmental stages before the mid-blastula transition (MBT, 512-cell stage or 2.75 hpf). However, CNBP was also detected into the nuclei after the onset of the zygotic transcription (Supplementary Figure S11B), agreeing with previous data showing that both zCnbp-eGFP and endogenous zCnbp shift to the nuclei of embryonic cells after the MBT has started (25,41). Overexpression of cnbp at 54 hpf-staged larvae was ∼20% in respect of controls (Figure 6D and Supplementary Figure S10C) likely due to zCnbp-eGFP mRNA decay along development. Indeed, cnbp overexpression of ∼50% was measured in 24 hpf-staged embryos when similar zCnbp-eGFP mRNA microinjection experiments were carried out (35). Nevertheless, zygotic nog3 expression just starts at 24 hpf (6) making difficult the assessment of differential expression by RT-qPCR at this developmental stage. Nog3 expression reaches its maximum at ≈ 72 hpf (6); thereby, 54 hpf was chosen as a proper developmental stage to assess the effect of CNBP overexpression on nog3 transcriptional expression. In agreement with data gathered in cellulo, zCnbp-eGFP overexpression in developing zebrafish specimens caused a significant reduction of nog3 mRNA levels of ≈ 35% in respect of controls (Figure 6D). Overall, results suggest that CNBP downregulates the transcriptional expression of human NOG in cellulo and zebrafish nog3 in vivo, likely by unfolding G4 structures formed within their PPRs.
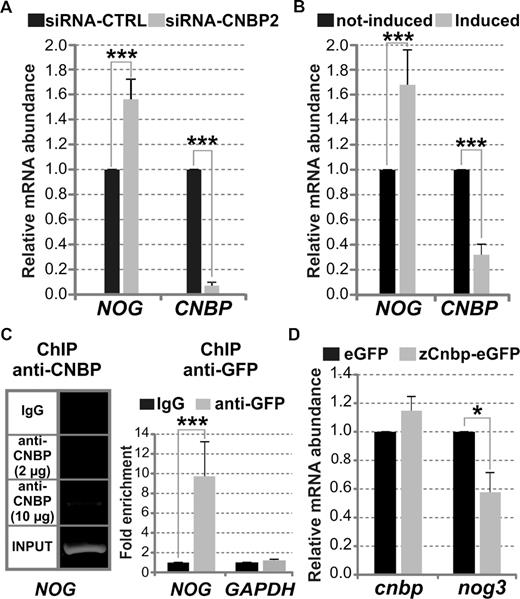
CNBP affects the transcriptional expression of NOG in cellulo and nog3 in vivo. (A) Relative abundance of NOG and CNBP mRNA measured by RT-qPCR in HeLa cells transfected with a control siRNA (siRNA-CTRL) and siRNA-CNBP2 that specifically targets CNBP mRNA. (B) Relative abundance of NOG and CNBP mRNA measured by RT-qPCR in not-induced and induced HeLa CNBP-KDInd cells. (C) Left: ChIP assay performed on HeLa cells using two amounts of anti-CNBP antibody (2 and 10 μg) and IgG antibody as a control. Immunoprecipitated chromatin was amplified by PCR for specifically analyzing the binding of CNBP to the NOG-PPR containing the analyzed PQSs. INPUT corresponds to PCR performed on total genomic DNA. Right: Fold enrichment corresponding to the ChIP assay performed on HeLa CNBP-eGFP cells using anti-GFP antibody in respect of IgG antibody control. Immunoprecipitated chromatin was amplified by qPCR for specifically analyzing the binding of CNBP to the NOG-PPR containing the analyzed PQS, and to the GAPDH PPR as a control of a gene not regulated by CNBP. (D) Relative abundance of cnbp and nog3 mRNA measured by RT-qPCR using total RNA prepared from 54 hpf-staged larvae microinjected with zCnbp-eGFP mRNA or eGFP mRNA (controls). In all cases, bars represent the mean ± SD of three independent experiments. *P< 0.05, ***P< 0.001, t-Student test, n = 3.
It should be noted that G4 structures are proposed to enhance NOG/nog3 transcription while to repress c-MYC and KRAS expression. Accordingly, the CNBP G4-unfolding activity led to opposite effects enhancing c-MYC and KRAS and repressing NOG/nog3 transcription.
DISCUSSION
By using different spectroscopic biophysical (CD and NMR) and biochemical approaches (PSAs, EMSAs and unwinding PAGE assays) we have gathered substantial evidences indicating that CNBP promotes the unfolding of G4-DNA secondary structures. CNBP primary structure agrees with its function over G4 motifs. CNBP contains seven tandem cysteine-cysteine-histidine-cysteine (CCHC) zinc-knuckle repeats and a glycine/arginine-rich region in the linker joining the first and second CCHC zinc knuckles highly similar to the arginine-glycine-glycine (RGG) box (14). CCHC found in CNBP are remarkably similar to those found in the human immunodeficiency virus type 1 nucleocapsid protein (HIV1-NCp) involved in G4 binding and unfolding (52). Additionally, R/G-rich region has been reported as an RNA binding motif involved in G4 recognition and resolution (53), and has recently been defined as a novel interesting quadruplex interacting (NIQI) motif shared among G4 binding proteins (54).
At least two different thermodynamically and kinetically driven mechanisms of action may explain the CNBP G4-unfolding activity. One of them is supported by data gathered studying intramolecular G4s formed in the PPRs of certain oncogenes and of the NOG/nog3 genes. These data suggest that, in a similar fashion than some telomere binding proteins (55), CNBP promote G4s unfolding by shifting the G4—single-stranded equilibrium towards the unfolded state through preferentially binding to the unfolded sequence, thus avoiding G4 re-folding (Supplementary Figure S15, blue arrow). The second CNBP way of action is supported by the finding that CNBP promotes the unfolding of the tetramolecular (TG4T)4, but does not stably bind to the TG4T strand. Thereby, CNBP could unfold the G4 core structure by destabilizing the central tetrads, thus driving to intermediate species prior to the full G4 disassembly. In contrast to (TG4T)4, the biologically relevant intramolecular G4s assayed in this work contain unpaired flanking sequences and interconnecting loops of variable length and base composition. Therefore, CNBP action over G4s in gene contexts may involve the preferential binding to the unfolded single stranded DNA of G4s loops/flanking sequences, the unfolding of the G4-core and the prevention of G4 refolding by stably binding to the unfolded G-rich sequence (Supplementary Figure S15, green arrow). Indeed, CNBP interaction with loops/flanking sequences could account for the differences in CNBP concentration required for the unfolding of the different assessed G4s. As observed from CD, PSA and EMSA data, G4 presenting the higher intrinsic stabilities required higher CNBP concentrations to be unfolded and had the lowest protein binding affinities (Supplementary Table S2). Importantly, both mechanisms may not be mutually exclusive and may cooperate to achieve appropriate G4-unfolding activity on intramolecular G4s.
All G4-helicases reported so far use the energy of ATP hydrolysis to resolve the G4 structure (12); however, CNBP unwinds G4s in an ATP-independently manner. Consequently, CNBP should be grouped with other nucleic acid chaperones that unfold G4s independently of ATP, such as hnRNP A, described as participating in KRAS transcriptional control and several other processes concerning G4s, or Replication Protein A (RPA), involved in DNA replication, repair and recombination (12,55).
High levels of CNBP have been associated with cell proliferation and survival control (49), but the molecular bases of this behavior remain unclear. c-MYC has been largely reported as a target of CNBP regulation and is a paradigmatic case of G4-mediated transcriptional control. Despite results obtained here did not show a transcriptional control of endogenous c-MYC encoded in genomic DNA, this regulation was evident when using a plasmid encoding a reporter gene controlled by an 850 bp-region of the c-MYC promoter that comprises the PQS. Differences between the results from experiments using reporter genes controlled by c-MYC promoter fragments and experiments assaying the transcription of endogenous c-MYC may be consequence of the complexity of c-MYC promoter (56). The use of fragments of such a complex promoter could lead to the loss of control elements acting in cis together with NHE III1 in the c-MYC transcriptional regulation. Moreover, we found that CNBP enhances in cellulo the transcription of the endogenous KRAS oncogene, in agreement with effects of CNBP observed in vitro over sequences representing the PQS found in KRAS PPR. KRAS PPR contains an NHE essential for transcription regulation. This region comprises a G-rich strand able to fold as G4, which was reported as responsible for gene silencing (43,57). The hnRNP A1 unfolds the KRAS-G4 facilitating the pairing of the NHE strands into the duplex, thereby favoring transcription activation (58). Recently, high mobility group box protein 1 (HMGB1) has been reported to stabilize the KRAS-G4 acting as a transcriptional repressor (59). Therefore, CNBP may be a trans-acting factor involved in KRAS transcriptional regulation cooperating with hnRNP A1 and/or antagonizing with HMGB1. Mutations in KRAS occur in 75–90% of in pancreatic ductal adenocarcinoma (PDAC, OMIM # 260350), representing the most frequent, as well as the earliest, genetic alteration leading to constitutive activation of downstream signaling pathways that are important for tumor initiation, development and spread (60). On the other hand, CNBP has been classified as a gene related with cancer and diseases in the Human Protein Atlas (61) and was found as an unfavorable prognostic marker in PDAC (62). Considering these facts, it is tempting to speculate about a role of CNBP in PDAC through G4-mediated transcriptional activation of KRAS. Collectively, data lead us to speculate that CNBP favors cell proliferation and survival, and perhaps cancer development, through a general mechanism of action over certain oncogenes which transcription is repressed by the folding of G4s in their promoters.
The best documented biological function assigned to CNBP is the participation in the development of embryonic neurocranium (14,24,25,63). Despite the role of CNBP in embryonic development has been reported several years ago, the molecular mechanisms underlying the role of CNBP in rostral development remain unclear. In cellulo and in vivo experiments carried out in this work have demonstrated that CNBP represses the expression of NOG/nog3 most likely through the unfolding of G4 structures reported as transcriptional enhancers (6). Bearing in mind that c-MYC and NOG are genes involved in neural crest formation and craniofacial development (51,64,65), it is tempting to speculate that the role of CNBP in embryonic development is sustained, at least in part, by its capability to unfold G4 structures.
The role of G4 structures on transcription could be either stimulatory (acting as DNA binding sites for regulatory factors or favoring transcription re-initiation) or inhibitory (acting as barriers or disrupting a double-stranded binding site) (66). Here we report that the CNBP G4-unfolding activity may lead to opposite effects on the transcription of genes depending on the role of G4. Indeed, our results show that CNBP stimulates c-MYC and KRAS while represses NOG/nog3 transcription. Whatever the final effect, CNBP seems to play a critical role in the cellular machinery involved in G4s unfolding needed for proper gene transcription. In addition, results showing an increase of nuclear G4s in cells depleted of CNBP suggest that this CNBP activity may affect other target genes beyond those ones analyzed in this work. Besides, the cytoplasmic location of CNBP, along with its role in G4-RNA-mediated translational control (23,31), suggest that CNBP is involved in the control of both transcription (by binding to ssDNA and unfolding G4-DNAs in the nuclei) and translation (by binding to RNA and unfolding G4-RNAs in the cytosol).
At last, data presented here add novel evidences regarding the existence and function of G4s in whole-living systems, increasing the knowledge about the biological function G4s unfolding proteins and the mechanisms underlying the regulation of genes expression through G4 structures.
SUPPLEMENTARY DATA
Supplementary Data are available at NAR Online.
ACKNOWLEDGEMENTS
pBABE-puro vector was a gift from Hartmut Land & Jay Morgenstern & Bob Weinberg (Addgene plasmid # 1764). HEK-293T cells, pCMV ΔR8.91 (packaging plasmid) and pCMVsVg (envelope plasmid) were kindly provided by E. Gilson. We are thankful to Sebastian Graziati for excellent fish husbandry and Christine Delteil for Confocal microscopy images.
FUNDING
Agencia Nacional de Promoción Científica y Tecnológica [PICT 2014-0741, PICT 2017-0976 to P.A., PICT 2016-0671 to N.B.C.]; Consejo Nacional de Investigaciones Científicas y Técnicas [2015-0170 to N.B.C.]; ECOS Sud-MinCyT [A15B02 to N.B.C.]; Universidad Nacional de Rosario [BIO322 to P.A.]; ECOS Sud-CNRS [A15B02 to P.C.]; l’Agence National de la Recherche [16-CE11-0006 G4 TopI-Pro to D.G.]; Institut de Pharmacologie et Biologie Structurale IPBS [Internal Collaborative Funding to P.C.].
Conflict of interest statement. None declared.

Comments