


Abstract
A sub-lethal hydrostatic pressure (HP) shock of ∼100 MPa elicits a RecA-dependent DNA damage (SOS) response in Escherichia coli K-12, despite the fact that pressure cannot compromise the covalent integrity of DNA. Prior screens for HP resistance identified Mrr (Methylated adenine Recognition and Restriction), a Type IV restriction endonuclease (REase), as instigator for this enigmatic HP-induced SOS response. Type IV REases tend to target modified DNA sites, and E. coli Mrr activity was previously shown to be elicited by expression of the foreign M.HhaII Type II methytransferase (MTase), as well. Here we measured the concentration and stoichiometry of a functional GFP-Mrr fusion protein using in vivo fluorescence fluctuation microscopy. Our results demonstrate that Mrr is a tetramer in unstressed cells, but shifts to a dimer after HP shock or co-expression with M.HhaII. Based on the differences in reversibility of tetramer dissociation observed for wild-type GFP-Mrr and a catalytic mutant upon HP shock compared to M.HhaII expression, we propose a model by which (i) HP triggers Mrr activity by directly pushing inactive Mrr tetramers to dissociate into active Mrr dimers, while (ii) M.HhaII triggers Mrr activity by creating high affinity target sites on the chromosome, which pull the equilibrium from inactive tetrameric Mrr toward active dimer.
INTRODUCTION
The Mrr (Methylated adenine Recognition and Restriction) protein of Escherichia coli K-12 is a laterally acquired Type IV restriction endonuclease (REase) with specificity for methylated DNA (1,2). Contrary to Type I-III REases, Type IV enzymes are not found in conjunction with their cognate methyltransferases (MTases) (3). Typically, MTases modify the bacterial chromosome at specific sequences to protect it from cleavage by the cognate REase. Such restriction modification (RM) systems constitute a primitive immune system for bacteria to protect against phage infection or lateral acquisition of foreign DNA, since the latter lack the proper protective methylation signature (4). Type IV REases, on the other hand, recognize and cleave modified DNA (5). Indeed, while genotoxic Mrr activity in E. coli K-12 was originally discovered to be elicited upon the heterologous expression of foreign methyltransferases (MTases) such as the Type II M.HhaII methyltransferase from Haemophilus haemolyticus (6), it was recently demonstrated that Mrr could be activated as well, by the expression of Type III MTases (Mod proteins) acquired from E. coli ED1A and Salmonella Typhimurium LT2 (6). To date, the sequences of the target sites for Mrr binding and cleavage have not been established.
Surprisingly, it was documented previously as well, that a sub-lethal hydrostatic pressure shock (HP∼100 MPa for ∼15 min) is also able to trigger Mrr-dependent DNA damage in its E. coli K-12 (strain MG1655) host (7,8). While Mrr can harmlessly be expressed in cells under atmospheric conditions, fluorescence microscopy has shown that its activation by HP causes nucleoid condensation and concomitant confinement of nucleoid associated Mrr proteins (9). HP activation of Mrr triggers a RecA-dependent SOS response, underscoring that active Mrr causes double strand breaks in the host nucleoid (8). Furthermore, HP/Mrr-mediated activation of the SOS response was shown to result in typical SOS-mediated phenotypes such as prophage activation and SulA-mediated filamentous growth after pressure release (8,10–12).
Here, we sought to determine the molecular mechanisms of the HP shock-induced activation of Mrr and how it differs from that of MTase-mediated activation. More specifically, we determined the localization, absolute concentration and stoichiometry of Mrr fused with a green fluorescent protein (GFPmut2) in live E. coli cells before and after HP or M.HhaII exposure using a quantitative fluorescence fluctuation microscopy approach called scanning Number and Brightness (sN&B) (13). Our results reveal that Mrr is tetrameric in unstressed cells, but dissociates into a dimer after HP shock or co-expression with M.HhaII. We suggest that, given the well-documented ability of pressure to dissociate protein oligomers (14), the activation of Mrr by HP shock results from direct dissociation of the inactive tetramer to an active dimer which recognizes and cleaves the E. coli chromosome at cryptic, low affinity sites. In contrast to this HP pushing model, we also propose that expression of the MTase leads to the creation of numerous high affinity methylated sites on the chromosome, pulling the Mrr DNA binding equilibrium toward the active, dimeric, bound form, which then cleaves the DNA. These models provide a detailed example of understanding the multiple and varied molecular mechanisms underlying the response and adaptation of living organisms to pressure.
MATERIALS AND METHODS
Strains and construction of mutants
Escherichia coli K-12 MG1655 was used as parental strain (15), and a summary of all the strains and plasmids used in this study is provided in Table 1. The various GFP-Mrr expressing MG1655 derivatives were constructed by scarless λ-red based recombineering (16). Briefly, the MG1655 chromosomal mrr locus was first replaced by a tetA-sacB cassette (yielding MG1655 Δmrr::tetA-sacB) obtained from a polymerase chain reaction (PCR) amplicon (using primers 5΄-TAGTGCTATAGTAGCCGAAAAACATCTACCTGATTCTGCAAG GATGTACTTCCTAATTTTTGTTGACACTCTATC-3΄ and 5΄-AAGGGGTTATGGGCCGGATAAGGCGC AGCCGCATCCGGCCTGATATTTCAATCAAAGGGAAAACTGTCCATATGC-3΄ on genomic DNA of E. coli T-Sack (17)), after which this tetA-SacB cassette was replaced by the gfp-mrr construct of interest using Tet/SacB counter-selection media (17). For construction of the E. coli MG1655 Pmrr-gfp::mrr strain, chromosomally expressing the GFP-Mrr fusion protein from the native mrr promoter, the chromosomal Δmrr::tetA-sacB allele was replaced with the gfp::mrr allele obtained from a PCR amplicon prepared on the pBAD-gfp::mrr vector ((9); using primers 5΄-ATTTTTGTAGTGCTATAGTAG CCGAAAAACATCTACCTGATTCTGCAAGGATGTACTATGAGTAAAGGAGAAGAAC-3΄ and 5΄-CGAT AAGCTTG CGTTTGCGGGGTTGAGG -3΄). For construction of the E. coli K12 MG1655 PBAD-gfp::mrr strain, chromosomally expressing the GFP-Mrr fusion protein from an arabinose inducible promoter, the chromosomal Δmrr::tetA-sacB allele was replaced with the PBAD-gfp::mrr allele obtained from a PCR amplicon prepared on the pBAD-gfp::mrr vector (9) (using primers 5΄-ATTTTTGTAGTGCTAT AGTAGCCGAAAAACATCTACCTGATTCTGCAAGGATGTACTTTATGAC AACTTGACGGCTA-3΄ and 5΄-CGATAAGCTTGCGTTTGCGGGGTTGAGG-3΄). For construction of the E. coli K12 MG1655 PBAD-gfp-mrr strain, chromosomally co-expressing GFP and Mrr as separate proteins from a bicistronic mRNA driven by an arabinose inducible promoter, the chromosomal Δmrr::tetA-sacB allele was replaced with the PBAD-gfp-mrr allele obtained from a PCR amplicon prepared on the pBAD-gfp-mrr vector (9) using primers 5΄-ATTTTTGTAGTGCTATAGTAGCCGAAAAACATCTACCTGATTCTGC AAGGATGTACTTTATGACAACTTGACGGCTA-3΄ and 5΄-CGATAAGCTTGCGTTTGCGGGGTTGAG G-3΄).
E. coli K12 MG1655 strains used for this work
| Strain | Chromosomal and-or plasmid | Produces | Growth conditions |
|---|---|---|---|
| E. coli MG1655 | |||
| E. coli MG1655 mrr::Kn PBAD-gfp-mrr | Plasmid | Free GFP and unlabeled Mrr | Induction arabinose 0.002% |
| E. coli MG1655 PBAD-gfp-mrr | Chromosomal | Free GFP and unlabeled Mrr | Induction arabinose 0.4% |
| E. coli MG1655 PBAD-gfp-mrr + pTrc99A empty | Chromosomal + empty plasmid | Free GFP and unlabeled Mrr | Induction arabinose 0.4% and IPTG 1 mM |
| E. coli MG1655 PBAD-gfp-mrr + pTrc99A-hhaII | Chromosomal + plasmid | Free GFP and unlabeled Mrr and HhaII MTase | Induction arabinose 0.4% and IPTG 1 mM |
| E. coli MG1655 Pmrr-gfp::mrr | Chromosomal | GFP-Mrr | Native promotor |
| E. coli MG1655 PBAD-gfp::mrr | Chromosomal | GFP-Mrr | Induction arabinose 0.4% |
| E. coli MG1655 PBAD-gfp::Mrr + pTrc99A empty | Chromosomal + empty plasmid | GFP-Mrr | Induction arabinose 0.4% and IPTG 1 mM |
| E. coli MG1655 PBAD-gfp::mrr + pTrc99A-hhaII | Chromosomal + plasmid | GFP-Mrr and HhaII MTase | Induction arabinose 0.4% and IPTG 1 mM |
| E. coli MG1655 PBAD-gfp::mrrD203A | Chromosomal | GFP-MrrD203A | Induction arabinose 0.4% |
| E. coli MG1655 PBAD-gfp::mrrD203A | Chromosomal + plasmid | GFP-MrrD203A and HhaII MTase | Induction arabinose 0.4% and IPTG 1 mM |
| E. coli BL21 (DE3)+ pBAD-strep::gfp::mrr | Plasmid | STREP-tagged GFP-Mrr | Induction arabinose 0.2% |
Similar to the pBAD-gfp::mrr and pBAD-gfp-mrr plasmids constructed earlier (9), the pBAD-gfp::mrrD203A plasmid was constructed by digesting a PCR amplicon of the mrrD203A allele (obtained using primers 5΄-ATCGCTGCAGACGGTTCCTACCTATGAC-3΄ and 5΄-CGATAAGCTTGCGTTTGCGGGGT TGAGG-3΄ on the pACYC184-mrrD203A vector; (18)) with PstI and HindIII, prior to ligation in the low copy number pBAD33-gfp_mut2-T7tag plasmid (19), digested with same enzymes. Subsequently, for construction of the E. coli K12 MG1655 PBAD-gfp::mrrD203A strain, chromosomally expressing a catalytically compromised version of the GFP-Mrr fusion protein from an arabinose inducible promoter, the chromosomal Δmrr::tetA-sacB allele was replaced with the pBAD-gfp::mrrD203A allele obtained from a PCR amplicon prepared on the pBAD-gfp::mrrD203A vector (using primers 5΄-ATTTTTGT AGTGCTATAGTAGCCGAAAAACATCTACCTGATTCTGCAAGGATGTACTTTATGACAACTTGACGGCTA-3΄ and 5΄-CGATAAGCTTGCGTTTGCGGGGTTGAGG-3΄). When required, the pTrc99A-hhaII plasmid (9), expressing the M.HhaII MTase from an IPTG (isopropyl β-D-thio-galactopyranoside) inducible promoter and corresponding pTrc99A control backbone (20) were introduced into E. coli MG1655 or its derivatives by electroporation.
Cell growth conditions and sample preparation
Cells from −80°C glycerol stock were grown overnight at 37°C in LB medium with antibiotics if necessary, at final concentrations of 100 μg/ml ampicillin, 30 μg/ml chloramphenicol or 50 μg/ml kanamycin. Cells were then 100-fold diluted in LB, induced with arabinose 0.4% and grown until late exponential phase (optical density at 600 nm (OD600) ∼ 0.6). When appropriate, the MTase was induced with 1 mM IPTG from the moment the cell culture reached an OD600 of ∼ 0.15. A 500 μl aliquot of cells at OD600 0.6 was subsequently centrifuged at 850 × g for 2 min and re-suspended in fresh LB to a final OD600 of ∼ 25. This high density was important for obtaining a field of view (FOV) full of bacteria in a single layer. All chemicals and media used are from AMRESCO (OH, USA).
Microscopy samples and high pressure treatment
Sample preparation for microscopy were made on agar pads (2% UltraPureTM LMP Agarose, Invitrogen) sandwiched between two glass cover slips No1 (VWR) coated with poly-L-Lysine and mounted in a stainless-steel holder as described in details in Ferguson et al. (21). For pressure treatment, 500 μl of culture was centrifuged at 3500 rpm for 2 min and re-suspended in 50 μl of LB. Then a computer-controlled HUB440 high pressure generator equipped with the SW-16 pressure vessel) was used to pressurize samples in 50 μl MicroTubes (both from Pressure BioSciences, Inc., South Easton, MA, USA). After pressure release, samples were centrifuged and re-suspended in a few microliters of LB to prepare the microscopy sample.
Fluorescence fluctuation microscopy
Two-photon fluorescence fluctuation imaging was performed using an Avalanche Photo Diode-based detector (ISS, Champaign, IL, USA). Excitation from a femtosecond pulsed infrared laser (MaiTai, Newport/Spectra Physics, Mountain View, CA, USA) was focused through a 60×1.2NA water immersion objective (Nikon APO VC) onto coverslip N1 (VWR). Calibration of the volume of the two-photon point spread function (PSF) was carried out using 40 nM fluorescein solutions (Spectrum) and 780 and 930 nm excitation at a laser power 12 and 43 mW, respectively. An excitation wavelength of 930 nm was used for the measurement of the GFP. The average power exciting laser was 11 mW. The wavelength was selected to simultaneously optimize GFP emission and minimize cellular auto-fluorescence. The excitation power was chosen to maximize the signal, while avoiding saturation and photo-bleaching effects. Infrared light was filtered from detected light by using a 735 nm low-pass dichroic filter (Chroma Technology Corporation, Rockingham, VT, USA). Emitted light was filtered with a 530/43 nm emission filter and detected by avalanche photodiodes (Perkin Elmer).
Number and brightness analyses
RICS analysis of diffusion dynamics of GFP-Mrr
The multiple raster scans obtained in the N&B imaging can also be analyzed to extract diffusion information as described by Digman and Gratton (25,26). This approach allows one to extract the diffusion coefficient of the fluorescent particles via fitting of the pixel pair spatio-temporal correlation function derived from the image size, the x-y gaussian PSF dimensions and the pixel dwell-time. Image size was 256 × 256 pixels for 13 × 13 μm. In the N&B images, pixel dwell-time was 40 μs, corresponding to a line time of 11.26 ms and a frame time of 2.61 s. In this analysis, spatial information is not retained, contrary to N&B. The SimFCS software (E. Gratton, LFD, University of California, Irvine, CA, USA), was used to fit the imaging data for the average diffusion coefficient for all the pixels in the FOV as described in the above cited work.
GFP-Mrr in vitro biochemistry
To obtain purified GFP-Mrr, the corresponding gpf::mrr fusion gene was equipped with a sequence encoding a Strep-tag and expressed from the pBAD33 plasmid (27) in E. coli BL21 (DE3) cells to produce N-terminal Strep-tag® II protein fusions. The Strep-gfp::mrr amplicon was obtained using the primers, 5΄-ACGTGGTACCCGGGGATCCTCTAGAGGAGGGAGTAATGTGGAGCCACCCGCAGTTC GAAAAAAGTAAAGG AGAAGAACTTTT-3΄ and 5΄-CGATAAGCTTGCGTTTGCGGGGTTGAGG-3΄, on the plasmid pBAD-gfp::mrr (9)) digested with with KpnI and HindIII, and ligated to pBAD33, digested with the same enzymes. For protein production, E. coli BL21 (DE3) cells equipped with the resulting pBAD-strep::gfp::mrr vector were grown in 700 ml LB at 37°C until OD600 reached ∼0.7, after which they were incubated with 0.2% arabinose for 3 h at 30°C. The cell pellet was kept at −80°C until resuspension in 15 ml of lysis buffer (100 mM Tris pH8, 150 mM NaCl, 1 mM ethylenediaminetetraacetic acid (EDTA), 1 mM Dithiothreitol (DTT) and 2 mM benzamidine). The cell suspension was supplemented with 1 mM lysozyme, 2 mM DNase and 12.5 mM Na2HPO4, left on ice for 30 min, sonicated then centrifuged for 25 min at 18 000 rpm. The Strep-tagged fusion protein was purified from the supernatant on a 5 mL Streptactin-superflow high capacity resin (IBA) equilibrated in 100 mM Tris pH 8, 150 mM NaCl, 1 mM EDTA. The protein fusion was eluted with the same buffer containing 2.5 mM desthiobiotin. The most concentrated fractions were pooled, protein concentration was estimated by the Bradford assay and aliquots were kept at −80°C. Analytical gel filtration was performed on Superdex 200 10/300 (GE Healthcare) equilibrated in 20 mM Tris pH 8, 150 mM NaCl and 1 mM EDTA at 0.5 ml/min. Samples of 500 μl were injected and elution fractions of 400 μl were collected. The presence of GFP-Mrr in the elution fractions was detected by measuring the fluorescence intensity of 100 or 200 μl aliquots on an infinite M1000 PRO plate reader (TECAN, Switzerland), exciting at 488 (±15) nm and collecting emission at 528 (± 20) nm.
RESULTS
Mrr is a tetramer in unstressed cells
As a first step to understand the mechanisms of Mrr activation by pressure shock, we sought to establish the localization and organization of Mrr inside E. coli cells. To visualize Mrr in live E. coli MG1655 cells we expressed it as a GFP-fusion. The GFP-Mrr fusion protein was previously shown to retain the known functionalities of the wild-type (WT) Mrr protein (9). To obtain robust signal to auto-fluorescent background ratios, the chromosomal mrr locus was replaced with a PBAD-gfp::mrr construct expressing the GFP-Mrr fusion protein from an arabinose inducible promoter (Figure 1C). We also examined strains expressing the gfp::mrr allele under control of the natural mrr promoter (Pmrr) at the natural locus on the E. coli MG1655 chromosome (Figure 1B) and in a strain equipped with a plasmid containing the PBAD-gfp::mrr allele (not shown). In the MG1655 Pmrr-gfp::mrr strain, GFP fluorescence levels were very low, although measurably above the levels of the auto-fluorescence (Figure 1A and B).
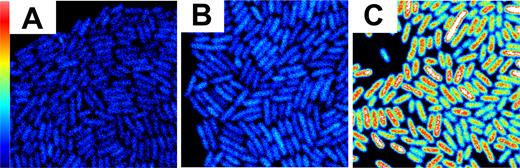
GFP fluorescence intensity maps of unstressed cells of (A) the parental Escherichia coli K12 MG1655 wild-type strain (MG1655 WT), (B) the MG1655 Pmrr-gfp::mrr strain producing GFP-Mrr from the native mrr promoter and (C) the MG1655 PBAD-gfp::mrr strain producing GFP-Mrr from the arabinose inducible PBAD promoter (arabinose 0.4%). Scale 20 × 20 μm FOV and maximum intensity is 1.5 counts per 40 μs pixel dwell-time. Cells were grown in a minimal media to avoid background auto-fluorescence.
As a control, the mrr locus in MG1655 was similarly replaced with a PBAD-gfp-mrr construct co-expressing GFP and Mrr as separate proteins from a bicistronic mRNA driven by an arabinose inducible promoter. Induction of both MG1655 PBAD-gfp-mrr and MG1655 PBAD-gfp::mrr with arabinose therefore allowed direct comparison of the properties of free GFP to that of the GFP-Mrr fusion. Images of untreated cells expressing the free GFP (along with unlabeled Mrr) (Supplementary Figure S1Aa) revealed a homogenous distribution of the GFP throughout the cells. Analysis of the diffusion of the free GFP in these untreated cells using Raster Scanning Image Correlation Spectroscopy (RICS) (Supplementary Figure S2A and D) yielded a diffusion coefficient of 4.14 ± 0.01 μm2/s, consistent with the diffusion of free monomeric GFP in bacteria (28). Although the intracellular concentration of the free GFP averaged over multiple fields of view (FOV) was much higher (i.e. 788 ±167 nM) when the PBAD-gfp-mrr construct was expressed with arabinose 0.002% from the pBAD-gfp-mrr plasmid compared to its expression from the chromosomal locus (i.e. 115 ± 9 nM) with arabinose 0.4%, the average molecular brightness of the free GFP was similar in both cases (0.082 +/− 0.004 counts/per molecule/pixel dwell time). We therefore conclude that the association state of free GFP does not change over this concentration range. Due to differences in microscope alignment, the GFP molecular brightness calculated by N&B analysis as well as the auto-fluorescence of the parental MG1655 strain (i.e. not expressing any GFP; Figure 1A) could vary from day to day (Supplementary Figures S1B and 3E). Accordingly, auto-fluorescent background and free GFP control measurements were performed for each experiment. The GFPmut2 variant used has been demonstrated to be a monomer (29). Hence we assign the daily brightness value measured for the free GFP to correspond to that of GFP monomer.
The average concentration of GFP-Mrr in unstressed MG1655 PBAD-gfp::mrr cells (0.4% arabinose), calculated from the average corrected intensity and the monomeric GFP molecular brightness using Equation (5) was 185 ± 56 nM, expressed in monomer units (∼120 monomers per cell). Calculation of the molecular brightness for the GFP-Mrr fusion on multiple FOV of this strain using Equation (3) yielded brightness values 4-fold higher than those found for the monomeric GFP controls. Hence the GFP-Mrr fusion exhibits a stoichiometry of four GFP units per complex, indicating that Mrr is tetrameric in unstressed cells (Figure 2B). The concentration calculations reveal that Mrr is present at ∼45 tetramers per cell under these conditions. Interestingly, RICS analysis of the N&B stacks for the translational diffusion of the GFP-Mrr fusion from this strain (Supplementary Figure S2B and D) indicated significantly slower diffusion than free GFP, with the GFP-Mrr protein being immobile on a timescale of tens of milliseconds. Slower dynamics could be due in part to the difference in size between monomeric GFP and the GFP-Mrr tetramer. However, due to the cube root dependence of diffusion time on molecular weight, the ∼10-fold difference in size would only decrease the diffusion coefficient by a factor of ∼2.2 to ∼1.7 μm2/s. Hence, non-specific interactions with the chromosome likely contribute significantly to slow diffusion of GFP-Mrr compared to free GFP. In agreement with the notion that GFP-Mrr interacts with the chromosome in unstressed cells, the chromosomally expressed GFP-Mrr appeared somewhat localized in cell center (Figures 1C and 2Aa). Moreover, a previous study in E. coli cells expressing the same GFP-Mrr fusion protein at much higher levels from a low-copy plasmid revealed nucleoid-bound Mrr foci (9). At the present expression levels, cell morphology was not strongly altered as a result of GFP-Mrr expression (9), underscoring the inactive nature of Mrr under control conditions.
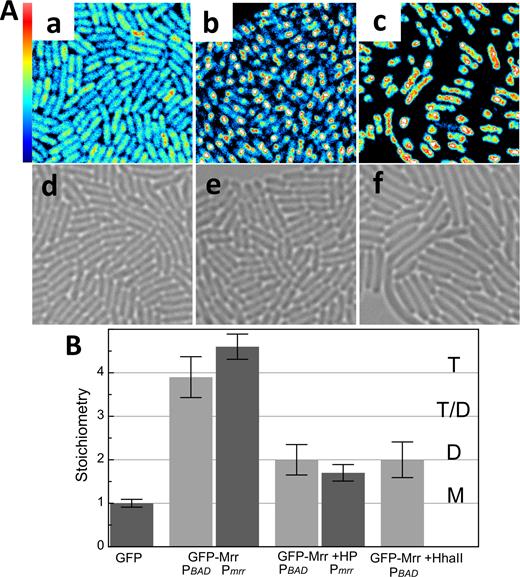
Effect of HhaII MTase and pressure on GFP-Mrr localization and molecular brightness. GFP-Mrr is expressed under the control of PBAD promotor with induction by arabinose (PBAD) or is native promotor (Pmrr) in the chromosome. (A) Fluorescence intensity maps of (a) PBAD-gfp::mrr in unstressed cells (GFP-Mrr) (b) PBAD-gfp::mrr cells after 20 min at 100 MPa (+HP) and (c) PBAD-gfp::mrr + pTrc99A-HhaII after 60 min induction of the MTase HhaII by IPTG (+HhaII). Scale is 20 × 20 μm. Maximum intensity scale is 2 counts per 40 μs pixel dwell-time. Bright-field images of (d) PBAD-gfp::mrr in unstressed cells, (e) PBAD-gfp::mrr cells after 20 min at 100 MPa and (f) PBAD-gfp::mrr + pTrc99A-HhaII after 60 min induction of the M.HhaII by IPTG. (B) Stoichiometry values of fluorescent proteins corresponding to GFP monomers (M), dimers (D), tetramers (T) or a possible equilibrium between dimer and tetramer (T-D) as deduced from the background corrected molecular brightness of fluorescent proteins in strain PBAD-gfp-mrr (GFP), PBAD-gfp::mrr yielding GFP-Mrr expressed from the PBAD promoter at the natural chromosomal locus (GFP-Mrr, PBAD) or from the natural promoter Pmrr-gfp::mrr (GFP-Mrr, Pmrr) in unstressed cells or after pressure treatment (HP) and PBAD-gfp::mrr + pTrc99A-HhaII after induction of the HhaII MTase by IPTG.
Mrr becomes a dimer organized into foci when triggered by HP or M.HhaII
To investigate the molecular basis for the puzzling pressure-induced SOS response, we examined the behavior of GFP-Mrr after HP shock, by exposing arabinose induced MG1655 PBAD-gfp::mrr to 100 MPa for 20 min. Pressure shock resulted in the formation of GFP-Mrr foci and some cellular elongation (the extent of which depends upon time after pressure shock) (Figure 2Ab and e), in agreement with the previous study (9). Interestingly, although the existence of such foci suggested GFP-Mrr had aggregated on the nucleoid, N&B calculations on the foci actually revealed that tetrameric GFP-Mrr had dissociated to dimer after HP treatment (Figures 2B and 3A and B). However, not all of the total cellular GFP-Mrr content became focally organized after HP shock. The remaining cytoplasmic GFP-Mrr exhibited a stoichiometry between tetramer and dimer (Figure 3A and B), perhaps due to a decrease in concentration and the contribution of background fluorescence. No large change in the average translational diffusion coefficient of GFP-Mrr after pressure treatment was observed.
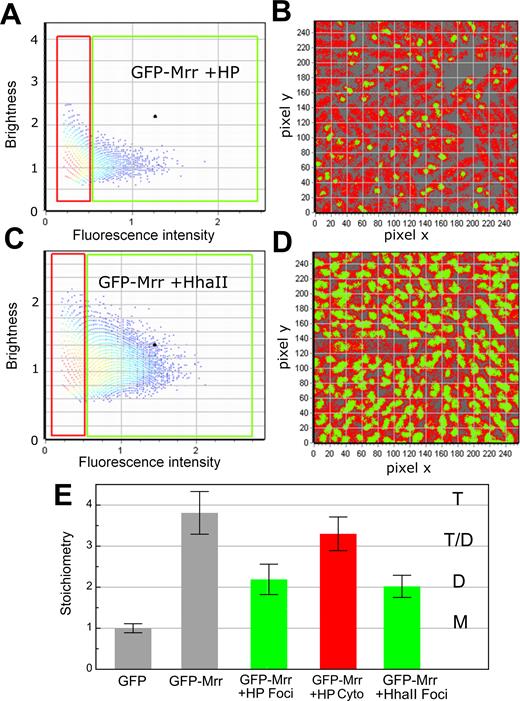
Localization dependent effect of pressure or MTase induction on GFP-Mrr stoichiometry. Images were obtained after pressure shock of 20 min at 100 MPa or M.HaII induction by IPTG. (A and B) Example of image after HP shock. (A) Brightness versus intensity pixel histogram from an example image obtained after HP shock. All the pixels in the FOV in (B) are plotted in (A) according to the molecular brightness (counts per pixel dwell-time per molecule) and the average intensity (counts per pixel dwell time) calculated for each pixel. In the red rectangle those pixels with intensity values below 0.5 counts per dwell time have been selected, where as in the green square, all pixels with intensity values above 0.5 counts per dwell time have been selected. Intensity values below 0.2 were eliminated by thresholding. (B) Intensity-based pixel selections from (A) mapped to the image obtained after HP shock. Green pixels correspond to those selected with the green square in (A). They exhibit a high intensity but lower brightness and they localize to the foci, while red pixels with a lower intensity but higher brightness localize in the cytoplasm (outside of the foci). (C and D) Example of image obtained after M.Hhall induction. (C) Brightness versus intensity pixel histogram for an example image obtained after M.Hhall induction. All the pixels in the FOV in (D) are plotted in C according to the molecular brightness (counts per pixel dwell-time per molecule) and the average intensity (counts per pixel dwell time) calculated for each pixel. In the red rectangle those pixels with intensity values below 0.5 counts per dwell time have been selected, where as in the green square, all pixels with intensity values above 0.5 counts per dwell time have been selected. Intensity values below 0.2 were eliminated by thresholding. (D) Intensity-based pixel selections from (C) mapped to the example image obtained after M.Hhall induction. Green pixels correspond to those selected with the green square in (C). They exhibit a high intensity but lower brightness and they localize to the foci, while red pixels with a lower intensity localize in the cytoplasm (outside of the foci). (E) Stoichiometry values of fluorescent proteins corresponding to GFP monomers (M), dimers (D), tetramers (T) or a possible equilibrium between dimer and tetramer (T-D) as deduced from the background corrected molecular brightness of fluorescent proteins in strains PBAD-gfp-mrr (GFP), chromosomal PBAD-gfp::mrr + pTrc99A-hhaII (GFP-Mrr +HhaII) after M.HhaII induction and chromosomal PBAD-gfp::mrr in unstressed cells (GFP-Mrr) or after pressure treatment (GFP-Mrr +HP) for pixels inside of the foci (green, Foci) and outside of the foci (red, cytoplasm).
We succeeded as well, in quantifying the molecular brightness for GFP-Mrr expressed from its natural promoter (MG1655 Pmrr-gfp::mrr) by reducing auto-fluorescence via growth on minimal media (Figure 1B). N&B analysis revealed that GFP-Mrr in this strain was tetrameric prior to HP treatment and dimeric after pressure release, as observed for the GFP-Mrr produced from the PBAD promoter (Figure 2B). Likely due to the low expression levels of Mrr under control of its native promotor (6-12 nM Mrr in monomer units, or 1–2 tetramers per cell on average) no foci were observed after pressure treatment. HP shock had no effect on the auto-fluorescence of control cells not expressing any GFP (Supplementary Figure S3). Nor did it change the molecular brightness (stoichiometry) of free GFP in the PBAD-gfp-mrr strain, which expressed free GFP and untagged Mrr from the arabinose inducible promoter at the Mrr natural chromosomal locus (Supplementary Figure S1).
Mrr has been shown to promote DNA damage in response to expression of the foreign methyl transferase, M.HhaII (6). Hence, we sought to determine if M.HhaII expression would modify the stoichiometry of GFP-Mrr, as in the case of HP shock. The MG1655 PBAD-gfp::mrr strain was equipped with the pTrc99A-hhaII plasmid expressing the M.hhaII gene under the control of the IPTG responsive Ptrc promoter. Co-expression of GFP-Mrr and M.HhaII resulted in filamentous cells and the appearance of pronounced GFP-Mrr foci in the center of the cells (Figure 2Ac and f), in agreement with previous observations (9). As in the case of HP shock, M.HhaII induction led to dissociation of tetrameric GFP-Mrr to dimer (Figures 2B and 3C and D). The fluorescence intensity and molecular brightness outside the foci in MG1655 PBAD-gfp::mrr upon IPTG induction of M.HhaII were found to be at auto-fluorescent background levels, indicating that nearly all of the GFP-Mrr molecules were present in the foci (Figure 2Ac). Interestingly, in contrast to HP shock, the apparent mobility of the dimeric GFP-Mrr in the foci after M.HhaII induction increased compared to that of dimeric GFP-Mrr after HP shock or tetrameric GFP-Mrr in unstressed cells either bearing the empty pTrc99A plasmid or not (Supplementary Figure S2B and C).
The changes in GFP-Mrr stoichiometry upon HP shock or MTase induction cannot be ascribed to the presence of the empty plasmid, pTRC99A, as arabinose and IPTG treatment of the MG1655 PBAD-gfp::mrr strain equipped with the empty pTrc99A plasmid backbone yielded normally growing cells with tetrameric GFP-Mrr (Supplementary Figure S4). Moreover, no effect on cell morphology, auto-fluorescence intensity or molecular brightness was observed upon IPTG induction of M.HhaII, when GFP-Mrr expression was suppressed (MG1655 PBAD-gfp::mrr strain bearing the pTrc99A-hhaII plasmid, in presence of IPTG, but in absence of arabinose and in presence of glucose to ensure the lack of Mrr expression) (Supplementary Figure S3). Furthermore, the N&B results of free GFP produced in the MG1655 PBAD-gfp-mrr strain did not significantly differ in brightness or concentration between unstressed control cells and M.HhaII exposed cells (Supplementary Figure S1), although the latter cells (due to the M.HhaII mediated activation of Mrr) displayed a similar filamentation as MG1655 PBAD-gfp::mrr (Figure 2Af).
Purified Mrr is in a tetramer dimer equilibrium in vitro
Since the brightness values for GFP-Mrr obtained by N&B indicated that Mrr is tetrameric in unstressed E. coli cells and dimeric after HP shock or MTase induction, we sought to determine the oligomeric state of purified GFP-Mrr in vitro. A Strep-tagged version of GFP-Mrr was produced in E. coli BL21 (DE3) cells, purified and subjected to analytical size exclusion chromatography (SEC). Elution of the protein injected at 155 nM (Figure 4, black curve) was monitored by fluorescence intensity, revealing a large major peak of 257 kDa, consistent with a tetramer, followed by a minor peak at 112 kDa consistent with a dimer. Sodium dodecyl sulphate-polyacrylamide gel electrophoresis analysis of the eluted fractions showed that both peaks contained purified Strep-tagged GFP-Mrr at the expected size (61 kDa), suggesting the presence of different oligomeric states for the native protein (data not shown). When the protein was injected on the SEC column at 35 nM, the relative intensity of the tetramer and dimer peaks was inverted (Figure 4, red curve). Moreover, when the peak from the injection at 155 nM, corresponding to the tetramer was collected and re-injected onto the SEC column, the relative intensity of the tetramer peak compared to the dimer decreased as well (Figure 4, gray curve). This demonstrates that purified GFP-Mrr forms tetramers in vitro that dissociate into dimers at lower concentration.
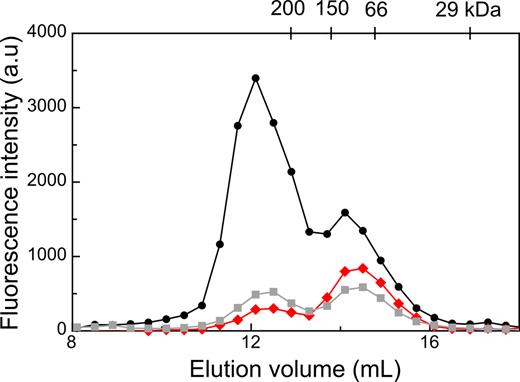
Size exclusion chromatography of purified Strep-Tagged-GFP-Mrr injected at 155 nM (black circles) or 35 nM (red diamonds), and of the fractions collected between 11.7–12.5 ml re-injected on the column (gray squares). Fluorescence intensity in the elution fractions was detected in a fluorescence plate reader using and 488–528 nm excitation-emission. The elution volume of the molecular weight markers used for calibrating the column is indicated on top.
In vivo properties of an Mrr catalytic mutant
Further investigation focused on the behavior of an engineered Mrr mutant with a D203A substitution in the putative catalytic loop, which was previously shown to be resistant to HP activation (18), strain MG1655 PBAD-gfp::mrrD203A. The average stoichiometry values calculated from N&B analysis of this strain revealed that in unstressed cells MrrD203A exhibited a slightly lower stoichiometry than WT GFP-Mrr (Figure 5), indicating that the protein was present in equilibrium between dimer and tetramer. Since the GFP-MrrD203A protein was expressed from the PBAD promoter at concentrations equivalent to WT GFP-Mrr (218 +/− 114 nM), the lower average stoichiometry of the D203A mutant indicates a lower affinity between dimers for the GFP-MrrD203A mutant. Indeed the WT is tetrameric even at the low concentrations expressed from the WT promoter, further supporting the conclusion that the D203A mutation results in a large decrease in affinity between dimers. After pressure shock, a slight accumulation of GFP-MrrD203A was observed in the cell center, in the vicinity of the chromosome, but no bona fide foci formation occurred (Figure 5). Unlike the results obtained for WT GFP-Mrr, no change in average stoichiometry was observed for the GFP-MrrD203A mutant after pressure treatment, suggesting either that HP does not disrupt the tetramer or that HP-dissociated dimers can re-associate rapidly to tetramers after pressure release. Depending upon the exact expression levels of the GFP-MrrD203A mutant, the average stoichiometry values calculated for unstressed cells varied from day to day due to the concentration dependence of the tetramer-dimer equilibrium. However, for a given expression level, these values were equal before and after a pressure shock (Supplementary Figure S5). In contrast to HP treatment, plasmid-borne M.HhaII expression in the strain expressing GFP-MrrD203A resulted in filamentation, robust formation of foci, and dissociation of the GFP-MrrD203A to dimer (Figure 5 Ac and f and B). Like the WT GFP-Mrr, mobility of the catalytic mutant increased after M.HhaII induction (Supplementary Figure S2), suggesting that this effect does not require cleavage.
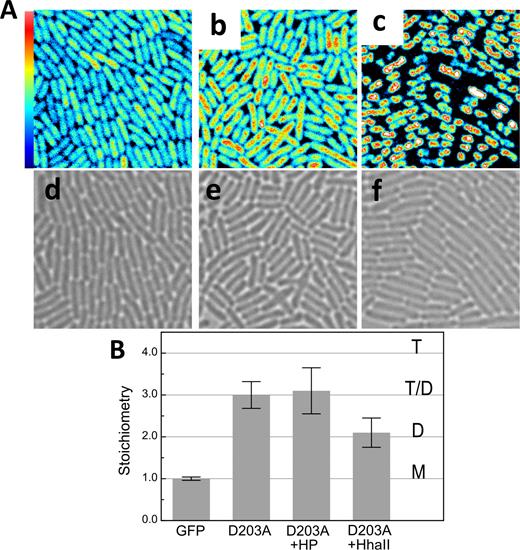
N&B results from Mrr mutant strains PBAD-gfp::mrrD203A and PBAD-gfp::mrrD203A + the pTrc99A-hhaII plasmid after pressure treatment or induction of the MTase HhaII. (A) Fluorescence intensity maps of GFP-MrrD203A (a) without treatment, (b) after 20 min at 100 MPa (HP) and (c) after induction of M.HhaII with IPTG for 60 min (20 × 20 μm). Maximum intensity scale is 2 counts per 40 μs pixel dwell-time. Bright-field images of PBAD-gfp::mrrD203A (d) without treatment, (e) after 20 min at 100 MPa (HP) and (f) after induction of M.HhaII with IPTG for 60 min. (B) Stoichiometry values of fluorescent proteins corresponding to GFP monomers (M), dimers (D), tetramers (T) or a possible equilibrium between dimer and tetramer (T-D) as deduced from the background corrected molecular brightness of fluorescent proteins in PBAD-gfp-mrr (GFP), PBAD-gfp::mrrD203A without (D203A) or after pressure treatment (D203A +HP) and PBAD-gfp::mrrD203A + pTrc99A-hhall after induction of MTase expression (D203A +HhaII).
DISCUSSION
In E. coli K-12 MG1655, the DNA damage (SOS) response can be mounted by activating the endogenous Mrr Type IV REase through HP shock or through expressing the M.HhaII Type II MTase (7,30). Based on sequence homology with the MspII Restriction endonuclease (31), Mrr is putatively composed of a DNA binding domain that recognizes specific methylated DNA sequences, and a catalytic domain responsible for DNA cleavage (32). The average stoichiometry and dynamics of GFP-Mrr in the absence of HP or MTase triggers indicated that the protein forms tetramers that are immobile on a timescale of tens of milliseconds. In contrast, the protein is dynamic on a timescale of seconds, since intensity fluctuations are observed in N&B (22). Consequently, we conclude that the protein is in reversible interaction with the chromosome, although these interactions may be non-specific. Even non-specific protein–DNA interactions can appear immobile on a timescale of tens of milliseconds (33). Most importantly, since Mrr is inactive in unstressed cells (8,9), no DNA cleavage occurs.
Upon pressure shock and release, or induction of MTase expression, we observed that Mrr forms foci, shown previously to be associated with the chromosome (9). N&B analysis reveals that the Mrr present in these foci is dimeric. Interestingly, while HP shock has no effect on GFP-Mrr mobility, MTase induction leads to increased dynamics. The origins of this increased mobility are unclear. One possibility is that cleavage of the DNA at the multiple methylated sites created by the MTase leads to greater mobility of the fragmented chromosome. However, this increase in mobility upon MTase induction is observed for the catalytic mutant of Mrr as well, although residual activity cannot be ruled out. Another possibility is that the existence of a large number of specific target sites on the chromosome leads to increased Mrr migration between target sites, even in the absence of cleavage.
Overall, the results from Number and Brightness measurements suggest distinct molecular mechanisms of Mrr activation by HP and M.HhaII expression (Figure 6). We propose that pressure pushes the Mrr tetramer-dimer equilibrium toward the active, dimeric form. The catalytic sites of Mrr may be masked in the tetrameric form, and exposed upon dissociation to dimer. While it is possible that the effect of HP could result from a structural perturbation of the E. coli nucleoid, thereby exposing cryptic Mrr sites, rather than a direct effect on Mrr oligomerization state, the effect of pressure on protein oligomerization equilibria (34) has been known for decades (14,35,36). Upon release of pressure some proportion of GFP-Mrr dimers, perhaps those not specifically bound to the chromosome, re-associate to tetramer. However, the observation that GFP-Mrr present in the foci after pressure release is dimeric suggests that cleavage at the cryptic sites present in the chromosome leads to an increase in affinity between active, dimeric Mrr and the target sites, which prevents its re-association to tetramer. We assume that Mrr does not remain bound to a single target site on the chromosome, but rather remains statistically in interaction with the chromosome, migrating between these cryptic target sites. Hence the small number of Mrr molecules produced from the natural Mrr promoter can cleave at multiple sites after dissociation/activation by pressure. Increased affinity could arise from a change in conformation at the cleaved sites, nucleoid condensation or the recruitment of other SOS factors to the foci. In the absence of cleavage, as is likely the case for the catalytic mutant, the affinity of Mrr for the un-cleaved cryptic sites is not high enough to prevent, in a dynamic equilibrium, its re-association to tetramer after pressure release. In support of our model in which pressure pushes the Mrr tetramer-dimer equilibrium toward the active dimer, we note that oligomerization appears to be linked to function in the case of Mrr, since the catalytic D203A mutant exhibits a lower affinity between dimers in unstressed cells.
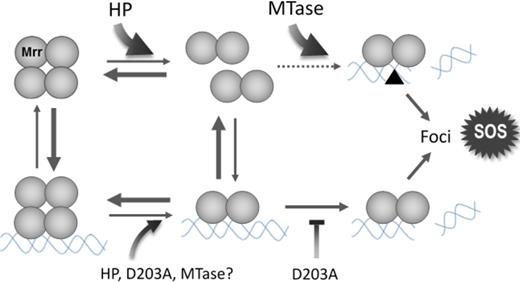
Schematic of the proposed mechanism of Mrr activation by a high pressure shock (HP) or by expression of the M.HhaII methyltransferase (MTase). HP is proposed to dissociate the inactive tetrameric Mrr to an active dimer which recognizes low affinity sites on the chromosome and cleaves them. Dimeric Mrr would remain bound at the DNA cleavage site and form foci while triggering the SOS response. By favoring the dimer, pressure would thus push Mrr toward activation. The MTase is proposed to function by methylating the DNA, thus creating a large number of high affinity sites for Mrr (black triangle). Any infinitesimal amount of active dimer in equilibrium with inactive tetramer would be readily captured at these high affinity sites and cleave them, thus irreversibly pulling Mrr toward activation. The Mrr D203A catalytic site mutation would inhibit cleavage of non-methylated DNA, reducing foci formation and precluding the HP-induced SOS response. It is likely that the DNA-bound Mrr tetramer is also subjected to the effect of high pressure, DNA methylation or the D203A mutation.
In contrast to pressure pushing the Mrr toward active dimer, we propose that M.HhaII MTase activity pulls the tetramer-dimer equilibrium to an active, dimeric state. Upon expression of the MTase, a large number of highly specific, high affinity methylated sites for Mrr are generated on the chromosome. The small amount of Mrr dimer in equilibrium with the tetramer binds to these specific sites. Alternatively, tetrameric Mrr could bind to these sites and then dissociate to dimer. In either case, this pulls the tetramer-dimer equilibrium toward active dimer. In the case of WT Mrr, extensive cleavage of the chromosome ensues. Interestingly, the effects of MTase expression on Mrr localization, stoichiometry and dynamics are identical for the catalytic mutant. One interpretation of this observation is that the large increase in affinity of the active, dimeric form of Mrr for the methylated DNA sites, stabilizes the dimer in the foci, even in the absence of cleavage.
N&B analysis has revealed strong coupling between Mrr oligomerization and its function in vivo, further supported by in vitro analytical biochemistry. The oligomerization and activity are perturbed via distinct mechanisms by pressure shock and MTase induction, both resulting in an SOS response. These studies highlight the importance of quantitative molecular measurements for deciphering functional mechanisms in live cells.
SUPPLEMENTARY DATA
Supplementary Data are available at NAR Online.
ACKNOWLEDGEMENTS
The authors would like to express their appreciation to Pressure BioSciences, Inc. of South Easton MA for their loan of the HUB440 high pressure generator used in this study.
FUNDING
Rensselaer Polytechnic Institute; Alfred P. Sloan Foundation 2015-14088 (to C.A.R.); KU Leuven Research Fund [DBOF/12/035, DBOF/14/049, GOA/15/006 to A.A.]. Funding for open access charge: RPI internal funds.
Conflict of interest statement. None declared.
Present address: Anirban Ghosh, Department of Cell and Molecular Biology, Uppsala University, Uppsala, 75124, Sweden.
REFERENCES

Comments