


Abstract
Chemical modification was used to quantitatively determine the flexibility of nearly the entire rRNA component of the yeast ribosome through 8 discrete stages of translational elongation, revealing novel observations at the gross and fine-scales. These include (i) the bulk transfer of energy through the intersubunit bridges from the large to the small subunit after peptidyltransfer, (ii) differences in the interaction of the sarcin ricin loop with the two elongation factors and (iii) networked information exchange pathways that may functionally facilitate intra- and intersubunit coordination, including the 5.8S rRNA. These analyses reveal hot spots of fluctuations that set the stage for large-scale conformational changes essential for translocation and enable the first molecular dynamics simulation of an 80S complex. Comprehensive datasets of rRNA base flexibilities provide a unique resource to the structural biology community that can be computationally mined to complement ongoing research toward the goal of understanding the dynamic ribosome.
INTRODUCTION
The ribosome is a prototype upon which much of our understanding of the molecular biology and biochemistry of complex molecular machines is based [reviewed in (1–5)]. Numerous approaches, including single molecule FRET, advanced cryo-EM and molecular dynamics (MD) simulations are bringing the ribosome to life, revealing both large and fine scale structural rearrangements tied to functional changes at all three phases of the translation life-cycle (3,6–10). Modification of rRNA by chemicals reacting with rRNA moieties depending on their availability/flexibility is one of the oldest approaches used to probe ribosome structure and function. This was used to generate the first 2D rRNA structural maps [reviewed in (11,12)], which proved to be remarkably accurate upon elucidation of atomic resolution X-ray crystallographic structures (13–15). Although chemical probing is traditionally used to obtain structural information, selective 2΄-hydroxyl acylation by primer extension (SHAPE) probing informs on the dynamic fluctuations of rRNA at nucleotide resolution. The quantitative nature of these data can be used as a powerful adjunct to enhance our understanding of the dynamic processes underlying the ribosome's complex life cycle.
Protein synthesis is generally divided into three phases, initiation, elongation and termination. The bulk of the activity occurs during elongation. This is a cyclical process comprised of a series of stepwise events that are accompanied by both large and fine-scale structural rearrangements of the two ribosomal subunits. The elongation cycle and much of what is known to occur during this process is diagrammed in Figure 1. Our understanding of the structural rearrangements that occur during the translation elongation cycle continues to grow in complexity. At the bulk level, many approaches have revealed the universal nature of the intersubunit rotation event (16–21), and more recently a sub-rotation of the head of the small ribosomal subunit (SSU) that is required for binding of the translocase (22–24), which is the step where the majority of mRNA movement occurs (25). In eukaryotes, a ‘rolling’ motion of the SSU has also been shown to be involved in this process (26). Single molecule FRET and rRNA chemical modification methods have been used to identify more fine scale rearrangements, including movements of the L1 stalk and exit of deacylated tRNA from the ribosome, and structural rearrangements associated with aa-tRNA accommodation (27–29). In the current study, eight intermediate states of the translation elongation cycle were biochemically generated using yeast ribosomes, and subjected to chemical modification analysis using quantitative high throughput selective 2΄ hydroxyl acylation analyzed by primer extension (hSHAPE) (30,31). We report the flexibility values of 5.8S, 18S and 25S rRNA molecules on a per nucleotide basis, as the ribosome progresses through the translation elongation cycle. The data are then analyzed using three visualization approaches. These analyses (a) appear to identify a transfer of flexibility from the large ribosomal subunit (LSU) to the SSU through specific intersubunit bridges; (b) map pathways for this transfer within and between the two subunits strongly suggesting allostery; and (c) help constrain and refine MD simulations to generate more accurate computational models of ribosome dynamics through the elongation cycle. The ultimate goal of all of these studies is to ‘bring the ribosome to life’, i.e. to use advanced computational visualization methods to understand, at the atomic resolution level, all of the structural rearrangements that occur during the elongation cycle. Such a ‘movie’ will serve as a foundation for numerous applications, particularly regarding the rational design of next generation therapeutics that target these apparent signal transmission pathways.
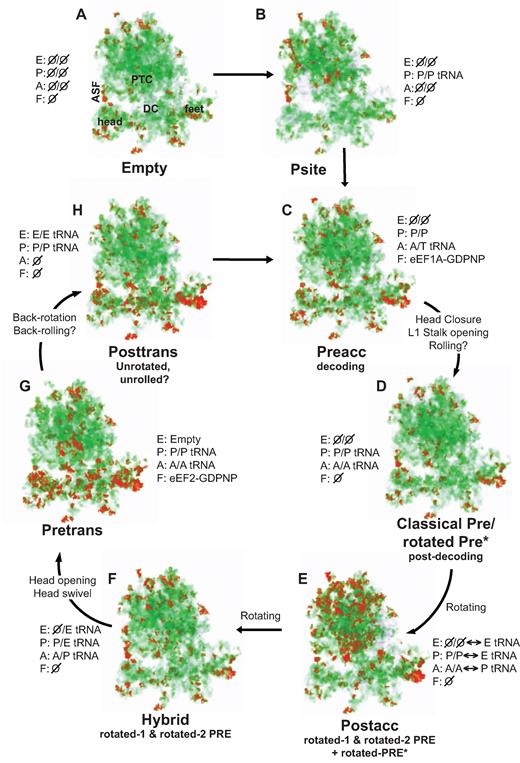
Mapping entropy distribution through the translation elongation cycle: the LSU is activated first, followed by the SSU. Eight different ribosome complexes were biochemically isolated and characterized by hSHAPE. The hSHAPE data were mapped to the atomic resolution ribosome structure (35) and converted to 3 Å voxels in which red represents volumes of high flexibility, green medium flexibility and white low flexibility. (A) Empty ribosomes. (B) P site occupied (by Ac-PhetRNAPhe). (C) Pre-accommodation complex. (D) Classical states complex. (E) Postaccomodation complex. (F) Hybrid states complex. (G) Pre-translocation complex. (H) Posttranslocation complex. In each panel, E denotes the occupancy state of the ribosomal E site, P denotes the P site, A refers to the A site, and F indicates the occupancy status of the elongation factor binding site. Ø indicates that these sites are unoccupied, P/P and AA/ are classical state peptidyl- and aminoacyl-tRNA, respectively, and P/E and A/P denote hybrid state tRNAs. PTC: peptidyltransferase center; DC: decoding center; ASF: A-site finger (H38); head: small subunit head structure. A full rendering of these states in 3D is shown in Supplementary Video 1.
MATERIALS AND METHODS
Ribosomal complex assembly for hSHAPE analyses and verification
Complex assembly conditions were based on results from ribosome binding assays of tRNAs, ternary complex and eEF2. Binding assays were conducted as previously described (32,33). Ribosomal complex components were purified and/or prepared as previously described (32). Complexes were biochemically validated as described in Supplementary Figure S1. Detailed descriptions of complex assembly and validation are presented in Supplementary Materials.
hSHAPE
1M7 treatment and primer extensions were performed as previously described (33,34). Capillary electrophoresis using a single capillary was performed by GENEWIZ, Inc.
ShapeFinder analysis
hSHAPE data were aligned to rRNA sequences using ShapeFinder as previously described (33,34). Fitted baseline adjustment, mobility shift correction, signal decay correction, scaling, alignment features of the software were employed and the aligned peaks were fitted into a Gaussian function. Integrated peak values were obtained as the areas under 1M7 treated peaks minus the areas under corresponding negative control peaks, and used for further analyses. Version 1 of the analysis was performed as previously described (34), and the resulting reactivity levels color coded to be mapped onto 3D structures of the yeast ribosome. Version 2 of the analysis is explained in detail in the Supplementary Materials.
Generation of difference maps of eukaryotic rRNA
The color-coded absolute and comparative reactivity values were mapped onto the 3.0 Å X-ray crystallography structure of Saccharomyces cerevisiae ribosome (35) using a PyMOL script, as previously described (34).
Data visualization by voxels and volume rendering
Visualization of RNAs was performed using volume rendering, i.e. visualization of data in the form of 3D pixels, referred to as ‘voxels’. This method is extensively used to visualize scalar and vector fields such as MRI, CT and fluid flow datasets (36–41). The flexibility information of yeast rRNAs was converted into a scalar field to enable volume visualization. The process is described in detail in the Supplementary Materials.
Parameter optimization and molecular dynamics simulations
Crystal structures of 4V88 (35), 3J77 and 3J78 (17) were used to model the yeast ribosome 80S complexes of empty, pre-translocation and post-translocation states respectively. Initial force field parameters were generated by SMOG program. GROMACS 4.6 suite of programs (42) was used to sample conformations at each functional state to compute backbone flexibilities needed for parameter optimization. Backbone flexibility of a nucleobase is estimated from MD simulations by calculating the variance of the angle (i.e. angle fluctuations) |$\delta {\theta _i} = \langle \theta _i^2\rangle - {\langle {\theta _i}\rangle ^2}$| where θ is defined as the angle between atoms (C2i, Pi+1, C2i+1) and |$\langle ...\rangle$| represents the ensemble average. This later used to estimate SHAPE reactivities using a pseudo potential (43). SHAPE reactivities computed from MD were fine-tuned to match experiments by automatically changing forcefield parameters. Details of parameter optimization and molecular dynamics setup can be found in Supplementary Materials. Following the parameter optimization 4 × 10⁶ steps MD simulation was performed for further analysis of the global motion in the vicinity of the functional states.
RESULTS
Transfer of fluctuations from the LSU to the SSU sets the stage for translocation
Empty ribosomes and five different complexes were initially assembled in vitro and biochemically verified (Supplementary Figure S1) to examine the flexibility of yeast ribosomal RNA at different steps of the elongation cycle. These were: (i) those harboring only an acetlyated Phe-tRNAPhe in the P-site tRNA (P-site occupied complex); (ii) acetlyated Phe-tRNAPhe in the P-site tRNA + Phe-tRNAPhe•eEF1A•GDP (A/T state or pre-accommodation complex); (iii) deacylated tRNAPhe + Phe-Phe-tRNAPhe (Post-accommodation complex that fluctuates between classical P/P+A/A and hybrid P/E+A/P states); (iv) deacylated tRNAPhe + Phe-Phe-tRNAPhe + eEF2•GDP (pre-translocation complex in which the tRNAs are fixed in the hybrid P/E and A/P states) and (v) deacylated tRNAPhe in the E site tRNA + Phe-Phe-tRNAPhe in the P-site (posttranslocation complex). To capture tRNA movement intermediates, two additional complexes were assembled as explained in detail below.
hSHAPE statistical analyses were improved from those of previously described (34), such that: (a) the raw data obtained were log transformed to obtain normal distributions before median normalization (Supplementary Figure S2); (b) the data from a ribosomal complex were divided by empty ribosome data as a further normalization step and (c) data grouping into levels and the associated color code were improved (Supplementary Figure S3). The resulting Version 2 analyses provided greater resolution of the hSHAPE data, revealing many more changes in rRNA flexibility at the single nucleotide level than the original Version 1 analyses. An example of this analysis is shown in Supplementary Figure S4. The improved qualities of Version 2 are particularly evident through comparison of the old and new versions of the subtractive analyses, e.g. compare Figure S4C and S4F. hSHAPE probing of rRNA structures of the complexes described above resulted in high resolution flexibility data of ∼5000 nucleotides for each of the eight different complexes that were probed (Supplementary Table S1).
Division of the log normalized data into 3 Å radius voxels, where each voxel is represented by the maximum internal flexibility value, enabled visualization of large scale rRNA flexibility trends through the elongation cycle (Figure 1, Supplemental Movie 1). The previously observed high amount of fluctuations, or ‘undulating movement’ of the penultimate stem of the 18S rRNA (44), is evident in this visualization. Strikingly, this representation reveals that a large number of nucleotides in the large subunit (LSU) become highly flexible after aa-tRNA accommodation and completion of the peptidyl transfer reaction (Figure 1E). This overall energetic destabilization suggests that the LSU assumes an activated or high-fluctuation state after peptidyl transfer. This is consistent with intersubunit rotation that occurs during this stage of the elongation cycle (16,18,45), and with the ability of the tRNAs to transit back and forth between the classical (P/P A/A) and hybrid (P/E A/P) states after peptidyl transfer (46–48). In contrast, when the tRNAs are locked in either the classical (Figure 1D) or hybrid states (Figure 1F) by use of antibiotics, the LSU is less disordered, although there are small but discrete differences between their fluctuation profiles. Upon eEF2 binding (Figure 1G), the flexibility appears to be transferred from the LSU to the small subunit (SSU) activating it for translocation. This is consistent with a view that translocation relies heavily on large-scale SSU-specific movements, including subunit rolling and/or SSU head swiveling (22,25,26,49,50).
Mapping the transfer of fluctuations between the two subunits through the intersubunit bridges
Given that the two subunits are connected by a series of intersubunit bridges, it is logical to surmise that the observed large scale energy transfer occurs through these structural elements. Accordingly, changes in rRNA flexibility at the interface between the two ribosomal subunits were examined in all of the complexes (Figure 2, Supplementary Figure S5, and Table S2). The reactivity of bases participating in all 13 of the intersubunit bridges was observed to change from one complex to the next as indicated by the presence of both increased and decreased nucleotide reactivities in the difference maps. A large fraction of the bridges displayed decreased reactivity upon occupation of the P-site by tRNA (as compared to empty ribosome, Supplementary Figure S5A). This was reversed, i.e. the intersubunit bridges became more flexible upon completion of the next major step of the elongation cycle, accommodation, consistent with tRNAs being able to oscillate between the classical and hybrid states (46–48), suggesting that post-accommodation ribosomes are metastable (Figure 2A, Supplementary Figure S5C). This activation of the intersubunit bridges was reversed upon completion of translocation, consistent with the tRNAs becoming locked in the classical state (Figure 2B, Supplementary Figure S5D). These findings support the hypothesis that energy transfer between the two subunits occurs through the intersubunit bridges. In addition, these data indicate that the P-site occupied and posttranslocation complexes are in the unrotated conformation, and that the Post-accommodation complex freely transits between the unrotated and rotated conformations, consistent with earlier single molecule FRET measurements (19). Additionally, the reactivities of many bridges appeared to increase (with the exceptions of B7a, parts of B2c, B3, and eB12) in the pre-accommodation complex (Supplementary Figure S5B), consistent with its transitional/activated nature.
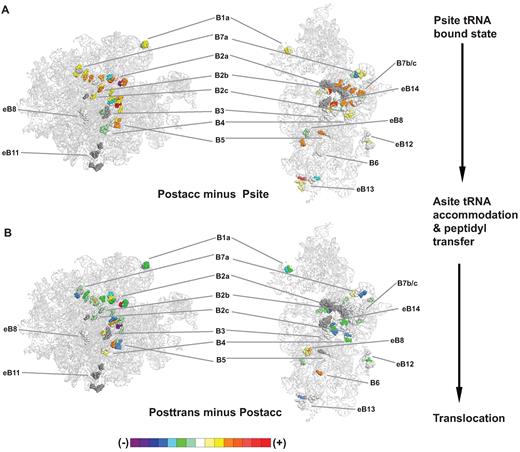
Intersubunit bridge nucleotides reverse their flexibility patterns as the ribosome progresses from accommodation through translocation. hSHAPE data were applied to the atomic resolution structure of the yeast ribosome, using the color scheme indicated at bottom (described in Supplementary Figure S2) to represent relative changes in the flexibilities of nucleotides participating in the indicated intersubunit bridges. (A) Postaccommodation complex nucleotide flexibility values were compared to those of P site occupied ribosomes. (B) Posttranslocation complex flexibility values were compared to those of the postaccommodation complex.
Fine-scale mapping of rRNA flexibility changes reveals new insights into elongation mechanism
To obtain a fine-scale understanding of how changes in rRNA flexibility correlate with different stages of the translation elongation cycle, some of the functionally important regions of the ribosome were chosen, beginning with the elongation factor binding site (GTPase activation center, or GAC), and then following the path taken by an incoming tRNA, through the accommodation corridor (51), A-site, peptidyl transferase center, P-site, hybrid corridor (52) and E-site (Supplementary Figures S6 and S7, Table S2). As the decoding center is located too close to the 3΄ end of the 18S rRNA to be resolved by hSHAPE, the rRNA reactivity changes could not be captured in this region, and thus this analysis focuses more closely on critical regions of the large subunit. Note that the rRNA flexibility changes described in this section are relative changes, based on difference maps generated by comparison of two complexes representing contiguous stages of the translation elongation cycle.
The GTPase activation center
In the P-site occupied ribosome, the base of the GTPase activation center (Helices 42–44) becomes generally less reactive, i.e. less flexible (Supplementary Figure S6A). This is possibly due to a global effect on ribosome dynamics upon assumption of a non-rotated conformation. Beyond this step, the overall reactivity of the region increases, except in the pre-translocation complex, where large decreases in reactivity are visible (Supplementary Figure S6D). A portion of expansion segment 7L (ES7L) located above the base of this structure also shows decreased reactivity in the P-site occupied, pre-accommodation, and pre-translocation complexes (Supplementary Figure S6A–D), and increased reactivity in the post-accommodation and post-translocation complexes (Supplementary Figure S6C and E). This suggests that ES7L may become less flexible upon ligand binding to the ribosome, particularly upon elongation factor binding.
The A-site finger (H38)
The B1a intersubunit bridge at the tip of Helix 38 plays an important role in monitoring tRNA occupancy of the A-site, and in transmitting information between the subunits (53,54). While this element remains highly flexible overall, its previously identified ‘hinge bases’ (53) show decreased flexibility upon occupation of the P-site by tRNA (Supplementary Figure S6F). The hinge bases generally become more flexible in the pre-accommodation complex, as indicated with a color change from purple to orange or red, while the more rigid sections of this element become less flexible, as indicated by color change from yellow to green or blue (Supplementary Figure S6F and G). The trend is reversed after aa-tRNA accommodation and in the pre-translocation complex, where the tip of H38 in particular becomes highly mobile (Supplementary Figure S6H and I). After translocation, the pattern reverts to one in which the hinge regions are generally more flexible (Supplementary Figure S6J). At the single nucleotide level, A1025 (Escherichia coli U887), one of the three bases that comprise the LSU half of the B1a intersubunit bridge shows a detectable increase in reactivity (indicated by yellow color) in the pre-accommodation complex (Supplementary Figure S6G), supporting the possibility that intersubunit bridges rearrange in this complex. Its reactivity remains similar in the post-accommodation complex (indicated by white color) (Supplementary Figure S6H), but is decreased in the pre-translocation complex (indicated by green color) compared to the post-accommodation complex (S6I). Other than the A-site finger (the tip of Helix 38), a few more nucleotides in the 1020–1030 (E. coli 882–892) region show changes in flexibility as elongation progresses, most notably in the pre-accommodation complex (despite the increase in reactivity of U1022, C1023, A1025—E. coli U884, C885, U887—G1029 and C1031—E. coli G891, C893—show decreased flexibility) and the pre-translocation complex (increased reactivity of U1022, A1027, G1029, A1030—E. coli U884, C889, G891, A892) (Supplementary Figure S6I and J).
The aa-tRNA accommodation corridor
The 3΄ ends of aa-tRNAs transit from outside of the LSU to the PTC through the accommodation corridor, a universally conserved channel that is bounded on one side by H89, and on the other by a more complex structure composed of H90–H92 (51). Chemical modification and biochemical analyses of mutant ribosomes (33,54–57), and molecular dynamics simulations (58) provided evidence that this structure opens and closes to enable aa-tRNA passage. The series of images shown in Supplementary Figure S6F–J reveal the changes in nucleotide flexibilities during this process at the nucleotide level. Upon occupation of the P-site by Ac-aa-tRNA (Supplementary Figure S6F), the accommodation corridor facing sides of H89 and H91 becomes more flexible than in empty ribosomes. The distal tips of H89 (U2842—E. coli U2473) and H91 (G2901—E. coli G2532) are also highly flexible in this complex, while G2841 (E. coli G2472) undergoes a loss of flexibility upon P-site occupation. In general, these observations are consistent with the notion that this structure opens up and becomes activated at this stage of the elongation cycle (33,55,56,59). U2835, C2836 and G2850 (E. coli C2466, C2467, G2481) in H89 also become highly flexible (indicated by red color) (Supplementary Figure S6F). Interestingly, while conventional 2D maps originally generated by chemical modification techniques depict these bases as located in a bulge near the distal end of H89, the X-ray crystal structures reveal this to be a continuous helix formed by base stacking interactions (60), perhaps because these are locked into the lowest energy state during the crystallization process. The increased flexibility of these bases in this context suggests that disruption of the continuous helix may be required for activation of the accommodation corridor. Immediately opposite of these, helix H42 (i.e. A1202, A1203, A1204, G1300, A1301, A1302, A1303—E. coli A1027, A1028, A1029, G1125, A1126, A1127, G1128) undergoes loss of flexibility as do multiple bases in the central core of H91 (indicated by purple color).
In the pre-accommodation minus P-site occupied difference map (Supplementary Figure S6G), the distal tip of H92 remains flexible, and U2842 and U2843 (E. coli U2473, U2474) at the distal tip of H89 become highly flexible as well. Interestingly, the middle of the corridor on the H89 side (U2835, C2836—E. coli C2466, C2467) shows decreased flexibility, while the ‘gate bases’ (U2860, C2925, and C2941—E. coli U2491, C2556, A2572) become slightly more flexible. These findings are consistent with final opening and activation of the accommodation corridor (56,61). After aa-tRNA accomodation into the PTC, the entire accommodation corridor undergoes a dramatic decrease in flexibility, consistent with its closure (Supplementary Figure S6H). Upon binding of eEF2 in the pre-translocation complex, the corridor is again activated with a pattern that is very similar to the P-site occupied minus empty ribosome comparison (compare Supplementary Figure S6F and I). After translocation the corridor appears to return to the pre-accommodation complex levels (Supplementary Figure S6J).
Helix 95 (sarcin/ricin loop)
This base and the tip of this element become highly mobile upon occupation of the P-site by tRNA, suggesting that it is also activated in this state (Supplementary Figure S6F). In general, its mobility is decreased upon binding of the elongation factors (Supplementary Figures S6G and I), and it regains mobility upon their dissociation from the ribosome (Supplementary Figures S6H and J). These changes are consistent with its known interactions with these factors during the elongation cycle. However, base-specific changes in flexibility, particularly in a stretch from U3020–U3023 (E. coli U2653–U2656) hint at differences in the interaction of the sarcin ricin loop (SRL) with the two elongation factors (Supplementary Figures S6G and I).
The peptidyltransferase center
Examination of the peptidyl transferase center (Supplementary Figure S7A–E) reveals changes in base flexibility consistent with its occupation by tRNA 3΄ ends, and their movement through this space during the course of the elongation cycle. For example, upon occupation of the P-site by Ac-Phe-tRNAPhe, A2820 (E. coli A2451) becomes less flexible (Supplementary Figure S7A) compared to empty ribosomes, consistent with its interaction with the 3΄ end of the peptidyl-tRNA (62). The reactivity of A2820 increases slightly in the pre-accommodation complex (Supplementary Figure S7B) and becomes even more flexible after accommodation all the way through translocation (Supplementary Figure S7C–E). These findings are consistent with the dynamic nature of the tRNAs in the peptidyltransferase center. A2971 (E. coli A2620) remains highly reactive throughout the elongation cycle with the exception of the post-accommodation complex, where it becomes less flexible (Supplementary Figure S7C). The H92–H93 A site region becomes dramatically less flexible after accommodation as expected by the established interactions between the A-loop (helix 92) and the A-site tRNA (Supplementary Figure S7C). This is observed again after translocation: this may be due to the presence of the E site tRNA in the posttranslocation complex, possibly affecting the A-site flexibility and conformation (Supplementary Figure S7E) (63).
The E site
Deacylated tRNAs exit the PTC and the ribosome via the E-site (64,65). Supplementary Figure S7F–J depict this structural element from the L1 stalk side. Similar to the P stalk base, portions of the L1 stalk base (Helices 76–78) and Helices 67 and 68 become less flexible upon occupation of the P-site (Supplementary Figure S7F). The region of the central protuberance (CP) that interfaces with tRNAs harbors both low and high reactivity nucleotides in this complex. However, in the pre-accommodation complex, the rRNA base reactivity changes are reversed (Supplementary Figure S7G), and overall, a pattern of increased reactivity is observed in this side of the tRNA binding pocket upon completion of accommodation (Supplementary Figure S7H). Nucleotides U2767–U2768 (E. coli G2396, G2397) and G2794 (E. coli C2422) at the tRNA interface of Helix 88 become less reactive in the post-accommodation complex compared to the pre-accommodation complex (Supplementary Figure S7H), perhaps due to an unlocked conformation of the post-accommodation complex where the P-site tRNA samples P/P and P/E states. As expected by the presence of P/E state tRNA, the tRNA binding pocket of the E-site is dramatically less reactive in the pre-translocation complex (Supplementary Figure S7I).
The hybrid state corridor
A biomolecular simulation approach was previously used to identify the universally conserved route through which the tRNA 3΄ ends travel as they transit from the classical to the hybrid states (52). To examine this hybrid corridor, we focused on nucleotides C2405 (E. coli C2063), C2406 (E. coli C2064), G2619 (E. coli G2251), A2804 (E. coli A2435), A2819 (E. coli A2450), A2820 (E. coli A2451), U2954 (E. coli U2585), G2964 (E. coli U2595), A2971 (E. coli A2602), G2972 (E. coli G2603). Visual analyses are shown in Supplementary Figure S8, and the data are tabulated in Supplementary Table S3. Most of these nucleotides (C2405, C2406, U2954, G2964, A2971, G2972) lose flexibility in the hybrid states complex (ANI/HYB) compared to the classical states complex (CHX/CLS), indicating that A/P and P/E state tRNAs are in contact with the hybrid corridor (Supplementary Figure S8F). Most hybrid corridor nucleotides contact the CCA ends of A/P, P/P and P/E state tRNAs (17), while A2971 and G2972 have been reported to be protected during A/A site occupancy (66). In the freely rotating post-accommodation complex compared to the P site occupied complex, nucleotides closer to, or located at the A and A/P sites, were observed to be less flexible while P site residues were more flexible. It is possible that the flexibility of P site at this state may allow for free rotation. Alternatively, once accommodation and peptidyl transfer occur, the stability of the A site may contribute to the directionality of elongation. The effect on the A site is visible to a degree in the comparison of pre- and post-accommodation complexes as well. In the fully rotated pre-translocation complex locked by eEF2, A site nucleotides of the corridor become highly flexible compared to the freely rotating post-accommodation complex. It would be expected for the A site to be largely open in the rotated complex, after the incoming, accommodated tRNA moves to the P site. Finally, upon completion of translocation, compared to the pre-translocation complex, many residues of the hybrid corridor (C2619, A2804, G2964, G2972), spanning the A/A site to the P/E site, lose flexibility. P and E site stability may be due to the tRNA contacts, while A site stability may be due to E site occupancy and possible A and E site communication (63,65).
Probing transient states during the elongation cycle
Ribosomal complexes were also assembled with the eukaryote-specific antibiotics cycloheximide and anisomycin in order to capture ribosomes in two intermediate steps of accommodation. Specifically, addition of cycloheximide prior to accommodation created unrotated ribosomes with tRNAs locked in the classical P/P and A/A states, while addition of anisomycin after accommodation locked rotated ribosomes with tRNAs in the hybrid P/E and A/P states (Supplementary Figure S1E). These were named Cls (classical) and Hyb (hybrid) state complexes, respectively. The same intersubunit views and the same functionally important regions are shown in Supplementary Figure S9. Analyses by voxels and volumetric rendering reveal a stark contrast between the post-accommodation and the other states: the LSU of Hyb has significantly higher fluctuations than its SSU, in contrast to the other states, where this is reversed (compare Figure 1D with F). Indeed, close examination of the Hyb state reveals the same networks of information flow through the B1b/c intersubunit bridge (67), the B1a bridge (33,53), the B7a and B2a–c bridges (33), across the LSU tRNA binding pocket (67,68) that were revealed by genetic analyses of mutants (Supplementary Figure S9A–E). In general, this analysis reveals the same series of interconnected information exchange pathways composed of rRNA structural elements that may enable different regions of the ribosome to communicate and coordinate with one another.
Examination of the intersubunit region of Hyb versus Cls difference map reveals that the reactivities of those on the SSU side of Hyb ribosomes are generally increased, while most on the LSU side remain either unchanged or even have decreased flexibility (Supplementary Figure S9A). Since elongation factor binding was not part of the assembly process of these complexes, the P stalk base area remained generally unchanged, except for an overall slight reactivity increase in parts of ES7L and H42, and decreased reactivity of Helix 97 (Supplementary Figure S9B). Importantly, H97 contacts H42, and molecular dynamics simulations of bacterial ribosomes implicate this interaction in regulating P stalk base flexibility (69). H97 stabilization may be required to keep the P stalk base in place upon assumption of the rotated state, which may dampen the majority of the rRNA base flexibility changes at the stalk base. The ASF (H38) component of B1a bridge is slightly more reactive in the Hyb complex compared to the Cls complex (Supplementary Figure S9C). While no differences were observed in the flexibility of bases in the distal region of the accommodation corridor, differences were detected in its PTC-proximal region and the SRL. Although the interpretable data spanning the entire H89–101 structure suggests that it is generally less flexible in the Hyb complex, much of the information pertaining to H89 were not interpretable in the Hyb complex because the electropherograms featured large peaks in all channels of this region (not shown). This may be due to overall very high flexibility of this helix in the Hyb complex, leading to high rates of SHAPE reactivity. The SRL (spanning U3020–C3034—E. coli U2653–C2667) is also slightly more reactive in the Hyb complex overall, while C3025 and G3031 (E. coli C2658 and G2664), appear to be quite inflexible and A3021, G3022, U3023 (E. coli A2654, G2655, U2656) not showing flexibility change between the Cls and Hyb complexes. Since accommodation occurred in both of these complexes, very few reactivity changes were observed in large parts of H92 and H93 (Supplementary Figure S9D). However limiting tRNA movement by preventing them from toggling between the classical and hybrid states serves to limit the flexibility of individual nucleotides, including A2971 and its near neighbors. In the E site, regions located close to the 3΄-CCA end of the deacylated tRNA in the P/E state showed decreased flexibility in Hyb ribosomes (Supplementary Figure S9E). However, increased reactivity was observed along a hinge in the center of the H83–H87 structure.
Correlated fluctuations reveal intra-ribosomal allosteric communication pathways
In light of the analyses presented above and data presented in prior literature, the nucleotide flexibility data were subjected to further analyses designed to uncover novel characteristics, specifically focusing on those nucleotides that decrease or gain reactivity in concert with one another as the ribosome transitions from one step to the next (Figure 3). Such correlated (where the same sets of nucleotides change flexibility in the same direction) and anti-correlated (where the same sets of nucleotides change flexibility in the opposite direction) changes among nucleotides, which are located in different regions of the ribosome, are consistent with allosteric communication networks that were previously mapped using yeast ribosomal protein and rRNA mutants (32,33,53,54,67,70,71). The current analysis reveals that elongation factor (EF) association/dissociation is associated with the greatest number of these types of linked base reactivity changes and that these changes spanned a large number of both previously mapped functional regions (67) as well as revealing novel ones (Supplementary Table S4), consistent with the previous observation of synchronization of mobile ribosome elements by EF-G (48,72).
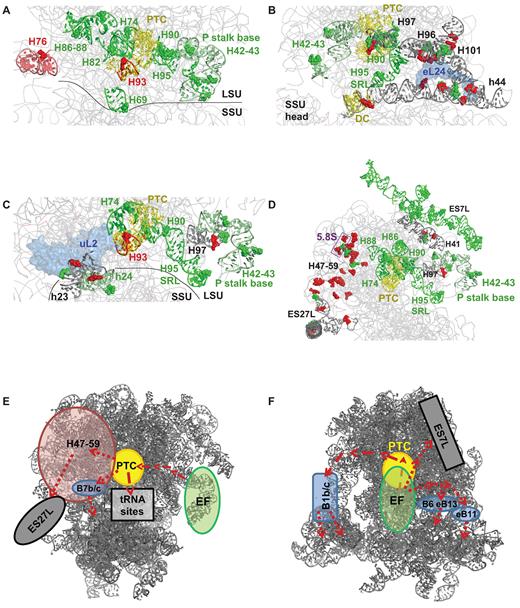
Correlated and anti-correlated changes in base flexibility reveal of allosteric communication pathways in elongation factor bound ribosomes. hSHAPE data were analyzed to identify rRNA nucleotides which display similar changes in chemical reactivity with one another through the elongation cycle. These are listed in Supplementary Table S4. These were mapped to the 5.5 Å cryo-EM model of the translating eukaryotic ribosome (99), in which red colored nucleotides show linked loss of flexibility and green nucleotides have linked increased flexibility. The helices in which these nucleotides are located are shown with matching colors or gray for helices harboring both red and green residues. Selected ribosomal proteins are colored light blue. These analyses reveal nucleotides and helices joining the P stalk base (H42–43) with the following. (A) The PTC, tRNA binding sites (A, P, E). (B) The PTC, SRL, intersubunit bridges B6, eB11, eB13. (C) Intersubunit bridge B7b/c. (D) Expansion segment 7L, the PTC, 5.8S, LSU Domain III (H47–59), and expansion segment 27L. Taken as a whole, two different possible allosteric communication pathways are mapped. (E) One extending from the elongation factor binding site (EF) to the PTC from where it branches out to the tRNA binding pockets, to ES27L through Domain III (H47–59), or to the small subunit through bridge B7b/c. (F) A second network maps from the elongation factor binding site to the small subunit through intersubunit bridges B1b/c, B6, eB11 and eB13.
Analysis of the hSHAPE data illuminates a communication channel between the elongation factor binding site (the P stalk and H95 - sarcin ricin loop) and the A, P and E sites (Figure 3A). Nucleotides from Helices 42, 43, 95 (EF binding site); H90 (part of accommodation corridor); H69 (participating in A-site tRNA decoding and the B2a bridge); H74 (close proximity to the PTC and bridges H86 and H88); H82 (part of the P-site); H86 and H88 (part of the E-site) all show decreased reactivity in EF bound complexes. In contrast, nucleotides from helices 76 (part of L1 stalk base, associated with E-site tRNA movements) and 93 (part of A-site) gain reactivity in EF bound complexes. H76 also has high reactivity in the P site occupied complex compared to empty ribosomes (Supplementary Figure S6A). Taken as a whole, these findings are consistent with an allosteric communication pathway that was previously mapped using mutants of eL5 (previously named L11) (67) and eL10 (previously named L10) (33) that starts at the GAC, reaches into the PTC, and from there separates into branches: one spanning the A, P and E sites, and a second that may employ the A site tRNA to reach through H69 across the B2a bridge to the decoding center (Figure 3A).
Examination of the same sets of nucleotides suggests the presence of additional communication pathways connecting EF binding to intersubunit bridges. Elongation factor binding, especially eEF2, causes major rearrangements in the bridge regions (Supplementary Figure S5D, S5E), which may be a major driving force of the elongation cycle. Figure 3B shows a new pathway governing part of the bridges B6, eB11 and eB13. The low reactivity of nucleotides in in H95/SRL and H101 (part of eB11) are also in close proximity to H96, suggesting that the movements of H95 and H101/eB13 are coordinated through their mutual interactions with H96. H96 also contacts eL24, which interacts with h44 to form parts of B6 and eB13 bridges. These bridges have been implicated in subunit rolling of the mammalian ribosomes (26). The increased reactivity in H96 and h44 occur where they contact eL24. Since eL24 participates in the and B6 and eB13 intersubunit bridges, this finding suggests that these bridges may undergo rearrangements upon elongation factor binding.
Figure 3C also depicts a novel allosteric communication pathway between the EF binding site and B7b/c bridge. Upon EF binding, rearrangements occur in H90 both through H95/SRL and H97. This crosses over to H74, which lies in close proximity to uL2. uL2 in turn contacts h23–24 of small subunit to form B7b/c. Consistent with prior studies of uL2 mutants (32), the presence of nucleotides of opposing reactivity at the h23–uL2 interface may be indicative of a switch from nonrotated to rotated conformations upon factor binding and a switch in the opposite direction upon factor dissociation.
Pathways connecting the EF binding site and expansion segments ES7L and ES27L were also identified (Figure 3D). The observation linking the P stalk (Supplementary Figure S6A–E) and ES7L may impart a potential role to this expansion segment in EF binding. In addition to this, H41 may contact both the P stalk helices and ES7L, establishing a parallel information flow pathway. The solvent exposed ‘back’ of the LSU, specifically Domain III (H47–59), also appears to participate in this proposed ES27L pathway. Most nucleotides from this domain (which contacts 5.8S rRNA, and contains Helices 47–59 including the H50 contribution to the peptide exit tunnel) are reactive in the factor bound complexes, and lose reactivity upon factor dissociation. Thus, a communication pathway between PTC/H74 and ES27L may form in the absence of EFs, perhaps mediated by zuotin (73).
Models of the proposed communication pathways are summarized in Figure 3E and F. This proposes that upon EF binding, this information is physically transduced by conformational rearrangements to: (a) PTC or PTC-proximal helices; (b) ES7L; and (c) intersubunit bridges eB6, eB13, eB11. From the PTC, information is then transmitted to: (a1) tRNA binding sites; (a2) ES27L through Domain III and (a3) intersubunit bridges B1b/c and B7b/c. We suggest that information transmitted to these bridges is then relayed to the SSU, where it participates in coordinating the rearrangements associated with this subunit through the translation elongation cycle. Thus, these models suggest how conformational (both intrasubunit and intersubunit) dynamics of the ribosome are coupled.
Using hSHAPE data to guide molecular dynamics simulations
The highly quantitative, single nucleotide resolution rRNA flexibility data generated in this study has been employed to help guide computational studies of ribosome dynamics. Molecular dynamics simulations of the 80S yeast ribosome, using an all-atom structure-based model (74), were used to study the dynamics of the complexes probed by hSHAPE. Structure-based modeling has been found to be advantageous for ribosome simulations because this approach preserves ribosome stereochemistry while extending MD simulations to physiological time scales (75). Structure-based models were calibrated with the hSHAPE data to produce dynamics using the SHAPE-FIT (76) method. The simulations grounded on experimental data were used to help fine-tune the molecular dynamics forcefield. The dynamics for each residue were then used to mechanistically interpret the hSHAPE data and to provide atomic level interpretations of reactivities based on backbone fluctuations. The calibration procedure employed in this study is explained in the Supplementary Material, differences with our previous approach (76) are discussed.
The parameter set was successfully optimized to reflect the hSHAPE data for the entire 80S ribosome in three complexes. In Figure 4, panels A–C compare hSHAPE reactivity of pre-translocation complex between experimental and simulation. All ribosomal proteins were included in the simulations but are not shown in the visualizations, allowing clearer visualization of the rRNA fluctuations, which correspond to the measured SHAPE reactivities. Figure 4A shows the default SMOG potential result in comparison to the experiment in (Figure 4C). The computed reactivity from the simulations shows a dramatic difference when compared with experiment before the parameter optimization, indicating the inaccuracies of the atomic forcefield. Figure 4B shows the same result after parameter optimization. The similarities between the color maps between computed and experimental hSHAPE reactivity data demonstrates the success of this procedure. Figure 4D shows the hSHAPE reactivity comparison in nucleotide resolution for empty ribosomal complex. To quantify the degree of similarity Pearson correlation coefficient was also computed before and after the optimization. Simulations for all complexes showed weak correlation (0.1–0.2) before the optimization and high correlation (0.7–0.8) after it. Supplemental Movie 2 shows an all atom molecular dynamics simulation of the pre-translocated ribosomal complex using a potential corrected to reflect backbone flexibilities according to SHAPE measurements. This movie reveals how mobile the SSU is in comparison to LSU.
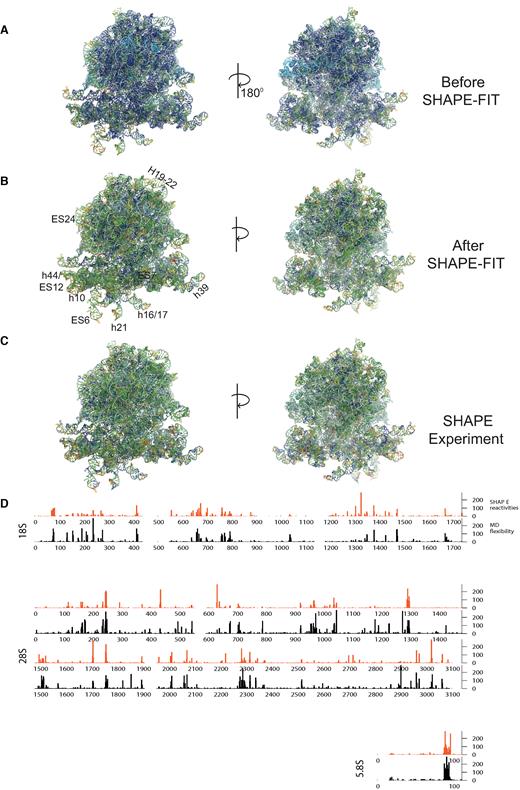
The pre-translocation ribosomal complex RNAs colored according to the log-normalized SHAPE reactivity computed from simulation and measured by experiments. Reactivity of each nucleobase is computed from the angle fluctuations between the two consecutive bases using all atom molecular dynamics simulations. Proteins that are included in the simulations are omitted for clarity. (A) The computed reactivity using the standard potential energy function. (B) Result of computed reactivity after forcefield parameters were optimized based on experimental SHAPE data using SHAPE-FIT method. (C) hSHAPE reactivity from the experiments for comparison. (D) Base by base comparison of computed and measured SHAPE reactivity of 80S empty ribosome RNAs after the forcefield parameters were optimized using SHAPE.
DISCUSSION
All functional assemblies possess physically interconneted networks through which functional information is exchanged to ensure coordination of distantly located functional centers. As first postulated over a half-century ago (77), it is natural that this principle should also apply to biological systems. This principle is scale-independent, extending from signal transduction networks at the cellular level, to metazoan neural networks at the organismal level, all the way out to the interconnected feedback and feedforward networks observed in ecosystems. The ribosome is no exception. A recent computational analysis of conserved contacts between ribosomal protein extensions revealed protein-based circuits analogous to neural networks organized along the path of tRNA translocation, and around the peptide exit tunnel (78). Classical genetic studies, in which networks are identified by their disruption upon mutation of key interacting elements located both in ribosomal proteins and rRNAs, have been critical in identifying many of the rRNA-based allosteric information exchange networks revealed here (32,33,53–55,57,67,70,71,79–82).
While prior studies have used rRNA modification to qualitatively map local allosteric pathways by identifying perturbations caused by specific mutations, the SHAPE analysis presented here is unique because it presents a highly quantitative database of almost the entire rRNA content of a model eukaryotic ribosome across eight native states at nucleotide resolution. Importantly, SHAPE enables the measurement of rRNA base fluctuations, and by correlating these functions between different steps in the elongation cycle, it enables rigorous, precise identification and quantitative analysis of allosteric signal pathways throughout the entire ribosome. Thus, while prior studies had identified communication pathways spanning the two subunits through the B1b/c (67), B7b/c (32) and B1a intersubunit bridges (53), novel additions to these networks identified in the current study include B6, eB11, eB13 and the involvement of 5.8S rRNA and expansion segments 7L and 27L. Indeed, the finding that these structures are more flexible in the elongation factor bound complexes represents the first evidence of the active participation of 5.8S rRNA and the ‘back’ of the LSU in the elongation cycle. Intriguingly, the ribosome-associated J protein–Hsp70 chaperone zuotin was recently found to interact with this region of the ribosome, specifically with H54 (73), fluctuations within which are coordinated with 5.8S rRNA (Figure 3D). This complex is thought to help coordinate protein translation and folding by simultaneously monitoring the decoding-site on the SSU and nascent-polypeptide transit on the LSU, and mutants of the complex affect translational fidelity (83). Taken together, these findings may implicate the involvement of 5.8S rRNA in this intersubunit quality control network.
The analyses presented here shed additional light on many of the important issues in protein synthesis. One is whether and when the codon–anticodon interaction is stabilized by A-minor interactions with SSU rRNA bases (E. coli G530/yeast G567; E. coli: A1492 and A1493/yeast A1755, A1756). First observed by X-ray crystallographic analyses of bacterial ribosomes (84), this structural rearrangement was proposed to initiate a series of conformational changes starting with SSU domain closure in the decoding center followed by tRNA distortion, and finally transducing this information to the LSU to activate GTP hydrolysis by EF-Tu/eEF1A (85–87). A cryo-EM study of the human ribosome generally supported this, but also documented a codon sampling state in which the codon of a pre-accommodation aa-tRNA is located in the A-site without mini-helix formation (26). While A1492 and A1493 (yeast A1755, 1756) are too close to the 18S rRNA 3΄ end to be analyzed in the current study, G567 was highly reactive both when the A-site was unoccupied (empty and P-site occupied) and in the aa-tRNA pre-accommodation complex. In contrast, G567 became unreactive in post-accommodation ribosomes and remained so through the pre-translocation state, returning to full reactivity in post-translocation ribosomes (Supplementary Table S1). Thus, these data support the cryo-EM studies. However, the novel finding from the current analysis is that G567 remained highly flexible after aa-tRNA accommodation when entry into the hybrid state was blocked by cycloheximide. While the observation that this base is rendered unreactive after aa-tRNA accommodation provides the first documentation supporting the formation of the mini-helix in ribosomes in solution, it calls into question the proposed function of the mini-helix: perhaps rather than functioning to initiate activation of elongation factor GTPase activity, it may instead serve to lock the anticodon loop of the A-site tRNA into the correct reading frame while the body of the tRNA repositions into the hybrid state.
A longstanding issue in the field centers on the hypothesis of long distance communication/coordination between the A- and E-sites (88–90). The analysis shown in Figure 3A supports this model, illustrating the anticorrelative relationship between LSU rRNA structures associated with aa-tRNA recruitment and insertion into the A-site (Helices 42, 43 and 90) and H76, which abuts the E-site and forms the base of the L1 stalk. Indeed, the detailed analyses of the tRNA corridor through the LSU are consistent with the idea that movement of the tRNAs through the ribosome are accompanied by coordinated rearrangements of specific rRNA bases along this route. Another novel finding from this study is the high degree of rRNA base fluctuation (high entropy state) in the LSU in post-accommodation ribosomes. This is presumably associated with the free movement of the ribosome between the Rotated-1 and Rotated-2 states (26), also known as the HI and HII hybrid states, and the bulk transfer of those fluctuations into the SSU upon eEF2 binding. We suggest that this bulk transfer of energy lowers the activation barrier to the large scale movement of the SSU during translocation (see Figure 1). The analyses shown in Figure 2, Supplementary Figures S5 and S9 also reveal the novel network of intersubunit bridges through which this entropy transfer occurs in a stepwise manner. This may also shed light on a model generated from a cryo-EM study of mammalian 80S ribosomes that resolved an SSU specific rolling motion orthogonal to the head rotation observed in bacterial and archeal ribosomes accompanying translocation (26). Here, the pre-translocation SSU high entropy state appears to be evenly distributed throughout the subunit and not solely localized to the SSU ‘head’ (Figure 1G). The observation that the entire SSU is in motion in this state would appear to support the idea of SSU backrolling in this transitional state. The failure to observe a corresponding high energy state in pre-accommodation ribosomes may indicate that the rolling intermediate cannot be captured by our experimental setup. A final observation is based on Supplemental Movie 2 which shows that the most mobile rRNA elements tend to be located on the peripheries of the subunits.
A current area of investigation is focused on RNA binding proteins (RBPs) which are physically associated with polysomes and which are able to promote translation of selected mRNAs (91–97). This line of inquiry intersects with another hotly debated idea, ‘specialized ribosomes’, whether or not they exist and if so, how they might be defined (98). We suggest that the highly flexible nature of these peripheral rRNA elements may function as receptors for RBPs, which may then function to direct ribosomes to specific locations within cells, or deliver specific mRNAs to the ribosome for translation. Such functionality would enable to ribosome to modulate its specific activity or substrate affinity in response to external stimuli, i.e. a mechanism to expand, target, and specialize ribosomes.
This work has produced a deep dataset that quantitatively maps rRNA flexibility changes through 8 different stages of the translation elongation cycle at an unprecedented single nucleotide level. In particular, the data presented in the supplemental tables serves as a unique resource to the ribosome structural biology community that can be computationally mined to complement ongoing research towards the goal of understanding the dynamic ribosome. We suggest that it will be particularly useful to those in the field of computational visualization of molecular assemblies. For example, as demonstrated in Supplementary Movie 1, these data can be used to map information flow through the ribosome, from the macro scale down to the single nucleotide level. Complementary to this, as validated in Supplementary Movie 2, empirically generated information provided here has been used to place additional limits on computational simulations of intraribosomal movements through the translation elongation cycle. This is particularly useful for in silico design of novel small molecule inhibitors of translation, a pressing need given the current crisis of multi-drug resistant microorganisms.
SUPPLEMENTARY DATA
Supplementary Data are available at NAR Online.
ACKNOWLEDGEMENTS
Generous allocation of computational resources on the super computer DALMA by NYU Abu Dhabi High Performance Computing is gratefully acknowledged.
FUNDING
National Institutes of Health [R01 GM117177, R01 GM058859 to to J.D.D.]; UMIACS New Research Frontiers Award; National Science Foundation [MCB 1413700 to K.Y.S. and S.K.; AD181 to S.K.]. The open access publication charge for this paper has been waived by Oxford University Press - NAR Editorial Board members are entitled to one free paper per year in recognition of their work on behalf of the journal.
Conflict of interest statement. None declared.
Present address: Suna P. Gulay, Laboratory of Gene Regulation and Development, National Institute of Child Health and Human Development, National Institutes of Health, Bethesda, MD 20892, USA.

Comments