


Abstract
Single-stranded DNA-binding proteins (SSBs) play a key role in genome maintenance, binding and organizing single-stranded DNA (ssDNA) intermediates. Multimeric SSBs, such as the human mitochondrial SSB (HmtSSB), present multiple sites to interact with ssDNA, which has been shown in vitro to enable them to bind a variable number of single-stranded nucleotides depending on the salt and protein concentration. It has long been suggested that different binding modes might be used selectively for different functions. To study this possibility, we used optical tweezers to determine and compare the structure and energetics of long, individual HmtSSB–DNA complexes assembled on preformed ssDNA and on ssDNA generated gradually during ‘in situ’ DNA synthesis. We show that HmtSSB binds to preformed ssDNA in two major modes, depending on salt and protein concentration. However, when protein binding was coupled to strand-displacement DNA synthesis, only one of the two binding modes was observed under all experimental conditions. Our results reveal a key role for the gradual generation of ssDNA in modulating the binding mode of a multimeric SSB protein and consequently, in generating the appropriate nucleoprotein structure for DNA synthetic reactions required for genome maintenance.
INTRODUCTION
Single-stranded DNA-binding proteins (SSBs) are components of every nucleic acid transaction that requires single-stranded intermediates. They bind preferentially to single-stranded DNA (ssDNA) with high affinity and in a sequence independent manner, protecting ssDNA from degradation and at the same time, defining the nucleoprotein substrate upon which other proteins must act (1). Moreover, SSB proteins interact physically with a broad array of genome maintenance proteins, targeting them to their sites of activity and stimulating their biochemical functions (2). The vast majority of SSB proteins present multiple sites to interact with ssDNA (i.e. OB folds) (3,4), which enable them to interact in vitro with a variable number of nucleotides depending on the experimental conditions (2). As shown for the Escherichia coli SSB (EcoSSB), these binding modes are reversibly interconvertible depending on the salt concentration and type, as well as protein binding density on the ssDNA (5–7).
Mitochondrial SSB (mtSSB) is a hallmark of replicating mitochondrial nucleoids; it is required to maintain the copy number of mtDNA (8–10) and plays crucial roles during the initiation (11,12) and elongation phases of mitochondrial DNA replication, covering the parental heavy strand and interacting functionally with the other components at the replication fork (13–17). In addition, mtSSB has been shown to facilitate packaging of mtDNA into nucleoid-like structures (18), modulate the level mtDNA transcription (19) and may be involved in the process of DNA repair (20). Thus, mtSSB is essential for mitochondrial function and in turn, for cell viability. Human mitochondrial SSB (HmtSSB) binds ssDNA as a tetramer composed of four identical 16 kDa subunits, with each subunit containing an OB-fold (21). The overall folding of the HmtSSB tetramer resembles that of EcoSSB, with which it shares a number of conserved residues within the amino-terminal region (22). Fluorescence titration study on polydT of HmtSSB showed apparent binding-site sizes of 50–70 nt per tetramer between 50 mM and 2 M NaCl (23), suggesting that the human protein may undergo salt-dependent binding mode transitions similar to those observed with EcoSSB. It has been suggested that because the properties of these wrapping modes differ significantly, they may be used preferentially in various DNA metabolic processes (2,7,24,25). Although indirect support for this proposal has been published (26–31), to date there is no direct experimental evidence to support which if any of these binding modes is selected preferentially when binding is coupled to the gradual generation of ssDNA during a DNA metabolic process, such as DNA replication.
Single-molecule force spectroscopy studies have proven useful to investigate the site size, equilibrium constants and energetics of the binding of various SSB proteins to ssDNA (32–37). Here, in order to determine the role of DNA synthesis in specifying the mode of HmtSSB binding to ssDNA, we used optical tweezers to measure and compare the elastic and energetic properties of long nucleoprotein complexes, either assembled on preformed ssDNA or assembled ‘in situ’ during synthesis at a dsDNA fork. The dynamics of long nucleoprotein–DNA complexes is especially relevant when studying HmtSSB, because long ssDNA intermediates may accumulate transiently during replication of the mitochondrial genome (38). Modeling of the force extension curves (FECs) of individual nucleoprotein complexes revealed the protein-binding mode, i.e. the average number of nucleotides wrapped per tetramer: when assembled on preformed ssDNA molecules, HmtSSB can bind to the ssDNA in two major modes, which depend on salt and protein concentration. However, when protein binding was coupled to DNA synthesis, only one of the two binding modes was observed under all experimental conditions. Our results reveal a key role for the gradual release of ssDNA during DNA synthesis in regulating the HmtSSB binding mode and consequently, on generating the appropriate nucleoprotein structure for subsequent replication of the displaced strand. Similarly, the progressive release of ssDNA during other DNA metabolic processes is expected to regulate the binding modes of prokaryotic and eukaryotic SSB proteins that expose multiple OB folds.
MATERIALS AND METHODS
Proteins and DNA constructs
Recombinant HmtSSB protein was prepared from bacterial cells as described previously (39,40). Bacteriophage Phi29 DNA polymerase was purified as described elsewhere (41). The DNA hairpins were prepared as follows. The main unwinding stem of the hairpin was synthesized by polymerase chain reaction amplification of a 2500 bp DNA segment of the bacteriophage Phi29 genome and subsequently digested with EcoRI and SalI restriction endonucleases. The SalI end was ligated to a self-annealing oligonucleotide forming a penta-loop (5΄-TCGAGCAGATGCAGCAATAACGTGCATCTGC-3΄). The EcoRI end was ligated to a 30 bp dsDNA linker labeled with biotin at the 5΄-end and with digoxigenin at the 3΄-end. The final length of the hairpin construct is 2540 bp. Digoxigenin labeling was described elsewhere (42,43).
To measure protein binding and the corresponding FECs at 300 mM NaCl and 50 mM NaCl/4 mM MgCl2, the hairpin was modified to include a 2686 bp DNA handle (pUC19 vector, Novagen, digested with PstI and BamHI restriction endonucleases) between the linker and digoxigenin label. To determine the binding of HmtSSB during DNA synthesis, the latter hairpin was modified further to include an abasic site at the penta-loop that forms the end of the hairpin.
Optical tweezers experiments
We used a counter propagating dual-beam optical tweezers instrument (44) to manipulate individual DNA hairpins tethered between an optically trapped anti-digoxigenin-coated bead and a streptavidin-coated bead immobilized on top of a micropipette. To measure HmtSSB binding to preformed ssDNA, the DNA hairpin was mechanically opened by gradually applying increasing force to the ends of the complementary strands. Unwinding of the hairpin was performed in the presence of 250 nM oligonucleotide complementary to the region at the apex of the hairpin (5΄-GCCGATGCACGTTATTCGTGCATCGGCTCG-3΄). Once the hairpin was opened (F ∼19 pN), hybridization of the oligonucleotide at the apex generated a large kinetic barrier to hairpin re-annealing when tension is released, providing a method to measure the force-extension curve for the resulting 5080 ssDNA (45). The oligonucleotide binds specifically to the apex of the hairpin and contributes ≤0.6% to the final length of the molecule. Therefore, we considered it has no significant effect on the final extension of the FECs. After washing out the oligonucleotide, the HmtSSB protein was introduced inside the flow cell after dilution to 5, 10, 50, 100 or 200 nM in the appropriate reaction buffer. The reaction buffers contained 50 mM Tris–HCl, pH 7.5, 2 mM Dithiothreitol (DTT) and 10, 50, 100 or 300 mM of NaCl and 4 mM MgCl2 when indicated. To determine the DNA unwrapping and protein detachment forces, the nucleoprotein complexes were assembled as described above using 10 or 100 nM of HmtSSB diluted in reaction buffers containing 10, 50 or 300 mM of NaCl, 50 mM NaCl plus 4 mM MgCl2 or 300 mM NaCl plus 4 mM MgCl2.
To determine the binding of HmtSSB during DNA synthesis, reactions were performed in buffers containing 50 mM Tris–HCl, pH 7.5, 2 mM DTT, 50 mM NaCl, 4 mM MgCl2, 50 μM dNTPs, 2 nM Phi29 polymerase in the presence of 5, 50, 100 or 200 nM HmtSSB.
Both, HmtSSB binding to preformed ssDNA and to ssDNA gradually generated during DNA synthesis were monitored at 60 Hz at 22 ± 1°C in the ‘constant force feedback’ mode, in which the distance between the beads was adjusted to maintain a constant tension in the DNA (F = 3 ± 1 pN). In all cases, after completion of the binding reaction, the excess of HmtSSB was washed out from the chamber with the corresponding reaction buffer. Finally, the FEC of the HmtSSB–DNA complex was obtained by pulling the complex at a rate of 200 nm/s. Overall we tested over 30 different experimental conditions and collected 5–10 FECs per condition.
Data analysis
The FECs of bare ssDNA were fit with the freely-jointed-chain model (FJC) and the extensible worm-like-chain models (XWLC) of polymer elasticity (46) (Figure 1 and Supplementary Figure S1). The amount of secondary structure formation on the ssDNA as a function of mechanical tension at each salt type and concentration was calculated according to Bosco et al. (45) (Supplementary Figure S2). The extension per nucleotide of the free ssDNA, XssDNA(F) in Equation (1), was obtained directly from the experimental FECs of the ssDNA at each salt type and concentration. The total extension of hybrid molecules containing dsDNA and ssDNA segments is given by the sum of the extensions of their dsDNA and ssDNA portions at each tension (33,42) (Supplementary Figure S3).

Binding of HmtSSB to preformed ssDNA molecules. (A) Schematic of the experimental setup. The complementary strands of a DNA hairpin (2540 bp) were tethered between an optically trapped bead (gray) and a bead on top of a micropipette (black) (Materials and Methods). Mechanical unwinding of the DNA hairpin in the presence of a 30-mer oligonucleotide (Oligont, red line) complementary to the loop end prevents re-winding of the hairpin at low forces, providing a method to manipulate long ssDNA molecules. At constant force (∼3 pN), wrapping of ssDNA by HmtSSB decreases the distance between the beads (Δx). The final product of the reaction is a 5080-nt long ssDNA–HmtSSB complex. Alternatively, a DNA hairpin containing a dsDNA handle at the 3΄ end was used to measure the FECs at 300 mM NaCl and 50 mM NaCl/4 mM MgCl2 (Materials and Methods). (B) Independent traces showing the change in extension (Δx in nm/nt) with time due to protein binding to the ssDNA (50 nM HmtSSB and 50 mM NaCl). Traces were shifted along the time axis for clarity of display. (C) Experimental FECs of protein–DNA complexes assembled under varying protein concentrations, salt concentrations and type. For all panels red and blue curves correspond to the stretching FECs of protein–DNA complexes assembled at the indicated protein concentrations (nM). Two FECs per protein concentration condition are shown. Light red and light blue curves correspond to the initial ssDNA FECs under each condition. Dashed black line corresponds to the WLC model for ssDNA elasticity with a persistence length of 0.75 nm and stretch modulus of 800 pN.
Calculation of the HmtSSB-ssDNA wrapping free energy
The average work to unwrap 1 nt from each tetramer, ΔGw, in pN·nm, was converted to kBT units (Boltzmann constant multiplied by the absolute temperature) using the relationship kBT = 4.11 pN·nm at 25°C, which corresponds to the energy contribution from thermal fluctuations.
Calculation of the DNA synthesis rate
The number of nucleotides incorporated by the Phi29 DNA polymerase as a function of time was obtained by dividing the observed distance change between the beads by the average change in extension at a given tension accompanying the generation of one new base pair and either one free nucleotide (in the absence of HmtSSB) or one HmtSSB-bound nucleotide (43) (Supplementary Figure S8). The average rates were determined by a line fit to the traces showing the number of replicated nucleotides versus time.
RESULTS
Force extension curves of HmtSSB–DNA complexes assembled on preformed ssDNA molecules vary with solution conditions
We first studied the mechanical properties of individual protein–DNA complexes assembled on preformed ssDNA molecules. We used the optical tweezers to unwind a single DNA hairpin of 2540 bp in the presence of a 30-mer oligonucleotide complementary to the loop region of the hairpin, Figure 1A (see ‘Materials and Methods’ section). Once the hairpin is fully unwound (F ∼19 pN), the specific annealing of the oligonucleotide to the loop region prevents the re-winding of the hairpin as tension is released, providing a method to measure the FEC of the resulting 5080-nt long ssDNA (Supplementary Figure S1) (45). After washing out the oligonucleotide, HmtSSB diluted in an appropriate reaction buffer was passed inside the flow cell (see below). We monitored at low constant forces (∼3 ± 1 pN) the end-to-end distance change of the tethered ssDNA as the HmtSSB protein bound to and organized the ssDNA (Δx, Figure 1B). This low force range was chosen to minimize the potential effect of mechanical tension on the wrapping state of the ssDNA around the HmtSSB tetramers (33). Once equilibrium was reached (when no further distance changes were observed, Figure 1B), excess HmtSSB was washed out of the flow cell (so that no protein rebinding is then expected) and tension was initially decreased to zero and then increased to 30–40 pN, in order to obtain the final FEC of the HmtSSB–DNA complex (Figure 1C).
Because the HmtSSB binding mode may depend on salt and protein concentration (23,39), the nucleoprotein complexes were assembled in reaction buffers containing variable levels of NaCl (10, 50, 100 and 300 mM), NaCl and MgCl2 (50 and 4 mM, respectively) and HmtSSB concentrations (5, 10, 50, 100 and 200 nM). We then tested ∼25 different combinations, each presenting a specific ratio of HmtSSB and salt concentration ([SSB]/[NaCl]), which is a measurement of the number of protein tetramers per ion in solution. For all experimental conditions, the stretching FECs of the HmtSSB–ssDNA complexes displayed an entirely different extension as compared to the absence of protein, resulting from the organization of the ssDNA by HmtSSB. Their overall shape depends on the salt concentration and type and on HmtSSB concentration (Figure 1C). As described previously in bulk studies, we did not observe any evidence supporting HmtSSB aggregation under our current experimental conditions (39,47).
We note that for conditions that shortened significantly the end-to-end distance of the ssDNA at low tension (300 mM NaCl or 4 mM MgCl2, Figure 1C and Supplementary Figure S2), we included a long dsDNA handle of ∼1 μm on the 3΄-end of the hairpin (see ‘Materials and Methods’ section) to prevent non-specific protein–DNA-bead interactions that might interfere with the determination of the FECs. The dsDNA handle does not affect the elastic properties of the ssDNA (33,42) (Supplementary Figure S3). At the highest protein concentration used in this work (200 nM), mammalian mtSSBs proteins do not bind dsDNA (48).
Forces promoting overall DNA unwrapping and protein detachment
Evaluation of the intrinsic elastic properties of the HmtSSB–ssDNA complexes is required to determine the HmtSSB–ssDNA binding mode under each experimental condition. Although contained within the FECs, this information is combined with DNA unwrapping and protein detachment events that take place as tension is increased (33,34). To determine the forces promoting DNA unwrapping (Fu) and protein detachment (Fd), and to identify the region of the FECs that reflect the intrinsic elastic properties of the complex, we performed the following experiments. Individual protein–DNA complexes, assembled as described above under varying salt and protein concentrations (see ‘Material and Methods’ section), were subjected to a series of stretch–relax cycles in which force was increased by 1–2 pN in each consecutive cycle (Supplementary Figure S4).
Under all experimental conditions, the stretching and relaxing FECs were reversible for tensions below 5 ± 1 pN (Figure 2A, left curve); above these force values hysteresis events were observed. The minimum force triggering the overall unwrapping (Fu) was determined as the average force value above which the stretch–relax cycle presented hysteresis, but consecutive stretching cycles exhibited the same, original extensions (Figure 2A, central curve). Because these experiments were performed in the absence of free protein in solution, the recovery of the initial stretching cycle indicates there is no net protein detachment, whereas the presence of hysteresis indicates that overall unwrapping is significant at tensions around Fu. The minimum force that begins to promote protein detachment (Fd) was determined as the average force value above which consecutive stretching cycles show different extensions. When force is increased above Fd, the second stretching cycle is longer than the first, indicating that several HmtSSB tetramers have detached from the ssDNA (Figure 2A, right curve).
![Determination of DNA unwrapping (Fu) and protein detachment (Fd) forces. (A) Representative (not sequential) stretch–relax cycles of a HmtSSB–DNA complex assembled at 50 mM NaCl/100 nM HmtSSB. For all plots, after initial stretching (red curve or P1) the force was relaxed back to ∼0 pN (black curve or R) and then was increased again (blue curve or P2) to a force 1–2 pN above the initial stretching force. Under all experimental conditions, the FECs exhibit a reversible region (P1= R= P2). Above a critical force (see below), hysteresis between the stretching and relaxing curves was observed (highlighted in green and purple). Hysteresis is indicative of DNA unwrapping when the stretching curves have the same extension (P1= P2≠ R) and of protein detachment when the sequential stretching curves show different extensions (P1≠ P2≠ R). Schematic of the expected events along the pulling axis (F) is shown on top. HmtSSB is represented as a brown tetramer. (B) Dependencies of Fu (open blue symbols) and Fd (black symbols) on the [SSB]/[NaCl] ratio. Red symbols represent data obtained under reaction conditions containing 50 mM NaCl plus 4 mM MgCl2. Fu and Fd were obtained from the analysis of the areas of hysteresis (Supplementary Figure S4). Error bars represent standard error (s.e.). Solid lines represent a fit to the data with a two-state function (Supplementary Figure S4).](https://oup.silverchair-cdn.com/oup/backfile/Content_public/Journal/nar/45/12/10.1093_nar_gkx395/1/m_gkx395fig2.jpeg?Expires=1750317236&Signature=qrBtmx2g5dc24rDjg5LFnyFHknKFZioojSxSYObJN-cRVEtzqZKiH0uGk71ESUOlvItgZ00lAlSr8JipiXheWtLylqgnddYSgWww4mduTIuXVoSQG4QRYkuoMF2P6iFZcggZ0RI-6nlih0wEO2SIpZAxYcfJhc8WGzbbIAw4n51gihAfzk58I5E930-1ZX08w~Xc~HyphocgWuM9GjEAoYumR2Gtue6u7dRfly2aWoHUg55FyDJlbCEIKql9S2MfnjzkGXMqhDTLg9KPWd4YbWibtWoA8eezZUTY0Sadyp0AmeF~39YO1v2Y~V3s4tpnD~uAeI9S3dlEKoVSp11n3A__&Key-Pair-Id=APKAIE5G5CRDK6RD3PGA)
Determination of DNA unwrapping (Fu) and protein detachment (Fd) forces. (A) Representative (not sequential) stretch–relax cycles of a HmtSSB–DNA complex assembled at 50 mM NaCl/100 nM HmtSSB. For all plots, after initial stretching (red curve or P1) the force was relaxed back to ∼0 pN (black curve or R) and then was increased again (blue curve or P2) to a force 1–2 pN above the initial stretching force. Under all experimental conditions, the FECs exhibit a reversible region (P1= R= P2). Above a critical force (see below), hysteresis between the stretching and relaxing curves was observed (highlighted in green and purple). Hysteresis is indicative of DNA unwrapping when the stretching curves have the same extension (P1= P2≠ R) and of protein detachment when the sequential stretching curves show different extensions (P1≠ P2≠ R). Schematic of the expected events along the pulling axis (F) is shown on top. HmtSSB is represented as a brown tetramer. (B) Dependencies of Fu (open blue symbols) and Fd (black symbols) on the [SSB]/[NaCl] ratio. Red symbols represent data obtained under reaction conditions containing 50 mM NaCl plus 4 mM MgCl2. Fu and Fd were obtained from the analysis of the areas of hysteresis (Supplementary Figure S4). Error bars represent standard error (s.e.). Solid lines represent a fit to the data with a two-state function (Supplementary Figure S4).
Analysis of the stretch–relax cycles showed that both Fu and Fd increase as the [SSB]/[NaCl] ratio increases (Figure 2B and Supplementary Figure S4). A fit to the data with a two-state function indicates that a change in the [SSB]/[NaCl] ratio from ∼0.5·106 to 1·106 increased abruptly the values of Fu and Fd (Figure 2B). At low protein concentrations and/or high NaCl concentrations (lowest [SSB]/[NaCl] ratios) overall unwrapping and protein detachment begin at force values of Fu ∼6 pN and Fd ∼8 pN, respectively, whereas as protein concentration increases and/or NaCl concentration decreases (highest [SSB]/[NaCl] ratios), unwrapping and detachment events are separated by a wider force range, Fu ∼9 pN and Fd ∼14 pN, respectively. Interestingly, the values obtained for Fu and Fd agree well with the average forces reported previously to unwrap and detach a single EcoSSB tetramer from ssDNA, 3–8 pN and ∼10 pN, respectively (33,34). These similarities suggest strongly that for both SSBs mechanical tension has a very similar effect on the overall organization of the DNA around the protein tetramer. We note that for all experimental conditions stretching forces above 30–40 pN are required to detach all HmtSSB tetramers from the ssDNA (Supplementary Figure S4).
In composite, these experiments indicate that within the 0–5 pN force range, the FECs reflect the intrinsic mechanical properties of the protein–DNA complexes at each experimental condition. The absence of hysteresis within this force range, even at salt type and concentrations promoting the formation of secondary structure on ssDNA (Supplementary Figure S2), supports the conclusion that HmtSSB removes all or most of the salt-induced secondary structure from the ssDNA and that the protein–DNA complexes are at equilibrium. Elimination of salt-induced hysteresis of individual, long ssDNA molecules by E. coli SSB binding has also been reported recently (32).
Salt and protein concentration modulate the HmtSSB binding mode to preformed ssDNA molecules
![HmtSSB binding modes to preformed ssDNA molecules. (A) Schematic representation of the effective organization of HmtSSB–DNA complex (see main text); individual HmtSSB tetramers are shown as a group of four spheres. The extension of the protein–DNA complex under force, Xcomplex (F), is given by the sum of extensions of the protein-bound, δ·Xprot(F) and unbound, (1-δ)·XssDNA(F), sections of the complex (Equation 1), where δ is the fraction of ssDNA covered by the protein. Nnt, blue line, is the average number of wrapped nucleotides per tetramer. Lends is the effective physical size of an individual tetramer–DNA complex, 5≤ Lends≤ 8 nm. For a fixed Lends, fits to the equilibrium FECs of the protein–DNA complex with Equation (1) rendered the values of Nnt and δ for all experimental salt and protein concentrations. (B) Dependence of Nnt (nt/ tetramer) on HmtSSB concentration ([SSB] nM) for all salt conditions studied (Lends= 6 nm). (C) Dependence of Nnt on the [SSB]/[NaCl] ratio for Lends= 6 nm. (D) Dependence of ssDNA coverage (δ) on the [SSB]/[NaCl] ratio for Lends= 6 nm. For (B), (C) and (D) error bars represent s.e. and red symbols represent the data obtained for complexes assembled in the presence of 50 mM NaCl plus 4 mM MgCl2 (which are relevant for Figure 4). Two statistically different Nnt values prevail, indicating that HmtSSB can bind to preassembled ssDNA in a low (HmtSSBL, light blue area) and a high (HmtSSBH, light red area) site size binding modes. Colored areas represent the site sizes (and standard deviations) of each binding mode after averaging the site sizes values obtained for each Lends (Table 1). Supplementary Figure S7 shows the Nnt and δ values obtained with Lends= 5, 7 and 8 nm.](https://oup.silverchair-cdn.com/oup/backfile/Content_public/Journal/nar/45/12/10.1093_nar_gkx395/1/m_gkx395fig3.jpeg?Expires=1750317236&Signature=JWDIwf-w2yWzHnda2tSWLHz4lKD6vLKgS4u4sFaOMfGLE--TJ0Pek1CznGovohFrXJxYWxs58YrSKgnVO93YhwUfyYUpY7ai7CLkiUo7CcgXljo-WJYqSMK21FvpLYjtdESy0MV13rYNL39zPdsjYu47GO7Ivg9GWc6ZM2IER6DsO-kcgwskbx4K5x7I1rFgSTVcxiec410b5XKH8JWHDb1QD5hjIFkhTJ~vfDiqfm8LTNxdMq0v-fObkN6XRtqlx0y8Q~-78ih2Cmg24AeaWVrYZPCXFBvNZAkFE9QSH9EtA7LpDHTCOZ9s2vZRzmpXcikYEzhMpEjNv~ADOYfyCQ__&Key-Pair-Id=APKAIE5G5CRDK6RD3PGA)
HmtSSB binding modes to preformed ssDNA molecules. (A) Schematic representation of the effective organization of HmtSSB–DNA complex (see main text); individual HmtSSB tetramers are shown as a group of four spheres. The extension of the protein–DNA complex under force, Xcomplex (F), is given by the sum of extensions of the protein-bound, δ·Xprot(F) and unbound, (1-δ)·XssDNA(F), sections of the complex (Equation 1), where δ is the fraction of ssDNA covered by the protein. Nnt, blue line, is the average number of wrapped nucleotides per tetramer. Lends is the effective physical size of an individual tetramer–DNA complex, 5≤ Lends≤ 8 nm. For a fixed Lends, fits to the equilibrium FECs of the protein–DNA complex with Equation (1) rendered the values of Nnt and δ for all experimental salt and protein concentrations. (B) Dependence of Nnt (nt/ tetramer) on HmtSSB concentration ([SSB] nM) for all salt conditions studied (Lends= 6 nm). (C) Dependence of Nnt on the [SSB]/[NaCl] ratio for Lends= 6 nm. (D) Dependence of ssDNA coverage (δ) on the [SSB]/[NaCl] ratio for Lends= 6 nm. For (B), (C) and (D) error bars represent s.e. and red symbols represent the data obtained for complexes assembled in the presence of 50 mM NaCl plus 4 mM MgCl2 (which are relevant for Figure 4). Two statistically different Nnt values prevail, indicating that HmtSSB can bind to preassembled ssDNA in a low (HmtSSBL, light blue area) and a high (HmtSSBH, light red area) site size binding modes. Colored areas represent the site sizes (and standard deviations) of each binding mode after averaging the site sizes values obtained for each Lends (Table 1). Supplementary Figure S7 shows the Nnt and δ values obtained with Lends= 5, 7 and 8 nm.
Interestingly, for each Lends, two statistically different Nnt values prevailed depending on salt and protein concentrations, indicating that HmtSSB can bind to preassembled ssDNA in at least two different binding modes; a low site-size, HmtSSBL and a high site-size, HmtSSBH, binding modes (Figure 3B and C, Supplementary Figure S6 and Table S1). Similar to the behavior described for the EcoSSB (7,50,51), the low site-size binding mode dominates at the lowest NaCl concentrations studied (10 mM) and/or highest [SSB]/[NaCl] ratios ([SSB]/[NaCl] > 0.5–1·106), while the high site-size mode prevails at the highest NaCl concentrations (300 mM) and/or lowest [SSB]/[NaCl] ratios ([SSB]/[NaCl] < 0.5–1·106). At intermediate and near physiological salt concentrations the binding mode depends mainly on the HmtSSB concentrations, with the HmtSSBL mode prevailing at protein concentrations higher than ∼50–100 nM. Therefore, as expected for a protein that can bind to a long ssDNA in two modes, the lower site-size mode is favored at high protein-binding densities, because more protein can be bound to the ssDNA in this mode. We note that the average number of nucleotides wrapped per tetramer (Nnt) in each binding mode depends on the Lends values considered in the fits (Figure 3B and Supplementary Figure S7). All possible values for Nnt in each binding mode are summarized in Table 1. According to our results, on average and for all Lends, HmtSSB binds ∼30% fewer nucleotides per tetramer in the HmtSSBL binding mode than in the HmtSSBH binding mode. The average values obtained for Nnt are compatible to the apparent binding-site sizes on poly(dT) oligonucleotides as a function of salt concentration described previously in bulk studies for HmtSSB (50 and 70 nt/tetramer) (23), Drosophila melanogaster mtSSB (68–120 nt/tetramer) (52) and EcoSSB (35 and 65 nt/tetramer) (50) (Table 1).
Average number of nucleotides wrapped per tetramer in each binding mode for different Lends values
 |
|
|
|
Our data also show that at the highest [SSB]/[NaCl] ratios the HmtSSB occupies ≥90% of the ssDNA molecule and it is thus, expected to form long protein clusters along the DNA under conditions in which binding in the HmtSSBL mode prevails (Figure 3D). By contrast, the protein coverage decreases to ∼70% at the lowest [SSB]/[NaCl] ratios in which the HmtSSBH binding mode dominates (Figure 3D). In contrast to Nnt, protein coverage does not significantly change with the Lends values considered in the fits (Supplementary Figure S7).
Co-replicational binding of HmtSSB to ssDNA promotes the low site-size binding mode for all experimental conditions studied
Motivated by the pivotal role of HmtSSB during mtDNA replication, we designed a set of experiments to determine whether a specific HmtSSB binding mode is used preferentially when the ssDNA is gradually generated in the 5΄–3΄ direction during the process of DNA synthesis. For these experiments we used the DNA hairpin containing the dsDNA handle, which provides a free 3΄-end for DNA polymerase loading, modified with an abasic site at the loop end (Figure 4A and see ‘Materials and Methods’ section). Except for the abasic modification, this is the same hairpin we used to measure HmtSSB binding to preassembled ssDNA in the presence of MgCl2 (50 mM NaCl/4 mM MgCl2).
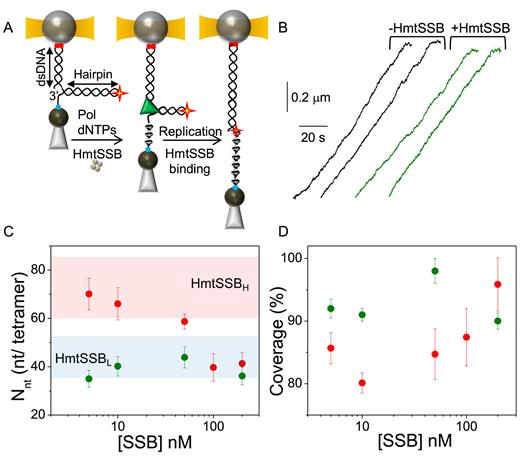
Co-replicational binding of HmtSSB to ssDNA. (A) Schematic of the experimental set-up. The DNA hairpin containing a dsDNA handle (2686 bp) was modified with an abasic site at the loop apex (red star) and attached between the beads in the optical tweezers (see ‘Materials and Methods’ section). Strand displacement DNA synthesis activities were performed using the Phi29 DNA polymerase (green triangle) and initiated at F∼3pN in the presence of varying HmtSSB (brown tetramer) concentrations. As replication proceeds the displaced ssDNA strand is gradually covered by the HmtSSB. Strand displacement synthesis terminates at the abasic site, yielding a hybrid DNA molecule with 5226 bp of dsDNA and 2540 nt of ssDNA gradually covered by the HmtSSB (see also Supplementary Figure S8). After subtraction of the dsDNA contribution (Supplementary Figure S3), fits with Equation (1) to the equilibrium FECs of the protein–DNA complexes obtained under these conditions rendered, for a fixed Lends, the values of the average number of wrapped nucleotides per tetramer, Nnt and the fraction of ssDNA covered by the protein (δ) for all HmtSSB concentrations. (B) Independent replication traces without (black) and with (green) HmtSSB in solution (50 nM). Each trace represents the real-time change in distance (∼30 nt/s) associated with the full replication of the hairpin at F∼3 pN. (C) Dependence of Nnton HmtSSB concentration for Lends= 6 nm. Colored areas represent the approximated average site sizes (see Figure 3). (D) Dependence of ssDNA coverage (δ) on HmtSSB concentration for Lends= 6 nm. For (C) and (D) green symbols represent the Nntand δ values obtained for protein–DNA complexes assembled during DNA synthesis and red symbols represent the Nntand δ values for complexes assembled on preformed ssDNA. For both conditions the salt concentration was 50 mM NaCl/4 mM MgCl2 and the HmtSSB concentration 5, 10, 50 100 or 200 nM. For all plots error bars represent s.e. See Supplementary Figure S7 for Nnt and δ values obtained with Lends = 5, 7 and 8 nm.
For replication of the hairpin we chose the bacteriophage Phi29 DNA polymerase because its properties as a hybrid polymerase-helicase (53,54) allows synthesis through the full length of the hairpin without dissociation, until it reaches the abasic site located at the end loop, which inhibits further replication of the displaced strand (43) (Figure 4A and Supplementary Figure S8). Strand displacement synthesis was performed at 50 mM NaCl/4 mM MgCl2 and increasing HmtSSB concentrations (5, 10, 50 and 200 nM), at forces ∼3 pN. After completion of DNA synthesis and before measuring the resulting FECs the excess of free HmtSSB in solution was washed out of the flow cell. Interestingly, individual DNA synthesis trajectories did not show significant pauses and/or sudden distance changes, either with or without HmtSSB in solution, suggesting a gradual binding of HmtSSB to the ssDNA as it is released at an average rate of ∼30 nt/s (Figure 4B and Supplementary Figure S8). The final product of the reaction is a hybrid DNA molecule containing 5226 bp of dsDNA and 2540 nt of ssDNA that becomes covered gradually by the HmtSSB. Representative FECs of protein–DNA complexes obtained under these conditions are shown in Supplementary Figure S8.
For these experiments, the extension per nucleotide of the ssDNA protein-covered region at each force (Xcomplex (F) in Equation 1) was obtained by subtracting from the total extension of the molecule the extension of the dsDNA portion at each force (Supplementary Figure S3). As described above, for a fixed Lends, fits with Equation (1) to the 0–5 pN region of these FECs rendered the average number of nucleotides wrapped per tetramer (Nnt) and the protein coverage (δ) for all protein concentrations. In sharp contrast to the results obtained under the same protein concentrations and salt type (4 mM MgCl2 and 50 mM NaCl) on preassembled ssDNA, the average number of nucleotides wrapped per tetramer (Nnt) and the protein coverage (δ) do not change with the protein concentration. Instead, in all cases, HmtSSB binds preferentially in the low site-size binding mode, HmtSSBL, covering almost entirely the released ssDNA (δ ∼95%, Figure 4C and D). Identical behaviors were observed for Lends values between 5 and 8 nm (Supplementary Figure S7). The average binding site-sizes obtained for each Lends are summarized in Table 1. These results indicate that the unidirectional and gradual release of ssDNA at a rate of ∼30 nt/s ultimately determines the wrapping mode of HmtSSB along the nascent ssDNA at the experimental conditions under study.
HmtSSB–ssDNA binding energy
The FECs reflect the work required to extend the protein–DNA complexes, and thus can be used to calculate the HmtSSB–ssDNA wrapping energy. To calculate the average Gibbs energy required to unwrap 1 nt from each tetramer (ΔGw), the area between the protein-bound and the relaxing free ssDNA FECs was divided by the total number of nucleotides, and corrected by the protein coverage values calculated previously for each experimental condition. The relaxing curve was used instead of the stretching free ssDNA curve to avoid the energetic contribution of long-range ssDNA secondary structure induced by salt (32) (Supplementary Figure S2). Under our experimental conditions (pH = 7.5 and 22°C) and within our experimental error, ΔGw does not depend on HmtSSB concentration (Supplementary Figure S9). However, ΔGw decreases linearly with NaCl concentrations from ΔGw∼0.7 ± 0.1 kBT/nt at 10 mM NaCl to 0.4 ± 0.1 kBT/nt at 300 mM NaCl (Figure 5).

HmtSSB–ssDNA binding energy. Gibbs energy required to unwrap 1 nt from each HmtSSB tetramer as a function of NaCl concentration (mM), ΔGw(in kBT/nt, see ‘Materials and Methods’ section), for 5 (black), 50 (blue), 100 (magenta) and 200 (cyan) nM HmtSSB. Red line represents a linear fit to the data taken at 10, 50, 100 and 300 mM NaCl (R2 = 0.84, slope = −0.001 ± 0.0001 kBT/(nt·M)). Red and green symbols show the ΔGwvalues for protein–DNA complexes assembled at 50 mM NaCl plus 4 mM MgCl2 on preformed ssDNA (red) or during DNA replication (green) at 5, 10, 50 and 200 nM HmtSSB concentrations. Error bars represent s.e.
Interestingly, the presence of 4 mM MgCl2 (50 mM NaCl plus 4 mM MgCl2) decreases ΔGw by ∼30%, ΔGw ∼0.45 kBT/nt (Figure 5). The decrease of ΔGwwith salt concentration and type highlights the importance of electrostatic interactions to stabilize the HmtSSB–ssDNA complexes and reflects the higher affinity of Mg2+ over Na+ ions for the ssDNA. The ΔGw values found for HmtSSB (ΔGw ∼0.4–0.7 kBT/nt) are within the range but significantly higher than those reported for EcoSSB protein under similar experimental conditions, where ΔGw is ∼0.13–0.42 kBT/nt (32–34). These differences may be due to an increased number of aromatic residues in the HmtSSB protein (16 for the HmtSSB versus 13 for the EcoSSB), which may favor hydrophobic interactions with ssDNA bases and/or the fact that the mitochondrial protein lacks the flexible acidic C-terminus of EcoSSB, which may provide additional steric hindrance and electrostatic repulsion for ssDNA binding by EcoSSB (5). However, as binding affinities can only be meaningfully compared under identical solution conditions (7), we cannot rule out that the observed differences in ΔGw between the two proteins may arise from the different experimental conditions used in each study. We did not observe significant differences in ΔGw for either binding mode (Supplementary Figure S9).
DISCUSSION
We used optical tweezers and theoretical modeling to interrogate the structure and energetics of different binding modes of HmtSSB to long, preformed ssDNA molecules and to determine the prevailing binding mode when protein binding is coupled to a DNA metabolic process, such as DNA replication, in which gradual ssDNA generation and protein binding occur concomitantly.
Despite the uncertainty of the end-to-end distance of the DNA wrapped around each tetramer (5 nm ≤ Lends ≤ 8 nm), our data indicates clearly that HmtSSB protein binds preferentially in at least two statistically different modes to long, preformed ssDNA molecules depending on the protein and salt concentration (Table 1 and Supplementary Table S1): the low site-size binding mode or HmtSSBL and the high site-size binding mode or HmtSSBH. On average, the HmtSSBL binding mode binds ∼30% fewer nucleotides per tetramer than the HmtSSBH binding mode. We note that at conditions close to where the transition between modes occurs, we cannot discern the coexistence of the two binding modes along the same ssDNA molecule (i.e. [SSB]/[NaCl]∼ 0.5–1·10−6, Figure 3C and Supplementary Figure S6).
Interestingly, the salt and protein concentration dependencies found in our work for the HmtSSBL binding mode are strikingly similar to those described for the EcoSSB low site-size binding mode (EcoSSB35), suggesting that the HmtSSBL may be the structural equivalent of the EcoSSB35 mode. For example, HmtSSBL, prevailed at the lowest NaCl concentrations (10 mM) and at the highest protein binding densities as described previously for EcoSSB35 (2,7). In contrast, HmtSSBH binding mode found in our work prevails at the highest NaCl concentrations (300 mM) and at the lowest protein binding densities, indicating that it may be the structural equivalent of the EcoSSB high site-size binding mode (EcoSSB65 or EcoSSB56), which prevails at identical salt and protein concentrations (2,7). In fact, if the lowest Lends value (Lends= 5 nm) were to reflect the actual structural organization of the protein–DNA complex (as explained in Supplementary Figure S7), the average binding site sizes expected for HmtSSBL and HmtSSBH, ∼31 and 53 nt/tetramer, respectively, would be remarkably similar to those described for EcoSSB35 and EcoSSB56 (Table 1). We note that as force is likely shifting the DNA ends toward the opposite sizes of the tetramer (33), the actual average number of nucleotides wrapped per tetramer in the absence of force would probably be higher than reported for both binding modes.
Our data also indicates that at conditions favoring the lower site-size binding mode, HmtSSBL, the protein covers ∼90% of ssDNA, which is about 20% more than under conditions favoring the higher site-size binding mode HmtSSBH (compare Figure 3C and D). Interestingly, previous transmision electron microscopy (TEM) and atomic force microscopy (AFM) studies on EcoSSB–DNA complexes showed qualitatively a similar coverage behavior for the EcoSSB binding modes (28,55,56): EcoSSB35 produced ‘smooth-contoured’ protein–DNA complexes homogeneously covering the full length of ssDNA, while EcoSSB65 appeared distributed along the DNA in ‘beads’ leaving free ssDNA gaps. Together with the similar biochemical and structural properties between HmtSSB and EcoSSB, these results suggest that the same principle is followed in bacteria and mitochondria of higher organisms to perform the function of ssDNA binding during DNA metabolic processes.
Interestingly, we also observed that under near-physiological salt conditions (including MgCl2), in which protein binding to ssDNA is coupled to replication of a dsDNA fork, the HmtSSBL binding mode is selected over the HmtSSBH mode for all HmtSSB concentrations studied. A possible explanation for this result is that the gradual generation of ssDNA limits the amount of ssDNA available at any time, increasing the effective protein concentration (or in other words, increasing the HmtSSB to ssDNA binding stoichiometry) which in turn, favors the low site-size binding mode. Replication of the mitochondrial genome proceeds in vivo at a rate of ∼10 nt/s (12), which is comparable to the DNA synthesis rate measured in our experiments (∼30 nt/s). Therefore, it is tempting to speculate that the described effect of the gradual release of ssDNA on the HmtSSB binding mode would also occur during in vivo replication of the mtDNA. The HmtSSB concentration in vivo ranges from 19 nM to 762 μM, depending on physiological conditions and cell type (15,57,58). Our data show that if binding were to occur on free or preformed ssDNA, HmtSSB would bind in the HmtSSBH mode under conditions in which HmtSSB concentrations are <50 nM and in the HmtSSBL mode at conditions where protein concentrations are >50 nM (Figure 3B and Supplementary Figure S6). However, because binding to ssDNA is expected to occur coupled to DNA replication, according to our data the slow rate of the mtDNA replication reaction in vivo would ensure binding of HmtSSB in the low site-size mode under all different physiological conditions and cell types. According to our results (Figure 4D) and to previous AFM images on mouse mitochondrial replicative intermediates (59) this binding mode is expected to result in almost full coverage of the parental heavy strand, providing the optimal substrate organization for its subsequent replication by the mitochondrial replicative holoenzyme, Polγ. Notably, stimulation of Polγ activity by HmtSSB has been shown recently to depend on the overall structure of the HmtSSB–ssDNA complexes (39). To date there is no experimental evidence for cooperative binding of the HmtSSB to the ssDNA (note that HmtSSB lacks the C-terminal tail of EcoSSB that is required for inter-tetramer cooperativity (5)), suggesting that cooperative binding may not be required for HmtSSB to cover entirely the ssDNA molecule in the low site-size binding mode. Furthermore, the low average work required to unwrap 1 nt from each tetramer under physiological conditions, ΔGw ∼0.45 kBT/nt, would facilitate the sequential unwrapping of the ssDNA template from the HmtSSB tetramer by Polγ.
In this study, we used a heterologous system (hmtSSB and Phi29 phage DNA polymerase) and therefore, modulation of the binding mode by specific polymerase–SSB interactions is not expected. In fact, HmtSSB does not stimulate the strand displacement activity of the Phi29 DNA polymerase (Supplementary Figure S8). At the mtDNA fork HmtSSB interacts functionally with both the DNA polymerase and replicative helicase enhancing their activities (10,13,14,16,17). The nature of these interactions is not well understood and their possible role in modulating the HmtSSB binding mode remains to be addressed. Our data suggests that the HmtSSBL binding mode may prevail during mtDNA replication. However, we cannot exclude the possibility that HmtSSBH, may be favored under other DNA metabolic processes generating ssDNA either at a much faster rate or involving specific protein–protein interactions.
SSB proteins are central players in genome biology. Bacterial and eukaryotic SSBs have multiple binding modes that may be used selectively in different cellular processes. Our results indicate that under physiological conditions, the gradual generation of ssDNA during DNA synthesis may play a key role in modulating the binding mode of the HmtSSB to the displaced ssDNA. Similarly, it is tempting to speculate that the gradual release of ssDNA during other DNA metabolic processes may regulate the binding modes of other SSB proteins that expose multiple OB folds. Our characterization of the elastic properties of single HmtSSB–DNA nucleoprotein complexes provides the basis for future mechano-chemical, single molecule studies of the human mtDNA replication machinery.
SUPPLEMENTARY DATA
Supplementary Data are available at NAR Online.
ACKNOWLEDGEMENTS
We are grateful to Prof. M. Salas laboratory (CBMSO-CSIC) for generously providing the Phi29 DNA polymerase and to Juan P. García Villaluenga (UCM) for useful discussions.
FUNDING
Spanish Ministry of Economy and Competitiveness [MAT2015-71806-R to J.R.A-G, FIS2010-17440, FIS2015-67765-R to F.J.C., BFU2012-31825, BFU2015-63714-R to B.I.]; Spanish Ministry of Education, Culture and Sport [FPU13/02934 to J.J., FPU13/02826 to E.B-H.]; National Institutes of Health [GM45925 to L.S.K.]; University of Tampere (to G.L.C.); Programa de Financiación Universidad Complutense de Madrid–Santander Universidades [CT45/15-CT46/15 to F.C. ]. Funding for open access charge: Spanish Ministry of Economy and Competitiveness [BFU2015-63714-R].
Conflict of interest statement. None declared.
Present address: José A. Morin, Biotechnology Center (BIOTEC). Technical University Dresden. Tatzberg 47/49, 01307 Dresden, Germany.

Comments