


Abstract
MicroRNAs (miRNAs) comprise a gene-regulatory network through sequence complementarity with target mRNAs. Previous studies have shown that mammalian miRNAs decrease many target mRNA levels and reduce protein production predominantly by target mRNA destabilization. However, it has not yet been fully assessed whether this scheme is widely applicable to more realistic conditions with multiple miRNA fluctuations. By combining two analytical frameworks for detecting the enrichment of gene sets, Gene Set Enrichment Analysis (GSEA) and Functional Assignment of miRNAs via Enrichment (FAME), we developed GSEA–FAME analysis (GFA), which enables the prediction of miRNA activities from mRNA expression data using rank-based enrichment analysis and weighted evaluation of miRNA–mRNA interactions. This cooperative approach delineated a better widespread correlation between miRNA expression levels and predicted miRNA activities in cancer transcriptomes, thereby providing proof-of-concept of the mRNA-destabilization scenario. In an integrative analysis of The Cancer Genome Atlas (TCGA) multidimensional data including profiles of both mRNA and miRNA, we also showed that GFA-based inference of miRNA activity could be used for the selection of prognostic miRNAs in the development of cancer survival prediction models. This approach proposes a next-generation strategy for the interpretation of miRNA function and identification of target miRNAs as biomarkers and therapeutic targets.
INTRODUCTION
MicroRNAs (miRNAs) are endogenous small non-coding RNAs that play important roles in various cellular functions and biological phenomena. In general, the regulatory mode of miRNA-mediated gene regulation is post-transcriptional gene silencing by miRNA–mRNA interactions on the basis of sequence complementarity between miRNAs and the 3′-untranslated region (3′UTR) of their target mRNAs ( 1 ). In animals, the pairing to target mRNAs required for gene silencing is less extensive than in plants, and the seed region (nucleotides 2–7) is important for target recognition ( 2 ). Details of this seed-mediated gene repression without Argonaute-catalysed RNA cleavage are less clear. Although a possibility was previously raised that this type of repression was not strictly associated with a reduction in mRNA levels, several microarray-based evaluations showed that mammalian miRNAs decrease many target mRNA levels ( 3 , 4 ). A recent study further revealed that mammalian miRNAs reduce protein production predominantly by destabilization of target mRNA, indicating the ‘mRNA-destabilization (suppression)’ scenario ( 5 ). In accordance with these findings, the accumulation of a few tissue-specific miRNAs has been associated with the suppression of a large number of their target mRNAs during differentiation, suggesting that several tissue-specific miRNAs contribute to the organization of tissue-specific transcript profiles through the suppression of target mRNAs ( 6 ). It has also been reported that genes preferentially expressed in the same tissue and at the same time as such tissue-specific miRNAs have evolutionarily avoided potential target sites matching these miRNAs to preserve their expression ( 6 ).
These findings propose attractive possibilities where changes in transcriptomes measured by mRNA arrays or mRNA-seq may reflect the summation of miRNA-mediated gene repression, which may correspond to changes in miRNome. It may be also envisaged that this scheme could be used for the interpretation of miRNA function by analysing transcriptome data. Based on this assumption, some procedures have been developed to infer miRNA activities by assessing microarray expression data. In conjunction with the sequence-based prediction of miRNA targets, the log-likelihood test and hypergeometric test were often used for the inference of changes in miRNA activity in transcriptome data and assessment of the relationship between miRNA target genes and biological function ( 7–9 ). Rank-based approaches such as Gene Set Enrichment Analysis (GSEA) and related analysis were also applied to evaluate the enrichment of miRNA target genes ( 10 , 11 ). In addition, Ulitsky et al. ( 12 ) recently introduced a new permutation-based statistical method, FAME (functional assignment of miRNAs via enrichment), for these purposes.
However, this ‘mRNA-destabilization (suppression)’ scenario has been mainly based on results with strong experimental perturbation of target miRNA levels, such as ectopic overexpression and depletion by knockdown or gene targeting, and analyses focused on a few miRNAs with tissue-specific expression patterns ( 4–6 ). Therefore, it is unclear whether the strength of the ‘mRNA-suppression’ scenario is sufficient for an RNA expression-based interpretation of miRNA function. In addition, it has not yet been fully assessed whether this concept is widely applicable to more practical conditions with multiple miRNA fluctuations, such as disease pathogenesis conditions that deviate from evolutionarily conserved processes, besides tissue-specific transcriptome formation. In fact, altered miRNA activities have been shown to have a substantial impact on the modification of gene regulatory networks in cancer, but the extent and consequences of their contribution to cancer transcriptomes have not been investigated in detail ( 13–15 ).
Here we devised GSEA–FAME analysis (GFA), which enables the prediction of miRNA activity from mRNA expression data, using rank-based enrichment analysis and weighted prediction of miRNA–mRNA interactions, to address these issues. For this purpose, we combined two analytical pipelines, GSEA and FAME, to detect weaker expression changes caused by miRNAs and evaluate variations in the degree of miRNA–mRNA connections. We observed that this cooperative approach delineated a better widespread correlation between miRNA expression levels and predicted miRNA activities in cancer transcriptome analysis, providing proof-of-concept of the ‘mRNA-destabilization’ scenario. We also discuss the use of this second-generation miRNA activity inference procedure for the identification of target miRNAs as biomarkers and therapeutic targets.
MATERIALS AND METHODS
Outline of GFA
GFA is composed of three steps: (i) division of miRNA target gene sets into two classes by GSEA, (ii) collection of miRNA target genes contributing to the division of miRNA target gene sets into two classes in step 1 and (iii) FAME for the collection of miRNA target genes in step 2.
Gene sets
The Molecular Signature Database (MSigDB, http://www.broadinstitute.org/gsea/ ) was used with GSEA software as a collection of annotated gene sets. It consists of five types of gene sets: genomic positional gene sets (C1), biologically curated gene sets (C2), motif gene sets (C3), cancer-related computational gene sets (C4) and Gene Ontology (GO) gene sets (C5). C3 motif gene sets include two collections of potential miRNA targets (C3MIR) and transcription factor targets (C3TFT). C3MIR miRNA target gene sets contain potential target genes sharing a 3′UTR miRNA-binding motif, and C3TFT transcription factor target gene sets contain genes sharing a transcription factor-binding site around the transcription start site. C4 computational gene sets contain C4 cancer module (C4-CM) gene sets, which representatively change in a variety of cancer conditions ( 16 ). We performed GSEA using these collections of gene sets.
Gene Set Enrichment Analysis (GSEA)
In step 1, GSEA was performed using C3MIR gene sets or other gene sets to evaluate the enrichment of each gene set in group A or group B. GSEA was performed with GSEA software available from the Broad Institute ( http://www.broadinstitute.org/gsea/ ) using default parameters ( 17 ). In step 2, leading-edge subsets were collected for each gene set and assembled for groups A and B, respectively. To reduce the influence of changes in transcriptional factor activity, similar procedures as steps 1 and 2 were performed using C3TFT gene sets that contain genes sharing a transcription factor-binding site, and this C3TFT target gene collection was subtracted from the C3MIR target gene collection in step 2 (option: step 2’).
Functional Assignment of miRNAs via Enrichment (FAME)
In step 3, the collection of leading-edge subsets in C3MIR target gene sets in step 2 was analysed by FAME according to a previous report ( 12 ). FAME was performed in the Expander 6.0 microarray data analysis suite ( http://acgt.cs.tau.ac.il/expander/ ) ( 18 ). FAME executes a permutation-based statistical test to evaluate significant over- or under-representation of miRNA targets in a target gene set, using TargetScan miRNA target predictions ( 12 ). We ran FAME for the collection of leading-edge subsets assembled for groups A and B in both directions of enrichment, i.e. over-representation (enrichment) and under-representation (depletion). For P -value calculations, 10 000 random iterations were performed throughout this study.
Data sets
Microarray data for miR-1 and miR-124 transfection experiments (GSE2075) and miRNA and mRNA expression profiling of DLBCL patient samples (GSE21849) were obtained from NCBI’s Gene Expression Omnibus ( 3 , 19 ). miRNA expression, mRNA expression and clinical data for glioblastoma patient samples were downloaded from The Cancer Genome Atlas (TCGA) Data Portal ( https://tcga-data.nci.nih.gov/tcga/ ) ( 20 ). For analysis of miRNA profiling, we used level 3 pre-interpreted data provided by TCGA.
Rank–rank hypergeometric overlap
Rank–rank hypergeometric overlap (RRHO) analysis was performed according to a previous report ( 21 ).
Survival prediction model
Level 3-processed data of paired miRNA and mRNA expression profiling for 478 glioblastoma patients were downloaded together with clinical data from TCGA Data Portal in March 2012 ( 20 ). After removal of viral miRNAs, profiling data for the remaining 470 miRNAs were mean centred, and the standard deviation was normalized to one per array. The 478 samples were randomly assigned to a training set ( n = 239) or a testing set ( n = 239). For all miRNAs, regression coefficients and P -values were estimated using a univariate Cox regression model in a training set. We also performed simple GFA for a training set by dividing samples into a poor prognosis group (death < 1 year) and a good prognosis group (others) using C3MIR gene sets. In this analysis, we adopted GFA results using the larger C3MIR target gene collection among the two C3MIR target gene collections (‘poor < good’ and ‘good < poor’). In the ‘expression level/GFA-based’ strategy, miRNA showing P < 0.1 in univariate Cox regression analysis and P < 0.12 in the same direction (poor or good prognostic) in GFA were selected as prognostic miRNAs. In the ‘expression level-based’ strategy, the same number of miRNAs as miRNAs selected in the ‘expression level/GFA-based’ strategy was selected according to the order of P -values in univariate Cox regression analysis. Risk scores were evaluated by a linear combination of the expression levels of prognostic miRNAs weighted by their respective Cox regression coefficients according to a previous report ( 22 ) by the following formula: ‘risk score’ = Σ (regression coefficient) × (expression value of each prognostic miRNA). Risk scores were calculated for patients in both training and test sets, and patients with a risk score greater than 0 and those with a risk score less than 0 were assigned to ‘High risk’ and ‘Low risk’ groups, respectively. Survival analysis and validation of the fitness and accuracy of these survival prediction models were performed using the survival, rms, and survAUC packages of R. We repeated these analyses for the pair of a training set and test set after five randomizations.
RESULTS
GSEA–FAME analysis (GFA)
We first made two assumptions for building a procedure to infer miRNA activities from mRNA expression data. First, the correlation between fluctuations in multiple endogenous miRNA levels and alterations in target mRNAs may be weak, even if the ‘mRNA-destabilization’ scenario is operational, and may be better recognized by examining target genes as a population of target genes, not individual genes. Second, the efficacy of individual miRNA target sites was influenced by multiple features of site context, including AU-rich nucleotide composition near the site, relative distance from the stop codon and positioning near the ends of long UTRs ( 4 ). Thus, the strength of correlations between a miRNA and its target genes is highly variable and should be weighted to the final assessment of each miRNA activity.
We combined two analytical approaches to satisfy these two assumptions ( Figure 1 ). To detect a weak connection between miRNA target genes and phenotypes in the first assumption, we took a ‘gene set versus ranked list’ approach through the GSEA algorithm, which is able to detect a weak one-sided inclination among two phenotypes (groups A and B) ( 17 ). We performed this analysis using the complete collection of miRNA target gene sets (C3MIR) implemented in GSEA, which contains potential target genes sharing a 3′UTR miRNA-binding motif, and roughly divided these gene sets into two groups that are enriched in group A or in group B (step 1). Although GSEA itself can rank these miRNA target gene sets according to each enrichment score, we used GSEA for the extraction of the core of miRNA target genes contributing to differential miRNA activities between two phenotypes. To this end, we made a collection of leading-edge gene subsets of individual gene sets accounting for GSEA enrichment signals to reconsider the second assumption (step 2).
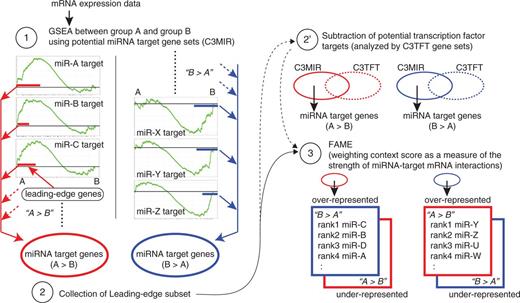
Outline of GFA. In step 1, GSEA is performed using C3 miRNA target gene sets (C3MIR), which contain potential target genes sharing a 3′UTR miRNA-binding motif for each miRNA, to assess whether each miRNA target gene set is enriched in group A or in group B. In step 2, leading-edge subsets, part of the members of each miRNA target gene set, which accounts for the enrichment of corresponding gene sets in group A or B in GSEA analysis, are collected for each gene set and assembled for groups A and B, respectively, to make the collection of overall miRNA target genes enriched in group A and B. As an option, similar procedures to steps 1 and 2 are performed using C3 transcription factor target gene sets (C3TFT) that contain genes sharing a transcription factor-binding site and the C3TFT target gene collection is subtracted from the C3MIR target gene collection subjected to FAME (step 2’). In step 3, FAME is applied to the C3MIR target gene collection in step 2, resulting in a ranked list of each miRNA activity and corresponding target genes accounting for this activity.
FAME, a new permutation-based statistical method, was recently developed to test for over- or under-representation of miRNA targets in a designated gene set ( 12 ). In contrast to previous methods and conventional statistical tests, FAME uses weighted prediction for miRNA-target pairs according to 3′UTR contexts (i.e., context scores), provided by TargetScan ( 2 , 4 ), and evaluates the significance of the total weight of miRNA-target pairs for each miRNA ( 12 ). We applied this FAME algorithm to the collection of leading-edge gene subsets of miRNA target gene sets to integrate the second assumption in relative estimation of various miRNA activities (step 3). We performed FAME in both directions of enrichment, i.e. over-representation (enrichment) and under-representation (depletion). In addition, we also considered an optional procedure to reduce the potential influence of changes in transcriptional factor activity on the deregulation of genes modulated by both miRNAs and transcriptional factors. For this purpose, we performed similar procedures in steps 1 and 2 using transcription factor target gene sets (C3TFT), subtracted this gene collection from the C3MIR target gene collection (step 2’) and then ran FAME analysis. We call this approach ‘GFA’.
Detection of the ‘mRNA-destabilization’ scenario under experimental miRNA perturbation by GFA
As the first application of our approach, miRNA transfection data that provides a basis for the ‘mRNA-suppression’ scenario was analysed by GSEA and GFA ( Figure 2 ). In this data, HeLa cells were transfected with two miRNAs (miR-1 and miR-124), two mutant miRNAs (124mut5-6 and 124mut9-10) and two chimeric miRNAs (chimiR-124/1 and chimiR-1/124) and were subjected to microarray analysis 12 and 24 h after transfection ( 3 ). As shown in Figure 2 A, GSEA ranked four wild-type-seed miRNAs (miR-1, miR-124, 124mut9-10 and chimiR-1/124) as top ones among all miRNAs and confirmed a functional compromise by seed mutation (124mut5-6). On the other hand, GSEA failed to detect chimiR-124/1 activity in 12-h data, although this miRNA has been shown to function in a similar manner to miR-124 albeit to a lesser extent ( 3 , 11 ). GFA demonstrated similar performance with GSEA and further succeeded in the detection of chimiR-124/1 activity in 12-h data, suggesting that FAME contributes to the better ranking of miRNA activities ( Figure 2 B). In addition, we observed that GFA showed detection ability for transfected miRNAs in two analytical directions of enrichment, over-representation (enrichment) assessment for down-regulated genes relative to controls and under-representation (depletion) assessment for up-regulated genes. In Supplementary Figure S1 , the procedure reducing the influences of transcriptional factors ( Figure 1 , step 2’) worsened GFA performance in under-representation assessment for up-regulated genes: it may have been because this experiment is a simple design with miRNA transfection. These results suggest that GFA is able to detect the ‘mRNA-destabilization’ scenario under experimental miRNA perturbation as well as other previous procedures to infer miRNA activities.
![Comparison of GSEA and GFA for miR-1 and miR-124 transfection data. GSEA ( A ) and GFA ( B ) were performed for the microarray data of HeLa cells transfected with miR-1, miR-124, mutant miR-124 (124mut5-6 and 124mut9-10) and chimeric miRNAs (chimiR-1/124 and chimiR-124/1) for 12 or 24 h. In GFA, we ran FAME for the two collection of leading-edge subsets, which were down-regulated (left panel) and up-regulated (right panel) in the cells transfected with miRNA relative to controls, in an enrichment direction of over-representation (enrichment, left panel) and under-representation (depletion, right panel), respectively. The distribution of GSEA normalized enrichment scores (NES) and GFA ranking [−log10( P -value)] are shown. GSEA NES and GFA ranking for miR-1 and miR-124 are indicated by red diamonds and blue circles, respectively.](https://oup.silverchair-cdn.com/oup/backfile/Content_public/Journal/nar/41/5/10.1093_nar_gks1439/3/m_gks1439f2p.jpeg?Expires=1750266087&Signature=zfOa61KLV4Tdgd~jXzJUDURdRkJrDWXkGX1ZjKuF8UzVaginrWP-l8yK4LULVSW-4IskurP1Lw22vGm50DixGvx-8nygBzwvulcjNuj1Pprx90nIcRMRoD2o7uRwpE0IA-FgLMg~k6zLrl-lO4at4qvqseeif8-ZQgXR8U4m5xYdltzhW1WAI28hBq-zObgOiqagJ17lVlFDMeaJSKFsk0Tb5xhHrKPZ2Ben61AjXALk32d91cCJg8-QKILb1MEIy5lLZdPTDFdfczrkSXTp7gxYzhnnhddslf-cdnU4Xv0K4FNZdOcDKxtmHPrcTCl3FwSbdGyPrXLE~CaXPCWfJg__&Key-Pair-Id=APKAIE5G5CRDK6RD3PGA)
Comparison of GSEA and GFA for miR-1 and miR-124 transfection data. GSEA ( A ) and GFA ( B ) were performed for the microarray data of HeLa cells transfected with miR-1, miR-124, mutant miR-124 (124mut5-6 and 124mut9-10) and chimeric miRNAs (chimiR-1/124 and chimiR-124/1) for 12 or 24 h. In GFA, we ran FAME for the two collection of leading-edge subsets, which were down-regulated (left panel) and up-regulated (right panel) in the cells transfected with miRNA relative to controls, in an enrichment direction of over-representation (enrichment, left panel) and under-representation (depletion, right panel), respectively. The distribution of GSEA normalized enrichment scores (NES) and GFA ranking [−log10( P -value)] are shown. GSEA NES and GFA ranking for miR-1 and miR-124 are indicated by red diamonds and blue circles, respectively.
Widespread correlation of miRNA expression levels and miRNA activities in cancer transcriptomes: DLBCL study
The ‘mRNA-destabilization (suppression)’ scenario has been previously discussed in the setting of strong experimental perturbation of target miRNA levels and tissue-specific transcriptome organization. Therefore, the next important question is whether the ‘mRNA-destabilization’ scenario is widely applicable to more realistic settings with multiple miRNA fluctuations such as disease pathogenesis conditions. A microarray is a powerful widely used platform to study genome-wide gene expression and gene regulatory networks. In the field of cancer research, this technology has provided numerous advances in the understanding of disease pathogenesis, disease classification and development of survival prediction models ( 23 ). As an early example, microarray analysis showed that diffuse large B cell lymphoma (DLBCL), the most common form of human malignant lymphoma, can be divided into two major molecular subtypes: germinal centre (GC) B cell-like DLBCL (GC-DLBCL) and activated B cell-like DLBCL (ABC-DLBCL), according to the resemblance of the gene expression pattern to normal GC B cells or activated B cells, respectively ( 24 ). This study exhibited the usefulness of this method in detecting the gene deregulations responsible for biological heterogeneity ( 24 ). Using DLBCL as a disease model, we next examined whether the impact of endogenous miRNAs on target mRNA levels in cancer transcriptomes can be deduced by GFA.
We used matched miRNA and mRNA expression data of human clinical DLBCL samples comprising 11 GC subtypes and 18 ABC subtypes ( 19 ) ( Figure 3 A), and performed GSEA and GFA between GC and ABC subtypes. In addition, we compared the performance of the conventional FAME procedure in combination with a standard statistical test ( t -test, P < 0.05) to extract differentially expressed genes between the two subtypes. As shown in Figure 3 B, GFA strikingly yielded better evidence of a widespread correlation of miRNA expression levels and miRNA activities for differentially expressed miRNAs, compared with GSEA and the combination of the t -test and FAME. Evaluation with Spearman’s rank correlation coefficients revealed the outperformance of GFA over the simple use of GSEA and FAME ( Figure 3 C). Comparisons of the similarity between miRNA expression ranks and miRNA activity ranks using the RRHO method ( 21 ) also demonstrated the better performance of GFA ( Figure 3 D). In addition, we found that the option process ( Figure 1 , step 2’) further improved the fit of GFA to the correlation relative to results using C3MIR gene sets in this DLBCL study, while this process could sometimes decrease a large proportion of the collection of leading-edge gene subsets in the current form. This result suggests that the effort to consider the coexisting influences of transcriptional factor changes is substantially useful for a better assessment of miRNA activities in some cases. In an initial analysis, we also performed GFA using other gene sets (C1: genomic positional gene sets, C2: biologically curated gene sets, C4: cancer-related computational gene sets and C5: GO gene sets) and confirmed the general superiority of using C3MIR gene sets ( Supplementary Figure S2A–S2C ). Furthermore, GFA detected a better widespread correlation for all miRNAs ( Supplementary Figure S2D ). Collectively, these results suggest that the ‘mRNA-suppression’ scenario could be taken into account for the interpretation of miRNA function in diverse conditions with physiological fluctuations in multiple miRNAs, and that GFA is a better method for detecting this mode of gene regulation events.
![Widespread correlation of miRNA expression levels and miRNA activities assessed by GFA: DLBCL study. ( A ) Classification of DLBCL cases into ABC and GC subtypes. ( B ) Correlation between miRNA expression ranks and miRNA activity ranks analysed by GSEA, FAME [after the extraction of differentially expressed genes by the t -test ( P < 0.05)] and GFA (using C3MIR and C3TFT gene sets) for the top 45 miRNAs with differential expression between ABC and GC subtypes. Differential miRNA expression was evaluated by −log10( P -value). ( C ) Spearman’s rank correlation coefficients for the correlation between miRNA expression ranks and miRNA activity ranks in (B). ( D ) RRHO analysis for the correlation between miRNA expression ranks and miRNA activity ranks in (B). Maximums of the Benjamini–Yekutieli-corrected RRHO map (left) and the representative RRHO heatmap (right) are shown. ( E ) Overlap between target genes of GFA-supported differentially expressed miRNAs and gene subsets of C4 cancer module (C4-CM) gene sets analysed by GSEA. In addition to GFA, GSEA was performed among ABC and GC subtypes using C4-CM gene sets. Red boxes represent overlap between target genes of GFA-supported differentially expressed miRNAs and leading-edge subsets of C4-CM gene sets enriched in either DLBCL subtypes.](https://oup.silverchair-cdn.com/oup/backfile/Content_public/Journal/nar/41/5/10.1093_nar_gks1439/3/m_gks1439f3p.jpeg?Expires=1750266087&Signature=lPWF9dtnWKJE48sbZpsOEHc6BDwLQ55~x-cHxGDbZbYR57KKz9xW92mm6CqirdFUH~kJYz8BDkNOi-F9xgaHghPtPPY2plYOYTYpRuWAet8MCZNIN5sLPHruejDURA3Pc1njda5TGLJh3fvbNCquVQkyZ8kNO3rr7Ki5jwzupfagOEx9Df63O922lxaYDc1vzaarNdbcLqtRu3sku2K01IJHIoOL5UUFQFK4I2q6qmMwbmT0-clK4Qd78Ct6FurhPawqaMe~c0zLah2u95-UNRfVDIwWjv9eH61-LTWgGfxgMclL7zV1vp7zCQW2qsObNUesl3lNo4XV9cf2a~MQFA__&Key-Pair-Id=APKAIE5G5CRDK6RD3PGA)
Widespread correlation of miRNA expression levels and miRNA activities assessed by GFA: DLBCL study. ( A ) Classification of DLBCL cases into ABC and GC subtypes. ( B ) Correlation between miRNA expression ranks and miRNA activity ranks analysed by GSEA, FAME [after the extraction of differentially expressed genes by the t -test ( P < 0.05)] and GFA (using C3MIR and C3TFT gene sets) for the top 45 miRNAs with differential expression between ABC and GC subtypes. Differential miRNA expression was evaluated by −log10( P -value). ( C ) Spearman’s rank correlation coefficients for the correlation between miRNA expression ranks and miRNA activity ranks in (B). ( D ) RRHO analysis for the correlation between miRNA expression ranks and miRNA activity ranks in (B). Maximums of the Benjamini–Yekutieli-corrected RRHO map (left) and the representative RRHO heatmap (right) are shown. ( E ) Overlap between target genes of GFA-supported differentially expressed miRNAs and gene subsets of C4 cancer module (C4-CM) gene sets analysed by GSEA. In addition to GFA, GSEA was performed among ABC and GC subtypes using C4-CM gene sets. Red boxes represent overlap between target genes of GFA-supported differentially expressed miRNAs and leading-edge subsets of C4-CM gene sets enriched in either DLBCL subtypes.
From a practical standpoint, GFA produces a list of the more likely target genes for each miRNA and thus presents a convenient platform for further experimental validation of miRNA–mRNA interactions. In the DLBCL study, we performed GSEA using C4 cancer module (C4-CM) gene sets, which representatively change in a variety of cancer conditions ( 16 ), and observed that the above-mentioned gene list for individual miRNAs overlapped with part of the deregulated C4-CM gene sets in a mutually exclusive manner ( Figure 3 E), suggesting that these miRNAs are potentially responsible for the deregulation of these modules. These analyses suggested the presence of several potential miRNA–mRNA interactions such as miR-144-BCL6, miR-219-TGFBR2, miR-219-PDGFRA, miR-138-EIF4BP1 and miR-144/223/495-PDE4D in association with DLBCL-related genes ( Supplementary Table S1 ). Among them, miR-219-PDGFRA was previously validated through an experimental evaluation ( 25 ).
Integration of GFA-based functional assessment into the development of a cancer survival prediction model using miRNA signature: glioblastoma study
Using matched miRNA and mRNA profiling data, one may infer that GFA can be used for better identifying miRNAs, mRNAs and miRNA–mRNA pathways as biomarkers and therapeutic targets in various disease conditions beyond the use of one-sided data and simple application of statistical procedures. Although microarray analysis has indeed enabled the development of a gene signature-based disease classification and stratification strategy especially in the cancer field, this type of strategy frequently suffers from several problems, such as multicollinearity and overfitting. In the latter case, pursuit of better performance in the training set may actually lead to worse performance in the test set and future cases ( 23 ). On the basis of these considerations, we finally investigated the usefulness of the GFA approach as a method of feature selection in the construction of a survival prediction model for cancer patients.
In this study, we used matched miRNA and mRNA expression data of glioblastoma patients derived from TCGA database, a comprehensive collection of genomic and expression profiling of various cancer patients, together with clinical data ( 20 ) ( Figure 4 A). We randomly divided 478 glioblastoma samples into a training set and a test set. We subjected the miRNA expression data in the training set to univariate Cox proportional hazard regression analysis to identify miRNAs whose expression status was significantly correlated with patient survival. We also performed GFA in the training data set by dividing samples into a poor prognosis group (death < 1 year) and a good prognosis group (others) to identify miRNAs whose activity status was correlated with patient prognosis. In a combinational strategy using miRNA expression information and GFA-based assessment of miRNA activity (the ‘expression level/GFA-based’ strategy), we defined miRNAs that showed a correlation with patient prognosis both in Cox regression analysis and in GFA as prognostic miRNAs, and calculated risk scores using a linear combination of these miRNAs ( 22 ) ( Figure 4 A). On the other hand, in the ‘expression level-based’ strategy, we simply used the results of Cox regression analysis and extracted the same number of miRNAs as miRNAs selected in the ‘expression level/GFA-based’ strategy.
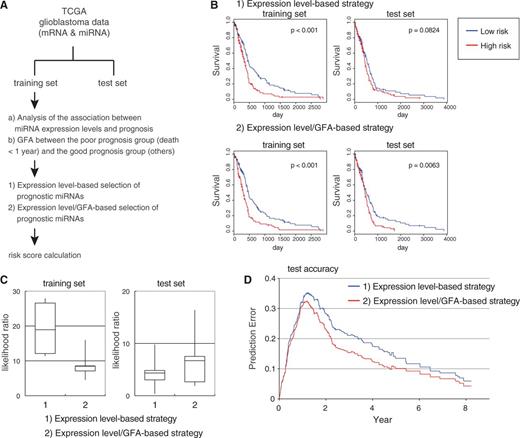
Availability of GFA for the selection of prognostic miRNAs in the development of cancer survival prediction models: TCGA glioblastoma study. ( A ) Analytical outline of survival prediction using TCGA glioblastoma data sets. ( B ) Examples of Kaplan–Meier plots representing survival probabilities according to low or high levels of risk scores developed by (i) the ‘expression level-based’ strategy and (ii) the ‘expression level/GFA-based’ strategy in a training set and a test set. ( C ) Likelihood ratio of survival prediction models developed by (i) the ‘expression level-based’ strategy and (ii) the ‘expression level/GFA-based’ strategy in training sets and test sets. Positive numbers indicate that the model fits the data better. Results with five randomizations are shown. ( D ) Time-dependent prediction errors of survival prediction models developed by (i) the ‘expression level-based’ strategy and (ii) the ‘expression level/GFA-based’ strategy in training sets and test sets. Average results with five randomizations are shown.
As a result, we repeated randomization and subsequent analyses several times and observed that the ‘expression level-based’ strategy produces probable overfitting models that function poorly in test sets, although these models function well in training sets ( Figure 4 B). In contrast, models developed by the ‘expression level/GFA-based’ strategy showed a tendency to work better than the former in test sets ( Figure 4 B). We compared the likelihood ratio of both models and noticed that models in the ‘expression level-based’ strategy showed a strong decline in a fit to the survival status between training sets and test sets, and that models in the ‘expression level/GFA-based’ strategy retained a fit even in test sets ( Figure 4 C). We also estimated the time-dependent prediction error rate of both models and found that the ‘expression level/GFA-based’ strategy exhibited better performance in spite of the selection of miRNAs with lower significance in Cox analysis than that of the simple ‘expression level-based’ strategy ( Figure 4 D). Taken together, these results suggest that GFA-based assessment of miRNA function can provide an attractive option for the more rational design of an identification framework for biomarkers and therapeutic targets using large expression data sets, although further optimization should be required for practical use in combination with unsupervised or supervised procedures and various learning methods.
DISCUSSION
In the present study, we devised a novel procedure GFA to infer miRNA activities from mRNA expression data, taking advantage of two analytical pipelines, GSEA and FAME. Despite advances in sequence-based approaches for miRNA target predictions, it is still a major challenge to deduce miRNA function from the list of hundreds of putative target genes. So far, certain in silico methods including FAME and the recent CoMeTa method, which uses coexpression patterns of target genes for each miRNA, have been developed as the next approach for this problem ( 11 , 12 , 26 ). These methods are based on the concept that miRNAs must stamp their footprints on overall mRNA expression in accordance with the ‘mRNA-suppression’ scenario. However, it has not been fully assessed whether the scenario is widely applicable to diverse conditions with multiple miRNA fluctuations and whether endogenous miRNA-mediated mRNA repression has enough strength to predict miRNA function and activity from mRNA expression data. By examining this issue, we showed here that the ‘mRNA-suppression’ scenario is certainly realized as a widespread correlation between miRNA expression levels and miRNA activities predicted by mRNA expression in cancer transcriptome analysis. Therefore, these results provided proof-of-concept of the ‘mRNA-destabilization’ scenario. In addition, our findings may encourage an RNA expression-based approach to infer miRNA function for comprehensive understanding of the miRNA–mRNA network in diverse fields.
FAME can be used in combination with several clustering methods and standard statistical tests including the t -test to extract differentially expressed genes ( 12 ). Although it was previously shown that this type of usage of FAME gives a better correlation between miRNA expression and miRNA activity than the hypergeometric test in the analysis of cell type-specific formation of transcriptome profiles ( 12 ), we have developed a GFA with a better and steadfast performance than that of the combination with the t -test and FAME in the DLBCL study ( Figure 3 ). We postulate that the better performance of GFA is attained by the merits of GSEA and FAME: the ability of GSEA to detect weaker expression changes and the characteristics of FAME using a weighting scheme for miRNA–mRNA pairs. In addition, the use of GSEA confers a threshold-free approach, thereby providing practical convenience. This may also reduce the chance of missing weak, but biologically relevant, expression changes due to choosing a threshold that is either too stringent or too lenient. Furthermore, we observed that GFA was informative in the detection of activities of transfected miRNAs not only in over-representation (enrichment) assessment for down-regulated genes relative to controls, but also in under-representation (depletion) assessment for up-regulated genes ( Figure 2 ). This suggests that GFA can aid the detection of relative low activities of miRNAs in addition to the detection of active miRNAs. Regarding that FAME is informative in both analytical directions, over-representation (enrichment) assessment and under-representation (depletion) assessment ( 12 , 18 ), FAME may contribute to the detection of relative low activities of transfected miRNAs in control samples in this case. Under-representation evaluations may be also more informative than over-representation evaluations in certain conditions where a group of genes have evolved to avoid miRNA targeting during development ( 6 , 18 ).
On the other hand, we observed that some differentially expressed miRNAs did not appear to mark their effects on mRNA expression data. It may be interpreted by several modification mechanisms such as a mask of miRNA function by other RNA binding protein(s), non-canonical seed-independent gene regulation and targeting of non-3′UTR regions by miRNAs ( 27 , 28 ). Therefore, further mechanistic understanding of miRNA-mediated gene regulation may improve the ability of first-generation miRNA target prediction procedures (i.e. TargetScan and so on) and second-generation miRNA activity inference procedures (i.e. GFA and so on).
Transcription factors are key regulators of gene expression as well as miRNAs. Recent progress in the ENCODE project demonstrated that most transcription factors involved in miRNA regulation tend to be enriched at the top of the network hierarchy of transcription factors and to either largely regulate miRNAs or be regulated by miRNAs ( 29 ). A similar pattern can also be seen for miRNAs, suggesting the presence of a few high-degree connections between transcription factors and miRNAs, either transcription factor-to-miRNA regulatory interactions or miRNA-to-transcription factor regulatory interactions, with balanced regulation at the top of the gene regulation network ( 29 ). On the other hand, various modes of relationships between transcription factors and miRNAs converging on the same target genes have been considered ( 30 , 31 ). In the differentiation of embryonic stem cells, it has been shown that let-7 miRNAs modulate the transcriptional network through dual effects on transcription factors: direct inhibition of Myc activity and collateral suppression of miRNA target genes regulated overlappingly by the pluripotency transcription factors Oct4, Sox2, Nanog and Tcf3 ( 32 ). To consider the potential confounding mechanisms seen in the latter case, we prepared an optional procedure to reduce the potential influence of changes in transcriptional factor activity ( Figure 1 , step 2’) and observed that this procedure may gain in the detection of the ‘mRNA-suppression’ scenario in the DLBCL study ( Figure 3 ). Further improvements in processing relationships between miRNAs and transcription factors may provide more valuable insights into understanding the impact of miRNAs on gene regulation.
In addition, our study presents some implications of GFA for the field of conventional microarray-based approaches in biomarker and therapeutic target identification. We showed that inference of miRNA activity by GFA could be used for the selection of prognostic miRNAs in the development of cancer survival prediction models ( Figure 4 ). Considering the presence of an extensive interplay between miRNA layers and transcriptome layers, the paired profiling of miRNA expression and mRNA expression can provide a robust platform to select biologically relevant features, together with an analytical framework for understanding RNA regulatory networks, such as GFA. This approach may allow us to avoid problems associated with the use of one-sided data and the simple application of statistical procedures, including overfitting ( 23 ). This beneficial effect may also be obtained in the mRNA signature-based strategy, in which mRNA expression data could be affected more by a ‘large P small N’ problem. Furthermore, GFA-supported miRNAs may be good candidates for therapeutic targeting to correct the pathological deregulation of gene expression and modify disease processes. In conclusion, this analytical approach may offer a basis for a next-generation strategy to interpret miRNA function and identify target miRNAs as biomarkers and therapeutic targets.
FUNDING
KAKENHI [Grant-in-Aid for Young Scientists (A) (No. 24689018) and for Scientific Research on Innovative Areas ‘RNA regulation’ (No. 23112702) and ‘Integrative research on cancer microenvironment network’ (No. 22112002)]; Global Center of Excellence Program for ‘Integrative Life Science Based on the Study of Biosignaling Mechanisms’ from the Ministry of Education, Culture, Sports, Science, and Technology of Japan; Cell Science Research Foundation. Funding for open access charge: Grant-in-Aid for Scientific Research on Innovative Areas ‘Integrative research on cancer microenvironment network’ (No. 22112002).
Conflict of interest statement. None declared.
ACKNOWLEDGEMENTS
We thank Matsuyama H for valuable discussions and all members of Department of Molecular Pathology, the University of Tokyo.

Comments