


Abstract
Little is known regarding the post-transcriptional networks that control gene expression in eukaryotes. Additionally, we still need to understand how these networks evolve, and the relative role played in them by their sequence-dependent regulatory factors, non-coding RNAs (ncRNAs) and RNA-binding proteins (RBPs). Here, we used an approach that relied on both phylogenetic sequence sharing and conservation in the whole mapped 3′-untranslated regions (3′-UTRs) of vertebrate species to gain knowledge on core post-transcriptional networks. The identified human hyper conserved elements (HCEs) were predicted to be preferred binding sites for RBPs and not for ncRNAs, namely microRNAs and long ncRNAs. We found that the HCE map identified a well-known network that post-transcriptionally regulates histone mRNAs. We were then able to discover and experimentally confirm a translational network composed of RNA Recognition Motif (RRM)-type RBP mRNAs that are positively controlled by HuR, another RRM-type RBP. HuR shows a preference for these RBP mRNAs bound in stem–loop motifs, confirming its role as a ‘regulator of regulators’. Analysis of the transcriptome-wide HCE distribution revealed a profile of prevalently small clusters separated by unconserved intercluster RNA stretches, which predicts the formation of discrete small ribonucleoprotein complexes in the 3′-UTRs.
INTRODUCTION
The 3′-untranslated region (3′-UTR) of mRNAs is a fundamental mediator of the processes affecting post-transcriptional regulation of gene expression ( 1 , 2 ). Typically, the influences of the 3′-UTR are mediated by interactions with RNA-binding proteins (RBPs) and non-coding RNAs (ncRNAs). Although a subclass of ncRNAs, the microRNAs (miRNAs), bind the mRNA 3′-UTR in a ribonucleoprotein complex with AGO proteins to mostly negatively control target mRNAs ( 3–5 ), 3′-UTR-interacting RBPs can exert complex effects, influencing mRNA transport, localization, polyadenylation state, rate of degradation and finally rate of translation through regulated assembly/disassembly of actively recycling polysomes ( 6 ). In this way, RBPs behave as topological controllers of gene expression and can influence expression both negatively and positively.
Mechanistic studies have helped to identify dozens of single cis -elements in 3′-UTRs bound by specific RBPs and miRNAs ( 7 , 8 ), sometimes with defined consequences on gene expression and cell phenotypes. In vitro ( 9–11 ) or in vivo ( 12–15 ) high-throughput approaches are also starting to provide transcriptome-wide maps of RBP and miRNA regions of interaction with mRNAs, allowing us to trace the first mRNA–protein complex (mRNP) networks in yeast ( 16–18 ) and vertebrates ( 19–21 ).
Trans -factors bind to mRNA UTRs in short continuous regions, often corresponding to a defined secondary structure and a recurrent consensus sequence. If shared among species, these trans -factor footprints should determine a local increase in sequence similarity. On the assumption that in a purifying (negative) selection context, highly conserved non-coding sequences in orthologous protein-coding genes would point to elements potentially endowed with regulatory activity, it would be possible to obtain information regarding the core networks involved in mRNA regulation by isolating the regions bearing an high degree of sequence evolutionary conservation in UTRs. This holds also because no selective pressure for protein functionality applies to UTRs, which are thus unconstrained to change sequence or structure in order to fulfill their regulatory purpose.
On a genomic scale, the identification of putative functional elements on the basis of evolutionary conservation has been mostly based on the comparison between human, rat and mouse genomes, with the definition of the so-called Ultra Conserved Regions (UCRs) as 200 bp identical DNA stretches. This procedure selects for mostly non-exonic portions of the genome ( 22–25 ), now collected in a database ( 26 ). Only a limited number of these UCRs lie in mRNA UTRs. The same approach has been recently applied to the transcriptome ( 27 ), as defined by a library of expressed sequence tags. The identified 3096 sequences clustered in 96 segments, of which 23 were fully contained in the coding sequence (CDS) and 80 overlapped or were entirely in UTRs. Out of UCRs, specific mining of UTRs for regions of high conservation has been pioneered almost 10 years ago ( 28 ) by identifying conserved motif cores and extending them up to a defined threshold, or by computing a motif conservation degree based on pairwise alignment homology frequency ( 29 ). In each of these two studies, four mammalian species were compared for the small number of UTRs known at that time. Genome-wide multiple alignments of several species has been rendered possible in recent years by the increased sequencing capabilities ( 30 , 31 ), but they have seldom been applied to specifically address the identification of potentially functional sites in UTRs, and always by analysing a limited number of mammalian species ( 32 ). In vertebrates, 3′-UTRs are longer and less conserved than 5′-UTRs, and surprisingly they are modestly variable in length between species with respect to the observed intraspecies length distribution ( 33 ). This could suggest the existence of unknown phylogenetic constraints acting on their length, like long-range interactions among functional elements.
We introduce here an approach for identifying hyper conserved elements (HCEs) in 3′-UTRs of mRNAs, weighting sequence conservation information and phylogenetic distance on 44 vertebrate species, from human to lamprey. This approach does not require the assumption of an a priori sequence length, takes limited computation time and can be used for any desired reference species and species subgroup. Its application to human 3′-UTRs led us to the mapping of >3000 HCEs, which occupy <0.5% of the total 3′-UTR sequence space. These regions have peculiar properties, including a clustered pattern of recurrence and show a potential to localize functional cis elements belonging to highly conserved mRNA control networks. To demonstrate the usefulness of HCEs in prioritizing sequences for further analysis, we used the HCEs to identify a network of mRNAs coding for RBPs that possess 3′-UTRs bound by the HuR RBP, and we showed this network to be functional in translational regulation of gene expression.
MATERIALS AND METHODS
HCE identification pipeline
Human 3′-UTR sequences were fetched from the hg18 assembly at the UCSC database ( 34 ), and all UTRs shorter than five bases were filtered, as they are likely to derive from annotation errors. The Sequence Conservation Score (SCS) for each base of the UTRs, as pre-computed by means of phastCons [see ( 35 ) for details on how this value was calculated], was retrieved, for the relevant regions of the genome, from the UCSC database ( 34 ) along with the 44-way alignment in MAF format; the alignment is performed on 44 vertebrate species. We computed the Branch Length Score (BLS) ( 36 ) as the fraction of the length of the total phylogenetic tree branches covered by the alignment of each exon composing an UTR, taking the lowest BLS of all exons as the BLS for the whole UTR. The final conservation score, which we term hyper conservation score (HCS), was computed for each base of the UTRs as the weighted average of SCS and BLS. Weight for both components was set at 0.5 (see Supplementary Methods ): this corresponds to computing the HCS as the arithmetic mean of SCS and BLS. Nevertheless, our pipeline allows changing these weights to obtain a different combination of the two features. A schematic view of the pipeline can be found in Figure 1 A.

HCEs are short, scattered and highly structured. The overall HCE identification pipeline is shown in ( A ), with the lower part detailing the algorithm used searching for seeds and extending them to lead to the final HCEs. ( B–G ) highlights the most relevant features of the HCEs. (B) shows the length distribution of HCEs and ( C ) their percent coverage of 3′-UTRs; ( D ) displays the predominance of AU base pairs content over CG base pairs in HCE bases composition and ( E ) the prevalence of highly structured HCEs, as indicated by the shown distribution of secondary structure density in HCEs. ( F ) displays the distribution of distances between HCEs on the same 3′-UTRs and ( G ) the HCE distance distribution from the 3′-UTR start, indicated in percent over the 3′-UTR length.
A threshold was then set on HCS under which sequences should not be considered as hyper conserved. The threshold was chosen to be 0.85, as, by weighting SCS and BLS equally, that would require one part of the score to be at least 0.7 when the other part is 1.0 and vice versa. This stringent constraint guarantees that only the most conserved UTR regions are actually selected as HCEs. By its composition, the HCS does not impose a threshold on the number of species that must be included for a region to be considered an HCE; nevertheless, a region aligning on a low number of species will be assigned a low HCS and thus not considered as conserved.
HCEs were then identified in 3′-UTRs by means of a two-step algorithm, implemented in Python:
First, a search was run in every UTR for five-base seeds that had an almost complete conservation sequence-wise (SCS ≥ 0.95) and in which average HCS was not <0.85.
Next, these seeds were extended upstream and downstream into the UTR, one base at a time, for as long as the average HCS of the HCE did not fall below the preset threshold or both ends of the UTR were reached.
Resulting HCEs were eventually merged to remove overlaps and duplicates, which could occur in the case of high conservation spanning a substantial part, if not the whole, UTR. A view of the algorithm is in Figure 1 A.
Construction of the non-HCEs data sets
To compare HCEs properties to non-HCE UTR portions, we generated 1000 data sets composed by an equal number of non-HCE sequence elements. Via a Python script, we randomly chose UTR and start position; the region length was drawn from the HCE length distribution, in order to mimic the HCEs size ranges.
HCE intersection with ncRNAs-binding sites
Experimentally validated miRNAs-binding sites were extracted from the SQL version of AURA ( 19 ), available on the download page of the website. The data set contained 15 560 binding sites regarding a total of 88 distinct miRNAs. Coordinates of these sites were intersected with HCEs, and only sites falling completely inside an HCE were considered. HCEs and non-HCEs sites were also intersected with miRNA-binding sites predicted by three popular tools, miRanda ( 37 ), PicTar ( 38 ) and PITA ( 39 ). The content of lncRNAdb ( 40 ) was downloaded from the website and filtered to keep only human lncRNAs. A BLAST ( 41 ) database was built with these sequences and a search was performed with HCEs as query, with the BLAST ‘task’ parameter set as ‘blastn-short’; only matches with a maximum e-value of 0.05 were considered as true positives.
HCE intersection with RBP position–frequency matrices
Position–frequency matrices (PFMs) for 69 RBPs were extracted from the RBPDB database ( 42 ). HCE and non-HCE sequences were matched against these PFMs via the BioPython functions dedicated to this task. Only matrices longer than four bases (for a total of 29 matrices) were retained, and all matches with score <80% were filtered.
HCE intersection with the mRNA–protein occupancy profiles
T > C conversion profiles were downloaded from the GEO database (series GSE38355) and filtered to include only bases falling into 3′-UTRs. HCE and non-HCE bases were intersected with the conversion profiles, quantiles were computed and distributions of scores were tested for significant differences by means of a t -test. For the non-HCE case, the iteration giving the best results was used to compare with the distribution of HCE scores.
Over-representation analysis
All genes which UTRs contained at least one HCEs were extracted and input to the DAVID Functional Annotation tool ( 43 ) to identify by a modified Fisher test the overrepresentation of functional terms contained in various ontologies [selected resources were Gene Ontology (GO) Molecular Function, Biological Process and Cellular Component; IPR; SMART; PFAM, SP_PIR_keywords, Biocarta, KEGG and OMIM disease]. Estimation for the terms P -value was Bonferroni corrected, and only terms for which the P -value was <0.05 were included in the final results; terms were grouped according to their similarity via the DAVID Functional Clustering tool, using high-stringency clustering criteria.
Identification of the SLBP-binding sites
HCE sequences belonging to genes annotated to be part of the ‘chromosome assembly’ functional group were aligned by means of ClustalW2 ( 44 ), along with the canonical Stem–loop-binding protein (SLBP) binding motif, to detect whether these HCEs actually contained the latter. The multiple alignment algorithm was run with its default parameters.
Sequence motif search
Sequence motif search inside HCEs was performed by means of the Weeder algorithm ( 45 ). Motif length was set to be 6, 8, 10 or 12 nucleotides, and the minimum occurrence frequency of the motif was set to 25% of the sequences composing the data set. We considered to be relevant all the motifs reported by Weeder as the highest ranking.
Secondary structure motif search
The secondary structure folding of the HCEs contained in the RNA Recognition Motif (RRM)-type RBP mRNA group were predicted via the RNAfold program of the Vienna RNA package ( 46 ). Motifs were searched over these structures by means of the RNAforester tool ( 47 ), run in the local multiple alignment mode.
HuR overexpression and silencing
Human breast cancer MCF-7 cells were transiently transfected using Lipofectamine2000 (Invitrogen, Carlsbad, CA, USA) with a pT-REX mammalian expression vector coding for human HuR ( 48 ) and with the mock empty vector as control. The same cells were infected with lentiviral transduction particles bearing shRNAs (Sigma Aldrich, Mission shRNA) against the HuR sequence, following the manufacturer protocol and testing four different shRNA sequences. Non-target transduction particles were used to infect MCF-7 cells as negative controls. Stably silenced clones were selected with puromycin. The most effective pool, KD1, was derived from the TRCN0000017273 shRNA. Sequences are:
TRCN0000017274 [CCGGGAGAACGAATTTGATCGTCAACTCGAGTTGACGATCAAATTCGTTCTCTTTTT], TRCN0000017273
[CCGGCGTGGATCAGACTACAGGTTTCTCGAGAAACCTGTAGTCTGATCCACGTTTTT], TRCN0000017277
[CCGGGCAGCATTGGTGAAGTTGAATCTCGAGATTCAACTTCACCAATGCTGCTTTTT] and TRCN0000017275
[CCGGACCATGACAAACTATGAAGAACTCGAGTTCTTCATAGTTTGTCATGGTTTTTT].
Cell culture and treatments
MCF-7 and MCF-7 shHuR cells were cultured in DMEM with 10% FBS, 100 U/ml penicillin–streptomycin and 0.01 mM l -glutamine (all media ingredients were obtained from Sigma-Aldrich, St. Louis, MI, USA). Cultures were maintained at 37°C in a 5% CO2 incubator. Puromycin (final concentration 2.5 µg/µl) was used for selection and maintenance of stable short hairpin RNA (shRNA) transfectants. All reagents were purchased from Sigma. 1.5 × 10 6 MCF-7 and MCF-7 shHuR cells were seeded into two 10-cm Petri dishes for polysomal RNA extractions and into one 10-cm Petri dish for total RNA extractions. Total RNA and polysomal RNA extractions were performed 72 h after seeding; all the experiments were run in biological and technical triplicate.
RNA–Protein pull-down assay
RNA probes for HuR (AUGUAUUGUUUAUACAU) and Degenerated (AUGUAUNNNNNAUACAU), Dblmut1 (AUGUAUGGUUGAUACAU), Dblmut2 (AUGUAUUCUUAAUACAU), YB1 (AUGUAUGGUCUGCAUACAU) and PTB (AUGUAUCUUUCUUAUACAU) probes have been synthesized by Sigma using 0.05 µmol Synthesis Scale and HPLC purification with a 5′ biotinylated DNA polyC linker. Their predicted secondary structure folding is shown in Figure 3 . Biotin pull-down assays were performed by incubating 40 μg of MCF-7 cell lysates with 1 µg of biotinylated probes for 1 h at room temperature. The complexes were isolated using 100 µl of paramagnetic streptavidin-conjugated Dynabeads (Dynal®, Invitrogen, Carlsbad, CA, USA), and bound proteins in the pull-down material were analysed by Western blotting, using antibodies recognizing HuR (Santa Cruz, CA, USA), YB1 (Abcam, Cambridge, UK) and PTB (Santa Cruz, CA, USA). After secondary-antibody incubations, the signals were visualized by chemiluminescence (Amersham Biosciences, Little Chalfont, UK).
Total RNA extraction
Total RNAs from treated and non-treated cells were isolated using the TRIzol reagent (Invitrogen, Carlsbad, CA, USA), according to the manufacturer’s instructions. Purity of RNAs (A260/A280 value of 1.8–2.1) and concentration were measured using the Nanodrop spectrophotometer. To eliminate DNA contamination, total RNA was treated with DNase I (RNase-Free DNase Set, Qiagen, Hilden, Germany) and then purified with the RNeasy kit (Qiagen, Hilden, Germany).
Polysomal RNA extraction
MCF-7 cells treated as described above were incubated for 3 min with 0.01 mg/ml cycloheximide at 37°C, then the plates were put on ice. The media were removed, and the cells were washed twice with cold phosphate buffer saline (PBS) + cycloheximide 0.01 mg/ml. Cells were directly lysed on the plate with 300 µl cold lysis buffer [10 mM NaCl, 10 mM MgCl 2 , 10 mM Tris–HCl pH 7.5, 1% Triton X-100, 1% sodium deoxycholate, 0.2 U/ml RNase inhibitor (Fermentas, Burlington, CA), 1 mM dithiothreitol and 0.01 mg/ml cycloheximide], scraped and transferred to an Eppendorf tube. The extracts were centrifuged for 5 min at 12 000 g at 4°C. The supernatant was frozen in liquid nitrogen and stored at −80°C or loaded directly onto a 15–50% linear sucrose gradient containing 30 mM Tris–HCl, pH 7.5, 100 mM NaCl, 10 mM MgCl 2 , and centrifuged in an SW41 rotor for 100 min at 180 000 g . Fractions (polysomal and sub-polysomal) were collected monitoring the absorbance at 254 nm and treated directly with 0.1 mg/ml proteinase K for 2 h at 37°C. After phenol–chloroform extraction and isopropanol precipitation, polysomal RNA was resuspended in 30 µl of RNAse-free water and then repurified with the RNeasy kit (Qiagen, Hilden, Germany).
Quantitative RT-PCRs
For mRNA quantification, a two-step Taq-Man real-time PCR analysis was performed, using probes obtained from Applied Biosystems (Foster, CA, USA). cDNA was synthesized from total and polysomal RNA (1 µg) in 20 µl reactions, using the iScript cDNA Synthesis Kit from BioRad (Hercules, CA, USA). The reverse transcriptase reaction was performed by incubating the samples at 25°C for 5 min, 42°C for 30 min and 85°C for 5 min. The PCR reactions (10 µl) were performed on 20 ng of cDNA, the mix were prepared with 5× KAPA FAST probe (Kapa Biosystems, Boston, MA, USA) and the 20× appropriate Taq-Man probe. The PCR mixtures were incubated at 95°C for 3 min, followed by 39 cycles of 95°C for 30 s and 60°C for 20 s and 72°C for 60 s. mRNA levels were calculated based on the ΔCT method, using RPL0 and HPRT1 as reference genes. All PCRs were performed in triplicate using an iQ5 RealTime PCR detection system (Bio-Rad, Hercules, CA, USA).
Ribonucleoprotein immunoprecipitation
Ribonucleoprotein immunoprecipitation (RIP) was performed using human HuR overexpressing MCF-7 cell line lysates. Cell extracts were resuspended in NT2 buffer [50 mM Tris HCl pH = 7.5, 150 mM NaCl, 1 mM MgCl 2 , 0.05% NP40, 1 U/µl Ribolock (Fermentas, Glen Burnie, MD, USA), 2 mM DTT, 30 mM EDTA supplemented with a protease inhibitor cocktail (P8340, Sigma, St. Louis, MI, USA], chilled at 4°C. Cell lysates were added to the Protein G Dynabeads (Dynal®, Invitrogen, Carlsbad, CA, USA) at 50 µl beads/250 µl lysate. Beads were previously incubated with cell extracts and then bound with 5 µg of mouse monoclonal anti-HuR antibody (Santa Cruz, sc-71290, CA, USA) or mouse IgG (Millipore, NI03-100UG, Billerica, MA, USA). The bound RNA was extracted using phenol:chloroform:isoamyl alcohol (25:24:1) and precipitated with ethanol. RNA pellets were resuspended in 10 µl RNA-grade water and, after DNAse treatment (Fermentas, Glen Burnie, MD, USA), cDNA was obtained from each samples as previously detailed. Real Time quantitative PCR was performed in duplicate using the C1000 (Bio-Rad, Hercules, CA, USA) thermal cycler for 40 cycles, and results were evaluated by cycle threshold (Ct) values. Cyclin A mRNA was quantified as positive control, being a known HuR target, while RPL0 was quantified as negative control, as it was not identified as a HuR target in either of two recent studies ( 49 , 50 ). Obtained data represent the average of at least three independent experiments.
NMR RNA analysis
The SL and NF RNA oligonucleotides probes were purchased as purified powders (Integrated DNA Technologies, Coralville, IA, USA). Samples were dissolved to a final concentration of 0.1 mM in 10 mM phosphate buffer, pH 7.0, 10 mM NaCl, in 93% 1 H 2 O/7% 2 H 2 O. NMR experiments were performed with a Bruker Avance III spectrometer operating at 600.13 MHz proton Larmor frequency, equipped with a cryogenic probe incorporating a z-axis gradient. 1 H-1D experiments were run acquiring 32 768 complex data points on a spectral window of 12 019 or 13 227 Hz, using a relaxation delay of 3 s, and 64–1024 scans. Water signal suppression was carried out by excitation sculpting. Temperature calibration was performed using standard samples. Spectra were Fourier transformed after application of a 1 Hz exponential window multiplication and baseline corrected using Topspin 2.1 (Bruker, Karlsruhe, Germany).
Construction of the HuR / RRM-type RBP mRNA network
HuR-binding sites, as identified in HEK293 cells by two recent photoactivatable-ribonucleoside-enhanced crosslinking and immunoprecipitation (PAR-CLIP) studies ( 49 , 50 ), were downloaded from GEO, accession number GSE29943 and GSE29780, respectively. Sites were intersected with UCSC 3′-UTR coordinates (hg18 assembly) and extracted along with the genes mapping to these 3′-UTRs. Enrichment was computed by counting the number of genes for each domain found in the resulting gene list and by performing a Fisher exact test by means of the R statistical environment. The HuR RRM-type RBP / mRNA network was built by adding all RRM-type RBP mRNAs found to be bound by HuR in the PAR-CLIP study to the HCE-containing 23 RRM-type RBP mRNAs. An edge was reported between HuR and its target mRNAs to indicate the regulatory relationship. Intersections between the 89 PAR-CLIP-derived, our 23 and the 6 RRM-type RBP mRNAs validated by us were computed and highlighted in different colours and node shapes, as shown in Figure 5 B and C.
RESULTS
HCEs in the mRNA 3′-UTRs are rare, short, highly structured and organized in clusters
We identified regions of exceptional evolutionary conservation in the 3′-UTRs of the human exome by a seed extension strategy ( Figure 1 A). We took advantage of the 44-way vertebrate UCSC alignment ( 34 ) from which we derived the phastCons SCS ( 35 ) and the BLS ( 36 ). We first extracted fully conserved five-bases seeds (SCS ≥ 0.95 and BLS ≥ 0.85), which were then extended until they reached a preset threshold (0.85) on the conservation measure, the HCS (computed as the equally weighted average of SCS and BLS; changing these weights would change the relative importance of one of the two features, see Supplementary Methods ). After preliminary filtering, the data set obtained from the UCSC database contained 55 444 3′-UTRs, each one corresponding to a different transcript (including all annotated mRNA splicing variants). The 3′-UTR HCE identification algorithm gave 3149 HCEs (listed in Supplementary Dataset 1 ), belonging to 1010 3′-UTRs, which correspond to 877 genes. At least one 3′-UTR HCE is present in only 1.8% of the total human 3′-UTRs, and collectively HCEs cover only 0.47% of the 3′-UTR space, making them extremely rare. 3′-UTR HCEs have an average length of 100 bases, but their length distribution ( Figure 1 B) is such that >77% of their total number is shorter, being only 4.5% of them >500 bases. The subset of HCEs shorter than 100 bases have an average length of 23 bases, with 25% of them at most 8 bases long. Their UTR coverage ( Figure 1 C) is instead prevalently low (≤25% of each 3′-UTR) or high (≥75% of the 3′-UTR). No significant correlation was found between 3′-UTR length and HCE coverage (Pearson coefficient −0.12). Together, these distributions show that 3′-UTR HCEs are relatively short and that they either occupy a small portion of a 3′-UTR or the most of it. These elements are much richer in AU than in GC bases ( Figure 1 D, P -value 2.2E-16), and are by far more highly structured than random 3′-UTR sequences of the same length, structural density being defined by the fraction of unpaired bases in the HCE secondary structure ( Figure 1 E, P -value 1.2E-13). Also their localization in the 3′-UTRs has interesting properties: when multiple HCEs are present on an UTR, these have a clear tendency to localize in clusters, as indicated by the small inter-HCE distance, 25 bases or less ( Figure 1 F), and to be distributed along the 3′-UTR with a preference for its beginning, with 25% of the HCEs starting on the 3′-UTR 10% initial bases ( Figure 1 G). To provide a snapshot on HCE architecture diversity, we distributed HCE-bearing 3′-UTRs into four classes, depending on their number and coverage. The classes reported in Figure 2 A efficiently represent this diversity. We then focused on the HCE clustered pattern because it could be an effect of a higher order structure of trans -factors. We thus computed the amount of HCEs lying in clusters with intracluster distances (maximum distance between two contiguous HCEs in a cluster) ranging from 5–40 bases. As shown in Figure 2 B, a plateau starts at 20 bases, setting therefore a threshold. At this distance, 81% of the HCEs belong to clusters of two or more elements (the figure already excluded the 577 HCEs that are unique on their 3′-UTR). We thus propose a model, reported in Figure 2 C, for which 3′-UTRs contain clusters of binding sites separated by each other, possibly delineating a scenario in which groups of trans -factors interact with each other in complexes spaced by unconserved regions of unbound 3′-UTR.
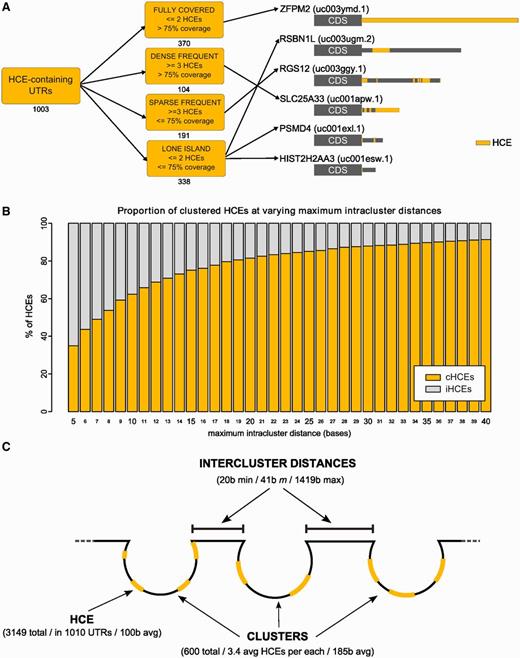
HCEs can be classified according to their pattern of occurrence in 3′-UTRs and are organized in clusters. ( A ) shows the classification of 3′-UTRs in four classes, according to their HCE content (on the left). Numbers below each class box are the number of HCE-containing 3′-UTRs belonging to the class. On the right, a sample of six HCE-containing 3′-UTRs: HCEs are mapped onto their 3′-UTR and represented as yellow areas, a grey rectangle being the full-length 3′-UTR. Arrows from class boxes to UTRs indicate which UTR belongs to which class. ( B ) displays the increasing percentage of clustered HCEs when increasing the maximum intracluster distance allowed for an HCE to be considered part of a cluster. We span from 5 to 40 bases, and at 20 bases we can observe the beginning of a plateau. We therefore chose 20 bases as the maximum intracluster distance to consider. The graph is drawn excluding the 577 HCEs that are unique on their respective 3′-UTR. ( C ) Graphical representation of the proposed model of trans -factor binding to 3′-UTRs, assuming that HCEs are binding sites of one or more trans -factors. Clusters of closely occurring HCEs (composed by 3–4 HCEs on average) are separated by intercluster RNA stretches of variable length (from 20 to 1419 bases), suggesting a coordinated action on the 3′-UTR.
3′-UTR HCEs contain putative binding sites for RBPs and not for ncRNAs
The main question now was what types of potentially functional cis -acting elements are found in 3′-UTR HCEs. To test for miRNAs, we compared the 3′-UTR HCEs with a set of 15 560 experimentally determined 3′-UTR miRNA-binding sites (produced by 88 miRNAs and involving 2232 3′-UTRs) extracted from the AURA database ( 19 ). Out of the total 3149 HCEs, only 51 (1.6%) of them was found to contain miRNA-binding sites, which were 60 and were bound by 33 different miRNAs. These data resulted in whole 3′-UTRs being more enriched in miRNA-binding sites than HCEs (Fisher’s exact test P -value = 2.37E-10). To verify whether this small number was close to random occurrence, we performed the same procedure on 1000 sets of randomly derived 3′-UTR segments, which we call non-HCEs, with the same length distribution and of the same size as the HCEs. The maximum of the distribution of these iterations gave 40 unique miRNA-binding sites involving 47 different miRNAs, which confirms our hypothesis. We eventually proceeded to predict miRNA-binding sites in HCEs and non-HCEs by means of three popular prediction tools [miRanda ( 37 ), PicTar ( 38 ), PITA ( 39 )]. Compared with the best non-HCE iteration, the number of miRNA-binding sites in HCEs is always heavily depleted (a Fisher’s exact test reports enrichment of non-HCEs sites with P -value lower than 2.2E-16 in all three cases). To check also for other ncRNA types, we intersected the 3′-UTR HCEs with the sequences found in lncRNAdb ( 40 ), a catalogue of eukaryotic long non-coding RNAs (lncRNAs). A BLAST search yielded 151 statistically significant putative binding sites at least 12 bases long, involving 132 unique HCEs (4.2%) and 32 different lncRNAs. Again among the 1000 non-HCEs iterations, the BLAST search yielded, for the iteration giving the best results, 209 statistically significant putative lncRNA-binding sites at least 12 bases long, involving 167 unique non-HCEs (5.30%) and 39 different lncRNAs. Therefore, HCEs are unlikely to be preferred sites for miRNAs and lncRNAs.
We then scanned the HCE and the non-HCE lists for matches with the PFMs extracted from the RBPDB resource ( 42 ), which collects the known experimental consensi for RBP binding to mRNAs. Considering only matches with a minimum score of 80% and a matrix length greater than four (leaving us with 29 matrices), we consistently obtained at least 1.8 times more matches in the HCE than in the non-HCE sets (17 173 matches for HCEs versus 9443 matches for the best iteration of non-HCE sequences). HCE matches are listed in Supplementary Dataset 2 . Enrichment of RBP sites in HCEs with respect to non-HCEs is also suggested by the Fisher’s exact test ( P -value = 5.85E-11). If really 3′-UTR HCEs identify mainly RBP-binding sites, they should at least partially span experimentally determined RBP mRNA occupancy profiles. A recent study defines, as T > C conversion scores ( 15 ), contact sites for RBPs in the mRNA transcriptome of proliferating HEK293 cells ( 51 ). This catalogue was obtained by crosslinking 4SU-labelled cells, selecting mRNA–protein complexes by oligo-dT beads precipitation and protein extraction, and determining contact sites by RNA sequencing. The distributions of T > C conversion scores for each base falling in 3′-UTR HCEs and non-HCEs were tested against each other for statistically significant differences. Indeed, HCEs were found to have a significantly higher level of T > C scores than non-HCEs, with the performed t -test producing a P -value lower than 2.2E-16, and with a median T > C score of HCEs of 5.5 versus 4.5 of non-HCEs. These findings suggest that 3′-UTR HCEs are enriched for experimentally identified RBP-binding sites.
3′-UTR HCEs identify the ancient control mediating histone mRNA fate
To appreciate the spectrum of biological functions expressed by 3′-UTR HCE-containing genes, we performed an ontological enrichment on the 877 genes bearing at least one HCE in the 3′-UTR. We identified three gene groups endowed with high significance ( Supplementary Figure S1 ). The first group is composed by 78 genes involved in chromatin structure (terms ‘nucleosome’, ‘chromatin assembly’, ‘DNA packaging’), including 51 (53.6%) of the 95 histone genes present in the human genome. This wide histone component of the signature is that producing the strongest over-representation signal, because the terms remain highly significant even when performing the ontological enrichment after having removed the non-histone genes. It is well known that all histone gene mRNAs have a short 3′-UTR lacking a poly(A) tail, which is bound by the SLBP to stabilize these mRNAs and mediate their nuclear processing and their translation ( 52 ). Alternative to polyadenylation, this mechanism is conserved over a wide evolutionary distance ( 53 ). We therefore hypothesized that the HCEs in the histone 3′-UTRs harboured SLBP-binding sites. To verify this conjecture, we aligned the known SLBP binding motif ( 54 ) to these HCEs and found that a considerable fraction of the HCEs (75 out of 127) contain a close, if not perfect, match to the SLBP motif ( Supplementary Figure S2 ). Therefore, the metrics we devised to select for HCEs precisely identifies cis -elements involved in a conserved and well demonstrated post-transcriptional regulatory process. We assumed this finding as an effective benchmark for the ability of 3′-UTR HCEs to point to circuitries of phylogenetically old post-transcriptional control.
The second highly significant gene set is about the broad activity of transcription and mainly composed by genes involved in its repression. The 137 identified genes suggest that transcription factors as EPC1, TFAP2D and YY1 and co-transcriptional repressors as FOXP2, MEIS2 and EZH2 can be heavily controlled post-transcriptionally, their 3′-UTRs being almost entirely highly conserved. Finally, the third emerging gene set came from the protein domain annotation, giving the RRM.
We also divided the HCEs on the basis of the four classes identified, to see again whether they had a preferential representation of themes. We found that the ‘chromatin structure’ theme is enriched only in the ‘lone island’ category ( Figure 1 H), further confirming that it emerges from the histone mRNA SLBP-binding site ( 53 ). Transcriptional regulation terms appear instead enriched in the ‘sparse frequent’ and ‘fully covered’ groups, while both the ‘dense frequent’ and ‘fully covered’ 3′-UTR groups, i.e. those mostly HCE-rich, point to a significant over-representation ( P -value = 1.09E-05) for mRNA-related activities (GO terms: ‘RNA binding’, ‘mRNA processing’; domains: KH, RRM).
A hyperconserved motif in the 3′-UTR of 19 RRM-type RBP mRNAs bound by HuR
Given the recurrent tendency of the enrichment analysis to select the mRNAs of RRM-type RBPs as preferred sites for 3′-UTR HCEs, we further explored these mRNAs. The RRM is the evolutionarily most successful among the solutions appeared to mediate interaction between RNA and proteins ( 55 ). Of the 23 enriched genes whose mRNA bears at least one HCE and whose protein product contains RRM domains, 17 were experimentally verified RBPs and 16 had an RRM-only architecture ( Supplementary Table S1 ). Their mRNAs are characterized by 3′-UTRs of all four types, with a prevalence of ‘fully covered’ (66.7%) and ‘sparse frequent’ (19%) types, with ‘lone island’ and ‘dense frequent’ types representing respectively just 9.5% and 4.7% of the 3′-UTRs. RBPs have been shown in the yeast to be nodes of highly interconnected networks of post-transcriptional regulation ( 15 , 17 ), but little is known about vertebrate RBP networks. We therefore focused on the mRNA 3′-UTR HCEs of this protein group, to predict RBPs co-regulating them. We scanned the HCEs for hidden common elements by the Weeder algorithm ( 45 ), searching for 6–12-bases-long motifs, with the tolerance of 1–4 mismatches, which are observed in at least 25% of the HCEs. The scan produced as best score two 12 bases sequences that can be considered variants of the same sequence motif, as they differ only in two positions. We speculated that this sequence motif could represent an RBP-binding site, as a number of these proteins are known to have a preference for short unstructured sequences or loops in stem–loop secondary structures ( 55 ). We then searched for secondary structure motifs in the same 3′-UTR HCEs with the RNAfold ( 46 ) and the RNAforester ( 47 ) algorithms. This analysis resulted in a 17-base structural motif in the form of a stem–loop, whose core loop had a good correspondence (7 out of 12 bases for both sequence motifs; 9 out of 12 bases for sequence motif 2) with the previously identified sequence motifs. Combining the results of both sequence and structure motif searches produced a remarkable concordance, as shown by the alignment in Figure 3 A, eventually leading us to define, by taking the consensus sequence motif produced by the secondary structure search algorithm, a stem–loop motif shared by 18 out of the 23 RRM genes and reported in Figure 3 B. The secondary structure of this motif, that we called SL for stem–loop, was predicted by three different folding algorithms, namely RNAfold ( 45 ), MFold ( 56 ) and Sfold ( 48 ), all of them leading to the same result. To test the possibility that the motif secondary structure is indeed a stem–loop, we performed a 1 H-NMR investigation using two synthetic RNAs corresponding to this sequence motif (SL) compared with a motif bearing four mutations in the sequence in correspondence with the stem region, which is predicted to lose folding (no folding, NF). The 1D spectrum of SL, recorded at 5°C in aqueous solution, shows four intense peaks distinct from those of NF and at chemical shift positions typical of imino proton resonances [( 57 ) Supplementary Figure S3 ]. The observation of signals in this spectral region is a clear indication of the presence of strong H-bonds, which prevent rapid exchange with water protons. The spectrum recorded on a sample designed not to form any base pair shows no signals in the region 10–15 ppm ( Supplementary Figure S3 ). The imino proton peaks of SL can also be observed at 15°C and, with much lower intensity, at 25°C ( Supplementary Figure S4 ), an expected behaviour for proton signals establishing H-bonds. At low temperature, three more peaks can be observed in the region 10–11 ppm ( Supplementary Figures S3 and Supplementary Data ), attributable to imino protons involved in weaker H-bonds. Altogether, the data indicate the presence of 4 strong and 3 weak H-bond producing base pairs. By typical frequency positions, peak 4 could be tentatively assigned to the guanine base forming a G:C pair, while peaks 1–3 could be attributed to uracil bases in A:U pairs, four A:U pairs being present in the SL stem–loop. To investigate whether the base pairs referred to were intra- or interchain, experiments were repeated in conditions of higher SL concentration. The observation that the 1 H-NMR spectrum is invariant upon a 10-fold change in sample concentration ( Supplementary Figure S5 ) suggests that the signals refer to imino protons involved in intramolecular H-bonds. Despite the highest temperature set in the NMR experiment (25°C) and in the pull-down experiment (room temperature) are still not physiological, taken all together these results indicate that the SL RNA sequence likely folds into a defined secondary structure. The SL instances in the mapped 3′-UTRs of the 18 genes resulted to be up to four per 3′-UTR, with 13 of them harbouring only one instance ( Figure 3 C). We then noticed that the SL motif had a sequence quite similar to an already known binding site for the HuR (ELAVL1) protein ( 12 ). To verify that SL was effectively interacting with HuR, we performed a protein pull-down assay, followed by a western blot with an anti-HuR antibody. Along with the putative HuR motif, we adopted two positive controls (the YB1 and PTB known binding sites) ( 12 ), two probes mutated in the loop (one with an eptameric loop with two mismatches and another one with a pentameric loop with different sequence) and one degenerated again in the loop, for assay specificity. The probe design is exemplified in Figure 4 A. As reported in Figure 4 B, HuR indeed binds to the probe corresponding to the SL motif. Mutated and degenerated probes show little recovery of HuR, suggesting that the interaction is specific and depending on the loop sequence and size. The positive controls, testifying the correctness of the procedure, are shown in Figure 4 C and D.
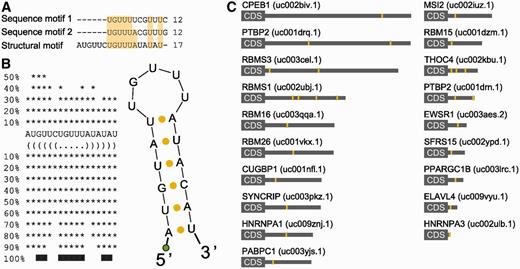
HCEs in mRNAs encoding RRM-type RBPs share a sequence and secondary structure motif. HCEs contained in the group of RRM-type RBP genes 3′-UTRs were scanned for both sequence and secondary structure motifs. The first search returned two, almost identical, 12-bases motifs; the second one produced a 17-bases hairpin which, after multiple alignment, emerged to contain a 12-bases core markedly similar to previously identified sequence motifs. This core represents the loop part of the hairpin which, as the two searches are quite concordant on it, may indeed represent a binding motif for the trans -factor of the regulatory network we are trying to identify. ( A ) shows the alignment between sequence and secondary structure motifs. Light-yellow background highlights column sequence identity. ( B ) shows the secondary structure motif and its bidimensional structure. The green circle represents the biotinylated DNA polyC linker added to the RNA. ( C ) Motif instances (yellow areas) mapped on the full length 3′-UTR (grey rectangle) of the 19 RRM-type RBP mRNAs. HGNC gene names are on the left, UCSC UTR names are on the right in parenthesis.
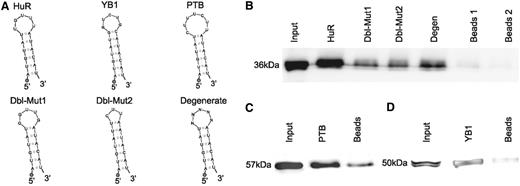
HuR is a trans -factor binding in vitro to the HCE motif shared by mRNAs encoding RRM-type RBPs. The different RNA probes used for the protein pull-down experiment are shown in ( A ). HuR pull-down probe: this probe was designed by using the secondary structure motif reported in Figure 3 , slightly modifying the lowest part of the hairpin so as to make it fold correctly when not in context. The loop was designed by selecting the most probable bases of the sequence in the aligment and the most probable structure motifs. Positive controls probes are the known binding sites for the YB1 and PTB RBPs, experimentally obtained ( 11 ). Again, the lowest part of the stem was slightly modified so as to make it fold as desired. Negative controls HuR probes are Dbl-Mut1, Dbl-Mut2 and Degenerate. The Degenerate probe was synthesized by allowing all four nucleotides to be present at each loop position, so as to obtain a mixture of probes bearing all the possible eptameric loops. The Dbl-Mut1 and Dbl-Mut2 probes were obtained respectively by mutating two bases of the original probe loop in a way to preserve it and by mutating one base and deleting two others in a way to obtain a pentameric loop instead of a eptameric loop. In all probes, the 5′ circle represents the biotinylated DNA polyC linker. ( B ) shows the HuR pull-down western blots. From the leftmost band to the rightmost: Input, HuR probe, Dbl-Mut1, Dbl-Mut2, Degenerate probe and denaturated beads bands. As can be readily seen, the stem–loop probes bind to HuR with a marked specificity for the correct one. ( C and D ) YB1 and PTB RBPs pull-down. From the leftmost band to the rightmost: input, YB1/PTB probe and denaturated beads. As shown by western blotting, the stem–loop probes bind to PTB and YB1 respectively, thus confirming that the pull-down protocol works as expected.
HuR positively controls a translational network of RRM-type RBPs
With the motif confirmed to be recognized by HuR, we next sought to understand whether HuR really had a preference for RRM-containing RBP mRNAs, with respect to mRNAs of RBPs bearing other types of RNA-binding domains and to mRNAs of proteins bearing the most frequent domains in the genome. To calculate enrichments, we took advantage of a HuR PAR-CLIP, therefore theoretically unbiased, data set ( 49 ). We extracted all HuR 3′-UTR binding sites from this data set and derived the corresponding genes. We then computed, by means of the Fisher’s exact test, the enrichment in this gene set for: (i) proteins containing the most common experimentally verified RNA-binding domains (zinc finger C2H2, KH, SAM, RRM); (ii) proteins containing the three absolute most frequent domains in the human genome (IG-like, GPCR superfamily and serine threonine kinase); (iii) the complete set of annotated RBPs irrespective of the RNA-binding domain. Figure 5 A shows that the RRM-containing gene set resulted to be the only one significantly enriched. This confirms that HuR has a marked preference for binding to the 3′-UTR of RRM-bearing mRNAs. We then plotted all 3′-UTR HuR targets identified by the PAR-CLIP study along with our group of RRMs, to highlight overlapping and unique genes of the two sets. The resulting intersection is shown in the Venn diagram of Figure 5 B and in the network in Figure 5 C, which discriminates between gene categories by means of shapes and colours. Fourteen out of the 23 HCE-containing mRNAs for RRM-type proteins are identified as HuR binding, and in particular 4 of them are among the ones we checked by quantitative RNA immunoprecipitation followed by PCR (RIP-PCR) ( 58 ), see Figure 6 A. We eventually intersected the HCE sites on the 23 RRMs 3′-UTR with sites identified by this plus another recent HuR PAR-CLIP study ( 49 , 50 ). Overlap with HCEs was as high as 55% and 47% of the total for the Lebedeva ( 49 ) and the Mukherjee ( 50 ) studies, respectively. Figure 6 reports the results of a validation sampling of the identified network, both in structural ( Figure 6 A) and in functional ( Figure 6 B and C) terms. We used HuR overexpressing MCF-7 cells, already used for high throughput studies on HuR ( 59 , 60 ), firstly to perform five quantitative RIP-PCR assays on the MSI2, RBM15, SRFS11, HNRNPA3 RBP mRNAs (among those predicted for being bound by HuR), the CCNA2 (cyclin A) mRNA as a positive control ( 61 ) and the RPL0 mRNA as a negative control. Three RBP mRNAs showed a strong enrichment in the immunoprecipitated pellets, ranging from 200–400-fold, with the exception of RBM15, which reported a more modest, but still significant, enrichment (about 30-fold). Enrichment significance P -values were computed for each mRNA with respect to the negative control RPL0 mRNA and resulted significant [ Figure 6 A, level of significance is indicated by one or two stars in the whole panel (* P ≤ 0.05, ** P ≤ 0.01)]. This proved that these mRNAs are indeed interacting with the HuR RBP in exponentially growing MCF-7 cells. We subsequently infected the same MCF-7 cells with a number of lentiviral HuR silencing shRNAs, and selected those infectants with the strongest HuR inhibition as seen by western blotting ( Figure 6 B). We measured the level of polysomally loaded mRNAs for the same four RBP genes after sucrose gradient centrifugation ( 62 ) by collecting the polysomal fractions of both the wild-type and the HuR-silenced MCF-7 cells. For all the RBP mRNAs tested, we found a statistically significant (same representation of significance of Figure 6 A) decrease of their localization on polysomes ( Figure 6 C), which demonstrates that binding of HuR to these four RBP mRNAs has a functional effect in promoting their enhanced inclusion in polysomes and their increased representation in the translatome. This corresponds to an enhanced translation rate, translation being mainly controlled at the initiation step ( 63 ). At least for this sample of the network, therefore, we were able to show that HuR acts as a translational enhancer.
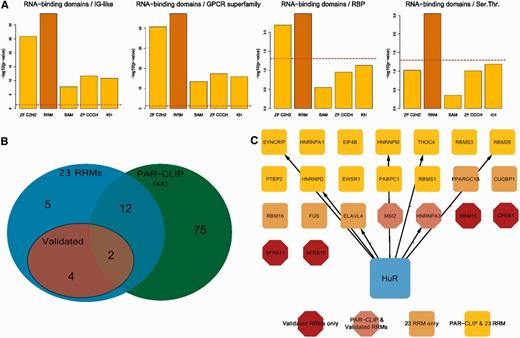
HuR has a preference for the binding of the 3′-UTR of RRM-type RBPs. ( A ) shows the enrichment of HuR 3′-UTR binding sites for several RNA-binding domains with respect to the most frequent human protein domains and to RBPs as a whole. Data are extracted by the PAR-CLIP experiment published in ( 49 ). ( B ) shows a Venn diagram indicating the overlap between our HuR RRM-type mRNA targets and the experimentally identified HuR PAR-CLIP RRM-type mRNA targets. ( C ) displays HuR 3′-UTR RRM-type mRNA targets, highlighted in different colours and shapes according to their belonging to our set of 23 mRNAs, to mRNAs we validated by RIP-qPCR and their intersection with the RRM-type mRNA targets from the PAR-CLIP data set.
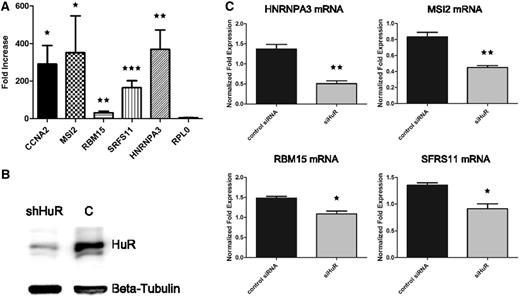
The network of HuR binding to mRNAs for RRM-type RBPs is a functional translational network. ( A ) shows the fold enrichment results (with respect to control) for four predicted RBP mRNAs (plus the CCNA2 mRNA as positive control and the RPL0 mRNA as negative control) subjected to ribonucleoprotein immunoprecipitation (RIP) from lysates of HuR overexpressing MCF-7 cells and quantitative RT-PCR, demonstrating interaction of HuR with these mRNAs. Enrichment significance P -values were computed for each mRNA with respect to the negative control RPL0 and are equal to 0.0163 for CCNA2, 0.0306 for MSI2, 0.01 for RBM15, 0.0003 for SRFS11 and 0.0054 for HNRNPA3. Level of significance is indicated by one, two or three stars (* ≤ 0.05, ** ≤ 0.01, *** ≤ 0.001). ( B ) reports the western blot confirming HuR silencing in MCF-7 cell line, β-tubulin is used as the housekeeping protein. ( C ) shows the statistically significant decrease of polysomal mRNA levels for the same four RRM-type RBP mRNAs when HuR is silenced, indicating a decrease of these mRNAs in the translatome and indirectly a translational-enhancing effect of HuR on these mRNAs. Increasing level of significance (* ≤ 0.05, ** ≤ 0.01) is indicated by one or two stars.
DISCUSSION
Despite its widespread role in heavily reprogramming mRNA transcriptome variations ( 62 , 64 ), post-transcriptional control of gene expression has been object of few systematic attempts to map and study the involved circuits. A large number of prediction algorithms and of experimental work has focused on the identification of miRNA/mRNA target sites and of the corresponding inhibitory networks ( 65 , 66 ), while less attention has been devoted, especially in recent years, to the RBP/mRNA networks. High throughput RBP-mRNA interaction studies have been rendered possible at the whole transcriptome level by the introduction in the last 10 years of two methods, RIP ( 67 , 68 ) and CLIP ( 13 , 14 ) and their association with RNAseq ( 69 , 70 ). The derived data have allowed the enunciation by Keene of the so-called post-transcriptional RNA regulon (or operon, by similarity with prokaryotes) theory ( 71 , 72 ). This model states that each regulon is a module composed by a group of mRNPs whose mRNAs code for functionally related proteins coordinated at the level of mRNA stability and translation by commonly acting RBPs and ncRNAs. Several studies confirm now this proposal (for example, see 73 , 74 , 75 , 76 ).
But out of conceptual generalizations, the building of sufficiently representative post-transcriptional networks and the study of their properties would require the concurrent detection of the interaction of several RBPs with all the associated mRNAs in a certain state. Until now this has been systematically attempted by RIP for yeast ( 16 , 67 ), bringing to some preliminary principles ( 16 , 68 ). The recent availability of modified PAR-CLIP approaches ( 51 ) could bring soon to describe these networks and their variation in mammalian cells.
In this evolving scenario, we reasoned that a simple starting point to deal in an unbiased way with core post-transcriptional networks in human cells would be to exploit data on vertebrate phylogenetic conservation by genome-wide alignments, available at the UCSC Genome Browser ( 34 ). The original release of this data set has been already used by the authors to derive information about, among other things, UTR conservation for some model genomes ( 35 ). We added to the original phastCons ( 35 ) algorithm a stronger dependence on completeness of the species tree, in order to increase the sensitivity for really hyper conserved DNA regions. We also restricted the analysis to 3′-UTRs for their known regulative power on gene expression ( 1 , 2 ), and because in the original cited genome-wide comparative study some of the absolute extreme conservation in vertebrates was seen exactly in 3′-UTRs of genes regulating other genes, already suggesting widespread post-transcriptional regulation ( 35 ). Interestingly, the same trend seemed not to be present in Drosophila and Caenorhabditis ( 35 ). Our derived HCEs were found in <2% of the total 3′-UTRs and in a tiny fraction, <0.5%, of the total 3′-UTR space, also being short, as 77% of them have an average length of 23 bases. We had therefore the impression to have really sieved a limited number of small RNA stretches with exceptional integrity and permanence through the vertebrates clade, and with potential biological activity as cis -elements. But for which trans -factors? Using the available information, we showed that these trans -factors most likely are neither miRNAs nor lncRNAs.
The absence of conservation of miRNA-binding sites in 3′-UTRs is consistent with a number of findings. At the base of the vertebrate lineage, there was an expansion of the miRNA repertoire ( 77 ), but we know that, despite the fact that phylogenetic conservation has been used in predicting miRNA target sites ( 78 ), these sites undergo a marked plasticity during evolution. For example, the number of non-conserved miRNA-binding sites on 3′-UTRs is generally 10 times more than the number of conserved ones ( 79 ). Moreover, the predicted miRNA target sites in a large fish family have higher than expected density of single base changes among the different species ( 80 ), suggesting a role in speciation, while a computational comparison showed that 400 human-specific changes in putative miRNA target sites differentiate us from other primates ( 81 ) and variation for miRNA target sites could even have changed mRNA/miRNA interactions in ethnic groups ( 82 ). Therefore, our finding that in vertebrate evolution we assist to a virtually total cancellation of the positional miRNA target site signals is not surprising, and is a further confirmation of the marked tendency to undergo fast rewiring of this post-transcriptional subnetwork. On the evolution of lncRNAs, the available information is still scarce; therefore, we can only suppose that change of lncRNAs and of their target sequences is rapidly diverging, possibly because not under a strong selective pressure.
Instead, several clues bring to the hypothesis that RBP-binding sites mainly nest in HCEs. First, many of their most common HCE dimensions are compatible with RNA stretches necessary for interacting with RBP domains ( 11 , 55 ); second, known RBP-binding sites are represented with a double density in HCEs with respect to the best scoring comparable random sampling of 3′-UTR stretches; third, experimental mRNA–protein interactome signals by PAR-CLIP data ( 51 ) are also enriched in HCEs; fourth, HCEs allowed us to identify by a simple ontological overrepresentation analysis the SLBP binding site on histone 3′-UTRs, possibly the most unconventional cis -element bound by an RBP described to date ( 83 ), confined to a specific gene class.
The fact that the more ancient post-transcriptional networks in vertebrates could involve the action of RBPs on mRNAs is of great interest. We know that RBPs can act both negatively and positively on gene expression, and therefore their combination can build different types of circuits in post-transcriptional networks ( 17 ). The yeast genome, devoid of miRNAs ( 84 ), contain about 560 RBPs ( 16 ), which are presumably the primary actors of the post-transcriptional controls exerted in a concerted way to coordinate topological localization and translation of mRNAs ( 18 ). Two recent studies ( 51 , 85 ) experimentally identify, with comparable methods, the RBP complement of human cells, which appear to consist in each of them in about 800 genes whose biological activity is largely still unexplored. We predict from our study that a fraction of these RBPs involved in gene expression regulative circuitries were present at the root of the phylogenesis of vertebrate genomes, and were preserved till now in an evolutionary history of >500 million years. Given the HCE presence in almost all the tested 44 species analysed, these RBP-based networks are possibly involved in processes sustaining cell architecture of the bearing organisms, their biological activities being totally unknown. It would be interesting to assay the degree of persistence of vertebrate HCEs in several invertebrate model genomes, to confirm or deny the suggested lack of conservation ( 35 ).
A simple way of obtaining some information on the possible function of the networks of which HCEs were cis components was to observe the functional polarization, when gene function was known, of the genes bearing them. This immediately provided us a proof of the good sensitivity of the approach, as the strongest signal detected was the well-known and highly conserved network between the SLBP RBP and the histone gene mRNAs ( 53 ). The other most interesting signal found was the tendency of HCEs to be enriched in the 3′-UTR of mRNAs of RBPs, especially of those RBPs bearing the RRM as interface with the bound RNAs. Therefore, HCEs not only bore cis -elements which were potentially mainly RBP-binding sites, but were also enriched in the 3′-UTR of mRNAs coding for RBPs. Given previous suggestions about the tendency of post-transcriptional networks to establish short regulative and autoregulative feedbacks both in yeast ( 16 , 86 ) and in mammals ( 62 , 87 , 88 ), we were especially intrigued by this finding. Building on it, we thought to be in a good position to reach the main goal of the study, the proof-of-principle of phylogenesis-assisted identification and demonstration of new post-transcriptional networks in human cells, rendered possible by the current wide availability of detailed genome sequence and annotation in vertebrates. Scanning the 23 3′-UTR HCEs of the selected mRNAs coding for RRM-type RBPs, we found a sequence- and structure-defined motif by computational analysis, which we experimentally demonstrated by NMR to be endowed with a secondary structure. We showed that this structured sequence is specifically bound in the loop by the HuR RBP, with an interaction also dependent on a stable stem ( Figure 6 ). By developing a cell-based inducible model of HuR overexpression, we also showed that the network HuR RBP / RRM-type RBP mRNAs was, at least for the four assayed mRNAs, a translation-enhancing network bearing to HuR-induced increase in polysomal localization of the target mRNAs. This finding is compatible with the mRNA stabilizing and translation-promoting function already well documented for HuR ( 89 ). Moreover, exploiting unbiased PAR-CLIP interaction data, we confirmed that HuR has a clear preference, at least among vertebrates, for binding mRNAs of RRM-type RBPs ( Figure 5 ). HuR is an essential ( 90 ), ubiquitous and intensely studied RBP ( 88 , 91 ), whose nuclear and cytoplasmic action seems to be subsequent to energy metabolism ( 92–94 ) and cell damage-induced stresses ( 95–97 ), and which has been found to positively regulate a large number of bound mRNAs. Here, we add that the RRM-type HuR has an evolutionarily ancient propensity to positively control the translatability of a set of mRNAs coding for other RBPs bearing RRM-type domains. Taken together with the known ability of HuR to bind and regulate its own mRNA ( 98–100 ), we predict HuR to be a post-transcriptional hub protein exerting wide and marked effects, both directly and indirectly, through the action of several RRM-type RBPs which in turn control many other mRNAs. Added to the known HuR capability to bind and affect the mRNAs of many transcription factors ( 49 ), this finding predicts its ability to heavily influence both post-transcriptional and transcriptional networks, as key ‘regulator of regulators’, in vertebrate cells. Interestingly, an HuR orthologue is absent in invertebrate model genomes, so probably this protein arose in vertebrates as duplication of one of the neuron-specific members of the ELAV family (HuB, HuC, HuD), establishing its new role that became essential in all cells ( 101 ).
But, on a more general ground, how are these RBP-based post-transcriptional networks physically structured in vertebrates? While by CLIP data RBPs appear to bind, sometimes in a preferential fashion ( 14 , 49 ), 5′ and 3′-UTRs, nothing is known about their supramolecular organization, if any, on the bound mRNAs. We provide here a first clue on this organization, which from our analysis of HCEs in vertebrate 3′-UTRs could result in patterns of small clusters of 3–4 stretches on average (but with a variability from 2 to 28) of continuous sequence, each of them being a potential binding site for one or more contiguous RBPs ( Figure 2 C). Increase in resolution power of the newly introduced mRNA transcriptome-wide clipping technique ( 51 ) could provide a sufficiently detailed map of RNA–protein contact points to confirm or deny this model. It is likely that the HCE length and cluster organization could derive from RNA-dependent and RNA-independent RBP interactions on the 3′-UTRs. Several RBPs are known to undergo homo or hetero dimerization and oligomerization ( 102–104 ), which could represent the structural basis for the formation of complexes. The possible presence of small intermittent ribonucleoprotein clusters as preferred organization scheme along the 3′-UTR length could impose the study of these clusters instead of the single forming RBPs to understand function.
With this work, we provide evidence that tailored phylogenetic analyses based on genome sequence information can allow us to prioritize potential cis -element in post-transcriptional networks, providing either a way for their experimental identification and clues for the understanding of their topology.
FUNDING
Funding for open access charge: Fondazione CARITRO, Trento, Italy [in the frame of the TRADENT project (2010–2012)].
Conflict of interest statement . None declared.
ACKNOWLEDGEMENTS
We would like to thank Toma Tebaldi and Angela Re for the precious comments and suggestions at the initial stages of this work, and Sheref Mansy for text revision.

Comments