


Abstract
Unusually for a eukaryote, Trypanosoma brucei transcribes its variant surface glycoprotein (VSG) gene expression sites (ESs) in a monoallelic fashion using RNA polymerase I (Pol I). It is still unclear how ES transcription is controlled in T. brucei . Here, we show that the TDP1 architectural chromatin protein is an essential high mobility group box (HMGB) protein facilitating Pol I transcription in T. brucei . TDP1 is specifically enriched at the active compared with silent VSG ES and immediately downstream of ribosomal DNA promoters and is abundant in the nucleolus and the expression site body subnuclear compartments. Distribution of TDP1 at Pol I-transcribed loci is inversely correlated with histones. Depletion of TDP1 results in up to 40–90% reduction in VSG and rRNA transcripts and a concomitant increase in histones H3, H2A and H1 at these Pol I transcription units. TDP1 shares features with the Saccharomyces cerevisiae HMGB protein Hmo1, but it is the first architectural chromatin protein facilitating Pol I-mediated transcription of both protein coding genes as well as rRNA. These results show that TDP1 has a mutually exclusive relationship with histones on actively transcribed Pol I transcription units, providing insight into how Pol I transcription is controlled.
INTRODUCTION
Transcription in eukaryotes is subdivided between different RNA polymerases. Normally ribosomal DNA (rDNA) is transcribed by RNA polymerase I (Pol I), protein coding genes by Pol II and miscellaneous small RNAs by Pol III. Considerable progress has been made in understanding how Pol II transcription is controlled ( 1 ), with much less known about Pol I ( 2–4 ). Regulation of Pol I transcription is particularly technically challenging to study, as the Pol I transcribed rDNA is present as large numbers of highly similar sequences that differ in their transcriptional status ( 5 ). As a striking exception to other eukaryotes, African trypanosomes, including Trypanosoma brucei , express their surface protein genes (as well as the rDNA) using Pol I ( 6 ). African trypanosomes, therefore, provide a genetically manipulable model organism for investigating basic features of Pol I transcription. Hopefully, in addition to understanding how Pol I mediated monoallelic transcription of variant surface glycoprotein ( VSG ) expression sites (ESs) operates, we will gain new insights into how Pol I is controlled in other organisms.
African trypanosomes are unicellular flagellated eukaryotes that cause devastating diseases, including African sleeping sickness in humans and nagana in livestock, and are spread by tsetse flies in sub-Saharan Africa ( 7 ). Trypanosomes display unusual features in how their genome is organized and transcribed. There does not seem to be regulation of Pol II transcription in T. brucei , and most of the genome is arranged in extensive polycistronic transcription units that are constitutively transcribed by Pol II ( 8 ).
The only example of regulated transcription in African trypanosomes seems to be that of some of its Pol I-transcribed surface protein gene containing transcription units. In both Saccharomyces cerevisiae and mammalian cells, Pol I normally exclusively transcribes rDNA, which is present as 150–200 tandem arrays in S. cerevisiae and ∼400 rDNA transcription units in humans ( 3 ). In both S. cerevisiae and mammalian cells, ∼50% of the rDNA transcription units are transcriptionally active at a time ( 5 , 9 ). This differential transcription of these highly similar rDNA units has made Pol I regulation difficult to study. For example, the nucleosomal state of transcriptionally active rDNA remains controversial because of limitations in the experimental techniques used to investigate this ( 4 ). It has been argued that active rDNA is essentially stripped of nucleosomes ( 5 , 10 ). However, others have argued that unphased nucleosomes are present on transcriptionally active rDNA, resulting in a dynamic chromatin structure ( 11 ).
T. brucei also transcribes its rDNA transcription units using Pol I. It has been estimated that there are ∼10 rDNA transcription units in T. brucei ( 12 ). This is a relatively small number compared with other eukaryotes, and the possibility of an underestimate can not be ruled out. In addition, it is unknown whether only half of the rDNA genes are transcriptionally active in T. brucei as has been shown in other eukaryotes ( 5 , 9 ). However, in addition to the rDNA, Pol I also transcribes the active VSG ES in bloodstream form T. brucei and the procyclin genes in insect form T. brucei ( 6 ). Bloodstream form T. brucei is coated with a dense protective layer of VSG. VSG is the most abundant protein in bloodstream T. brucei , yet it is encoded by a single-copy VSG gene expressed from 1 of ∼15 telomeric VSG ES transcription units ( 13 ). Possibly, T. brucei has recruited Pol I to transcribe the active VSG ES because of the high rates of transcription that can be achieved through high rates of initiation of Pol I ( 14 ). We are trying to understand how Pol I transcribed VSG ESs are controlled. A strict monoallelic exclusion operates, ensuring that only one ES is transcriptionally active at a time in a subnuclear compartment known as the expression site body (ESB) ( 15 ). However, it still unclear which regulatory features of Pol I transcription are shared between the rDNA and the ESs, and how Pol I regulation in T. brucei operates compared with other eukaryotes.
Here, we identify TDP1, a high mobility group (HMG) box containing protein, which facilitates Pol I transcription in T. brucei . TDP1 is highly enriched on active (compared with silent) ESs and the rDNA. Blocking TDP1 synthesis also results in a reduction in Pol I-derived transcripts. We and others have shown that the active ES in T. brucei is depleted of nucleosomes ( 16 , 17 ). Distribution of TDP1 shows an inverse pattern to histone distribution, and TDP1 knockdown results in a concomitant increase in histones on Pol I transcription units. We propose that TDP1 is an architectural chromatin protein that replaces histones on highly active Pol I transcription units in T. brucei , thereby maintaining an open chromatin structure and facilitating their transcription.
MATERIALS AND METHODS
Trypanosome strains and culturing
T. brucei brucei 427 was used for all experiments, and it was cultured as previously described ( 18 ) with 15% fetal calf serum for the bloodstream form. T. brucei 221GPI(VO2+) has an active VSGVO2 ES selected for with G418, and a silent VSG221 ES with eGFP and a puromycin resistance gene. The isogenic T. brucei 221GPI(221+) has an active VSG221 ES under puromycin selection ( 18 ). T. brucei 221GPI(VO2+) and 221GPI(221+) were transfected with the pMOTagHA-TDP construct, generating T. brucei VO2-HAT and 221-HAT with TDP1 tagged with an HA epitope. The MC 177TDP1 RNAi construct was integrated into T. brucei T3-SM, generating T. brucei T3-TDP1.1 and T3-TDP1.2, with an active VSGT3 ES selected for with blasticidin and a reporter eGFP immediately downstream of the silent VSG221 ES promoter ( 19 ). Procyclic form T. brucei was transfected with the pMOTag-HA-TDP construct to tag TDP1 with the HA epitope. For tandem affinity purification (TAP), TDP1 was tagged at the C-terminus with a PTP epitope ( 20 ) using the pC-PTP-hygroTDP construct.
Nucleic acid and protein analysis and constructs
The protein domains of T. brucei TDP1 (Tb927.3.3490) were identified using MyHits (ISB-SIB) and PROSITE. The MC 177 TDP1 RNAi construct has a 606-bp fragment amplified with the TDP_151s and TDP_756as primers ( Supplementary Table S5 ) and inserted in the p2T7 Ti -177 construct ( 21 ). The TDP1 C-terminus was tagged with the HA-epitope using the pMOTagHA-TDP1 construct, where a 660-bp fragment amplified with the TbTDP_154s_KpnI and TbTDP_789as_XhoI primers was inserted in pMOTag4H ( 22 ). TDP1 was tagged with the PTP epitope by amplifying the C-terminus on a 666-bp fragment with the TDPTAPApa_s and TDPTAPNot1_as primers, which was cloned into the pC-PTP vector ( 20 ).
Transcript analysis after TDP1 knockdown was performed using quantitative reverse transcriptase–polymerase chain reaction (qRT–PCR) in bloodstream form T. brucei T3-TDP1.1. TDP1 RNAi was induced with tetracycline, total RNA was isolated using the RNeasy kit (Qiagen) and was DNase treated with the TURBO DNA-free kit (Ambion), and cDNA was synthesized with random hexamer primers (Promega) and the Omniscript RT kit (Qiagen). qPCR was performed in triplicate on a 7500 Fast Real-Time PCR System (Applied Biosystems) using Brilliant II SYBR Green (Agilent Technologies). The reaction conditions for each primer pair were individually optimized. Primers used are previously described ( 17 ) or are provided in Supplementary Table S5 . Control reactions for each time point used DNAse-treated RNA without RT. Transcript levels were normalized to actin as indicated and plotted as fold increase with respect to the 0 h time point after subtraction of the no-RT controls. Three independent experiments were performed, and standard deviation was calculated.
Protein lysates were prepared and analysed using standard methods ( 23 ). Gels were blotted and probed with antibodies against BiP, HA tag (ab9110 and ab1424, AbCam), EP1 (Cedarlane), TDP1, VSG221 or protein-A (protA) (Sigma). The blots were reacted with the appropriate secondary antibodies and visualized with Western Lightning Plus ECL (PerkinElmer).
Immunofluorescence microscopy
Subcellular localization of epitope-tagged TDP1 was performed by fixing cells at an end concentration of 1% paraformaldehyde, permeabilizing with 0.1% NP-40 and reacting with an antibody against the HA epitope (ab9110, ab18181, AbCam), a polyclonal antibody against ProtA (Sigma) or a mouse monoclonal antibody against the uncharacterized nucleolar marker L1C6 ( 24 ) or rabbit polyclonal antibody against RNA polymerase I large subunit (RPA1) ( 15 ). Cells were treated with the relevant secondary antibody coupled to Alexa-488 or Alexa-594 (Molecular Probes) and stained with DAPI (Vector Laboratories). Microscopy was performed on a Zeiss Imager.M1 microscope.
Chromatin immunoprecipitation
Chromatin immunoprecipitation (ChIP) of the HA epitope was performed in T. brucei VO2-HAT1, 221-HAT1, PF HAT1 or respective parental cell lines as previously described ( 25 ). Histone ChIP was performed in T. brucei T3-TDP1.1 after induction of TDP1 RNAi for 24 h or in uninduced cells as a control. ChIP of histone H3 and histone H2A was performed as previously described ( 17 ). ChIP of histone H1 was performed using the TbH1 antibody, which was raised in rabbits against two conserved peptides recognizing the family of T. brucei H1 proteins ( 26 ). ChIP material was analysed using slot blots or qPCR as previously described ( 17 ). Data were analysed using the Student’s t -test (unpaired, two-tailed) (GraphPad Prism 5). Data were considered ‘significant’ where P = 0.01–0.05, ‘very significant’ where P = 0.001–0.01 or ‘extremely significant’ where P < 0.001.
Tandem affinity purification
TAP was performed as previously described ( 20 ). Purified material from ∼3.5 × 10 10 procyclic form T. brucei expressing PTP-epitope–tagged TDP1 was separated under denaturing conditions in a 4–15% sodium dodecyl sulphate–polyacrylamide gel electrophoresis. Bands were visualized with Imperial Protein Stain (Thermo Scientific), excised and analysed by liquid chromatography-tandem mass spectrometry (Central Proteomics Facility, University of Oxford).
RESULTS
TDP1 is an essential DNA-binding protein in bloodstream form T. brucei
TDP1 was originally identified in in vitro experiments as binding an octamer sequence located upstream of the VSG coding sequence in VSG ESs ( 27 ), and it has subsequently been isolated in experiments isolating proteins binding transcriptionally inactive T. brucei minichromosomes (K. Ersfeld, personal communication). We, therefore, investigated the role of TDP1 in transcriptional control in T. brucei . TDP1 contains two HMG domains (e = 9.7 × 10 −33 and e = 5.2 × 10 −21 ) and one DEK-C DNA-binding domain (e = 1.8 × 10 −5) (Prosite, MyHITS) ( Figure 1 A). TDP1 seems to be equivalent to an HMG box protein (HMGB), but it has a long N-terminal region not present in most other HMGB members and lacks an acidic C-terminal tail characteristic of many metazoan HMGB proteins ( 28 ). HMGB proteins are small abundant architectural chromatin proteins that can decrease the compactness of chromatin, thereby enhancing accessibility to regulatory transcription factors ( 29 ).
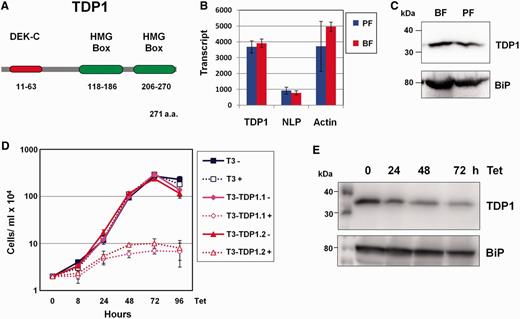
TDP1 is an essential HMG box-containing protein in T. brucei . ( A ) Schematic of TDP1 with its predicted protein domains. The HMG boxes and the DEK-C DNA-binding motifs (as predicted by ISB-SIB Motif Scan) are shown as ellipses with the corresponding amino acids indicated below. ( B ) Quantitation of TDP1 , NLP and actin transcript in both procyclic form (PF) and bloodstream form (BF) T. brucei using qRT–PCR. Transcript levels are shown in arbitrary units. Results are the mean of three independent experiments with standard deviation indicated with error bars. ( C ) Western blot analysis of TDP1 protein shows relatively comparable levels of TDP1 expression in BF and PF T. brucei . Lysate from 1 × 10 7 cells was loaded in each lane, the blot probed with an anti-TDP1 antibody and re-probed with anti-BiP antibody as a loading control. Sizes are indicated in kiloDaltons (kDa) on the left. ( D ) TDP1 is highly essential in BF T. brucei . Growth curves were performed in the presence (+) or absence (−) of tetracycline (Tet) to induce TDP1 RNAi. Parental T. brucei T3-SM ( 19 ) (T3) was compared with T. brucei T3-TDP1.1 and T3-TDP1.2 containing the TDP1 RNAi construct. Results are from three independent experiments with standard deviation indicated with error bars. ( E ) Western blot analysis of TDP1 protein knockdown after induction of TDP1 RNAi with tetracycline (Tet) for the time indicated in hours (h). Lysates from 1 × 10 6 cells were analysed at each time point. The blot was probed with an anti-TDP1 antibody and subsequently re-probed with anti-BiP antibody as a loading control.
TDP1 transcripts and protein are present at comparable levels in bloodstream and procyclic forms of T. brucei ( Figure 1 B and C). We investigated whether TDP1 is essential in bloodstream form T. brucei . We blocked TDP1 synthesis by inducing TDP1 RNAi in the T. brucei T3-TDP1.1 and T3-TDP1.2 cell lines, which resulted in a rapid growth arrest within 24 h as had been shown earlier ( 25 ) ( Figure 1 D). Western blot analysis showed that TDP1 is depleted to 78% original levels within 24 h, 69% by 48 h and 57% after 72 h induction of TDP1 RNAi ( Figure 1 E), indicating that even partial TDP1 depletion is sufficient to cause a rapid growth arrest in T. brucei . There was no evidence that this growth arrest occurred at any particular stage of the cell cycle.
TDP1 is enriched on RNA polymerase I-transcribed rDNA
To determine where TDP1 binds within the T. brucei genome, we tagged the C-terminus of an endogenous copy of TDP1 with the haemagglutinin (HA) epitope in the bloodstream form T. brucei 221GP1(VO2+) cell line ( 18 ). T. brucei 221GPI(VO2+) contains a neomycin resistance gene inserted immediately downstream of the promoter of the active VSGVO2 ES and a puromycin resistance gene in the silent VSG221 ES. Maintaining the cells on neomycin selection selects for an active VSGVO2 ES. Western blot analysis confirmed that TDP1 was tagged with the HA-epitope in bloodstream form T. brucei VO2-HAT1 and VO2-HAT2 ( Supplementary Figure S1A ). In addition, this was performed in procyclic form cells, generating the T. brucei PF-HAT1 and PF-HAT2 lines.
As TDP1 had earlier been shown to be a DNA-binding protein ( 27 ), we investigated its distribution on the T. brucei genome using ChIP. We performed ChIP using an anti-HA antibody with the T. brucei VO2-HAT1 clone containing one copy of TDP1 tagged with the HA-epitope, as well as the parental T. brucei 221GP1(VO2+) line. As an additional negative control, ChIP experiments were also simultaneously performed without using antibody. As a positive control, ChIP was performed using an antibody against histone H3 ( 17 ).
Immunoprecipitated material was analysed on slot blots, which were hybridized with probes for the 50-bp simple sequence repeats found in extensive arrays upstream of all known VSG ESs ( 30 ), as well as the 177-bp repeats found on T. brucei minichromosomes ( 31 ) ( Supplementary Figure S1B ). Both of these regions are transcriptionally silent in T. brucei . In agreement with the previous observation that TDP1 binds the 177-bp repeats (K. Ersfeld, personal communication), we could immunoprecipitate TDP1 on these sequences, although levels were relatively low (∼0.02% input precipitated) and not statistically significant ( Supplementary Table S1 ). Slightly higher (and statistically significant) levels of TDP1 were found on 50-bp repeats adjacent to ESs (∼0.04% input precipitated) ( Supplementary Table S1 ).
In contrast to the relatively low levels of TDP1 binding the non-transcribed simple sequence repeats, TDP1 was highly enriched at the rDNA locus ( Figure 2 ). Statistically significant amounts of TDP1 were found along the entire rDNA locus in bloodstream and procyclic form T. brucei ( Figure 2 B and Supplementary Table S1 ). However, TDP1 was particularly enriched immediately downstream of the rDNA promoter (primer pair 2c in Figure 2 A and B), with levels immunoprecipitated (∼0.85% input) ∼88-fold those found in wild-type bloodstream form T. brucei and 240-fold wild-type levels (∼0.59% input) in procyclic form T. brucei ( Figure 2 B and Supplementary Table S1 ). TDP1 levels immediately downstream of the rDNA promoter were ∼3- to 9-fold higher than in the rDNA intergenic spacer (primers 2a and 2l) and 1.3- to 2.5-fold higher than further downstream in the rDNA transcription unit (primers 2d and 2g) ( Figure 2 B and Supplementary Table S2 ). Levels of TDP1 binding the rDNA promoter itself (primer pair 2b) were 2- to 3-fold higher than levels in the non-transcribed rDNA spacer (primer pair 2a). We performed histone H3 ChIP at the same time as the TDP1 ChIP, and we observed a remarkable inverse pattern of TDP1 distribution compared with histone H3 at the rDNA locus ( Figure 2 C). Histone H3 is depleted in highly transcribed regions, such as the rDNA locus ( 16 , 17 ) where TDP1 is particularly enriched.
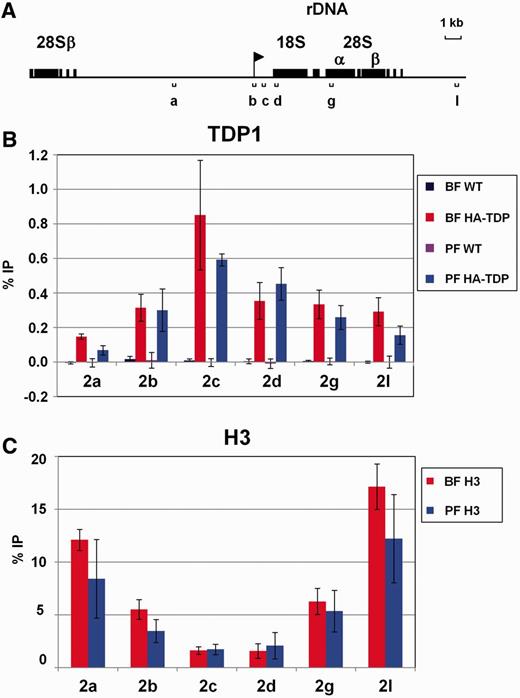
TDP1 is enriched at the Pol I-transcribed rDNA in inverse correlation with histone H3. ( A ) Schematic representing the rDNA locus. The rDNA promoter is indicated with a flag, and rDNA genes are indicated by boxes. Regions analysed using qPCR are shown with lettered brackets. ( B ) Increased abundance of TDP1 on transcribed regions of the rDNA as determined in ChIP experiments using HA-TDP1 expressing bloodstream form (BF HA-TDP) or procyclic form (PF HA-TDP) T. brucei. ChIP performed with the parental bloodstream form (BF WT) or procyclic form (PF WT) T. brucei not containing the HA epitope-tagged TDP1 is shown as a control. Results are presented as the percentage of input immunoprecipitated (% IP) after subtraction of the no antibody control as determined using qPCR (primers indicated in panel A). Results are the mean of three independent experiments with standard deviation indicated with error bars. ( C ) Relative depletion of histone H3 over the transcribed region of the rDNA locus in both bloodstream and procyclic form T. brucei determined using ChIP as in panel B.
TDP1 is enriched on the active Pol I transcribed VSG ES
We next investigated the distribution of TDP1 on other Pol I transcription units, including the VSG ESs. ES sequences are highly similar to each other ( 13 ) and are normally not easy to distinguish from each other using qPCR. We, therefore, introduced our HA-tagged copy of TDP1 into the isogenic bloodstream form T. brucei 221GPI(VO2+) and 221GPI(221+) lines ( 18 ), which contain single-copy drug resistance genes inserted immediately downstream of the promoter of the VSG221 and VSGVO2 ESs. In T. brucei 221GPI(VO2+), the VSGVO2 ES is active and can be selected for using neomycin selection, whereas in 221GPI(221+), the VSG221 ES is transcribed and can be maintained on puromycin selection ( Figure 3 A).
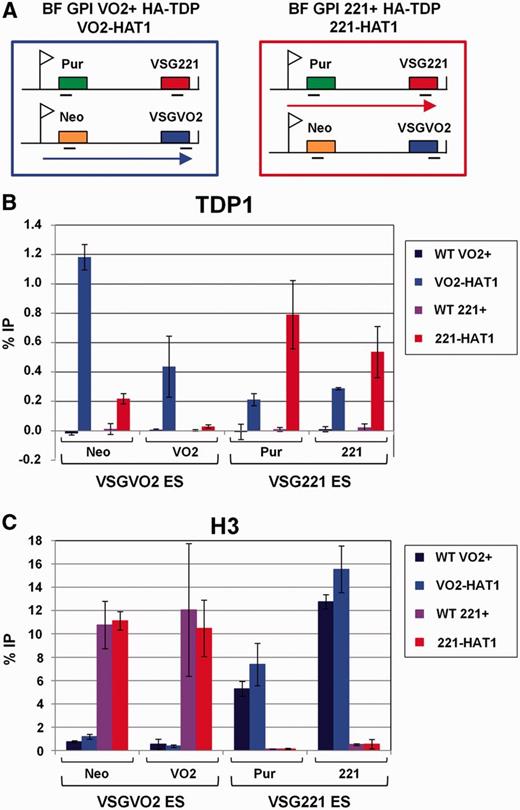
TDP1 is enriched at Pol I-transcribed VSG ESs in inverse correlation with histone H3. ( A ) Schematic showing the two isogenic BF T. brucei HA-TDP lines used in ChIP experiments that differ in the activation state of the VSG221 and VSGVO2 ESs. The ESs are shown, with promoters indicated with flags, relevant genes with filled boxes and transcription with an arrow. T. brucei BF GPI(VO2+) HA-TDP (VO2-HAT1) expresses VSGVO2 in the active ES, whereas BF GPI(221+) HA-TDP (221-HAT1) expresses VSG221 . The location of primers used for qPCR analysis is indicated with bars. ( B ) TDP1 is enriched on sequences present in the actively transcribed ES. ChIP was performed using parental T. brucei BF GPI(VO2+), (WT VO2+) and BF GPI (221+), (WT 221+) cells lacking HA-TDP1, as well as T. brucei HA-TDP1 expressing lines VO2+ HA-TDP (VO2-HAT1) and 221+ HA-TDP (221-HAT1) (indicated with coloured bars). Sequences present in either the VSGVO2 or VSG221 ESs are indicated below. The relative percentage of input immunoprecipitated (% IP) after subtraction of the no antibody control is shown as the mean from three independent experiments with the standard deviation represented with error bars. ( C ) Distribution of histone H3 shows an inverse correlation with TDP1 and is relatively depleted from the actively transcribed ES. qPCR analysis of immunoprecipitated material was performed as in panel B.
When we compared relative TDP1 abundance using ChIP material from T. brucei VO2-HAT1 or T. brucei 221-HAT1, we discovered high levels of TDP1-binding active ES sequences (0.8–1.2% input immunoprecipitated) ( Figure 3 B). Strikingly, TDP1 is highly enriched on the active compared with the silent ES. Levels of TDP1 were 3.7- to 5.4-fold higher on genes at the active compared with the silent ES immediately downstream of the ES promoter. Similarly, TDP1 levels were 1.8- to 14.7-fold higher at genes at the active compared with silent ES telomere ( Figure 3 B). Statistical analyses showed that the relative enrichment of TDP1 at the active versus silent ESs, particularly on the drug resistance genes immediately downstream of the ES promoters, was highly significant. TDP1 was relatively enriched on the active versus silent neomycin or puromycin genes with P -values of P < 0.001 or P < 0.0135, respectively ( Supplementary Table S2 ). As was the case at the rDNA loci, the distribution of TDP1 showed a striking inverse correlation with distribution of the core histone H3 ( Figure 3 C).
We also investigated TDP1 distribution on VSG ESs in procyclic form T. brucei . We included primers that can be expected to recognize most if not all ESs (‘all ESs’ in Supplementary Figure S2 ) and the VSG221 gene primer pair specific for the single-copy VSG221 (‘single copy–ES’ in Supplementary Figure S2 ). However, we found that TDP1 was in general more abundantly binding ESs in bloodstream form compared with procyclic form cells. This is likely to be a consequence of the high levels of TDP1 binding the active ES in bloodstream form T. brucei .
We next investigated TDP1 distribution over the EP procyclin transcription unit in both bloodstream and procyclic form T. brucei . TDP1 was found binding the region upstream of the EP procyclin promoter and within the EP transcription unit itself in both life cycle stages ( Supplementary Figure S3 ). There were significant levels of TDP1 binding these sequences in both life cycle stages, possibly as a consequence of transcriptional activity of these sequences even in bloodstream form cells ( 32 ). However, TDP1 was particularly depleted at the EP promoter itself in bloodstream form T. brucei (primer ‘3c’) ( Supplementary Figure S3B ). TDP1 was also found binding the Pol II spliced leader and Pol III 5S rRNA transcription units, but we did not find a significant difference in TDP1 enrichment between these genes and their intergenic regions ( Supplementary Figure S4 ). Total levels of TDP1 immunoprecipitated immediately downstream of the rDNA promoter were ∼0.6–0.8% input, which is ∼15- to 43-fold higher than the levels observed binding the simple sequence repeats and 2- to 8-fold higher than levels of TDP1 binding the RNA polymerase II (Pol II) and Pol III transcription units ( Supplementary Figure S4 ). Although TDP1 clearly binds various genomic regions, including non-transcribed sequences and Pol II and Pol III transcription units, its relative enrichment on active Pol I transcription units strongly suggests that TDP1 is a DNA-binding protein, which is important for facilitating Pol I transcription.
TDP1 is enriched in the nucleolus and the ESB
To determine the subcellular localization of TDP1, we performed immunofluorescence microscopy on our T. brucei VO2-HAT1 epitope-tagged clone using an anti-HA epitope antibody. This confirmed that TDP1 is a nuclear protein distributed throughout the nucleus in both bloodstream and procyclic form T. brucei ( Figure 4 A). However, most cells showed a specific subnuclear enrichment of TDP1 in either one or two discrete spots ( Figure 4 B). Using an antibody against the nucleolar marker L1C6 ( 24 ), we found that TDP1 co-localized with this nucleolar marker in virtually all cells examined in both bloodstream and insect form trypanosomes ( Figure 4 A).
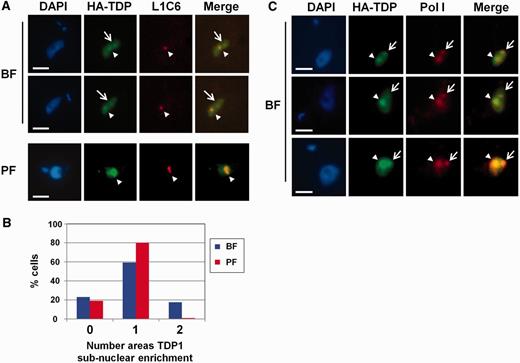
TDP1 is predominantly located in the Pol I-enriched nucleolus and ESB. ( A ) Panels show representative HA-TDP1 expressing bloodstream form (BF) or procyclic form (PF) cells stained with the DNA stain DAPI. Cells were reacted with an anti-HA antibody to visualize HA-TDP1 or with an antibody against the nucleolar marker L1C6 to visualize the Pol I-enriched nucleolus. The merged images are shown on the right. Arrowheads show TDP1 and L1C6 enriched spots corresponding to the nucleolus. Arrows indicate additional subnuclear TDP1 enriched spots not corresponding with the nucleolus. Scale bars indicate 2.5 µm. ( B ) Percentage of cells with different numbers of distinct TDP1 containing subnuclear spots in BF or PF T. brucei . The mean of two experiments is shown with ∼100 cells analysed per experiment. ( C ) TDP1 co-localizes with Pol I in T. brucei . The panels are as in panel A, only an antibody against the T. brucei RPA1 was used (Pol I). Merged images are shown on the right. Arrowheads show areas of TDP1 enrichment corresponding with the nucleolus, whereas arrows indicate the additional subnuclear areas of TDP1 enrichment corresponding to the ESB. Scale bars indicate 2.5 µm.
In ∼80% of the analysed cells, TDP1 was enriched in the nucleolus. However, in ∼20% of the bloodstream form cells, an additional smaller spot was observed (arrow in Figure 4 A), which did not co-localize with the nucleolar marker. This additional TDP1 spot was not observed in an equivalent number of procyclic form cells which were analysed, and it seemed to correspond to the bloodstream form-specific ESB ( Figure 4 B) ( 15 ). As Pol I can be expected to be enriched in both the nucleolus and the ESB, we investigated whether TDP1 co-localized with Pol I. Using an antibody against the large subunit of T. brucei RNA Pol I, we found that this was indeed the case ( Figure 4 C). We observed the nucleolus using this Pol I antibody in >80% of the bloodstream form T. brucei cells and the ESB in ∼15–20% of cells. There was a high extent of overlap of Pol I and TDP1 signals, not only in cells where the ESB was visible but also in cells in which only the nucleolus was visible. This observed enrichment of TDP1 in the Pol I-enriched nucleolus and ESB agrees with our ChIP analysis that TDP1 preferentially binds in Pol I transcription units. In addition to performing immunofluorescence microscopy experiments using an anti-HA antibody, we also used an antibody raised against the TDP1 protein itself. The signals from the anti-HA and anti-TDP1 antibodies invariably overlapped, indicating that they were detecting the same protein ( Supplementary Figure S5 ). This enrichment of TDP1 in the nucleolus (and ESB) is in contrast to essential T. brucei transcription proteins like bromodomain factor BDF3, which does not show a clear enrichment in the nucleolus ( 33 ).
TDP1 depletion leads to a reduction in Pol I transcripts
We had earlier observed that blocking synthesis of TDP1 using RNAi did not lead to de-repression of silent fluorescent reporter genes inserted into non-transcribed areas of the T. brucei genome, including minichromosomes, VSG basic copy arrays and the silent VSG ESs ( 25 ). As TDP1 is enriched on the active ES Pol I transcription unit, we hypothesized that TDP1 is involved in facilitating Pol I transcription rather than repressing it. We, therefore, investigated the effect of blocking TDP1 synthesis on different transcripts in the cell. We induced TDP1 RNAi in the T. brucei T3-TDP1.1 cell line ( Figure 5 A) and isolated total RNA for the preparation of cDNA. As expected, TDP1 transcript was reduced to ∼20% normal levels after 12 h induction of TDP1 RNAi ( Figure 5 B). In contrast, levels of the Pol II-derived transcripts for actin, γ-tubulin, Pol I large subunit, α-tubulin precursor transcript and Pol I large subunit precursor transcript did not change significantly ( Figure 5 B and Supplementary Table S3 ).
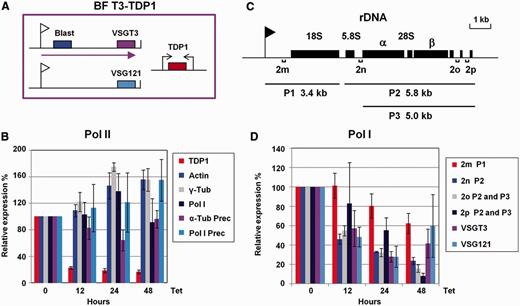
Depletion of TDP1 results in decrease of Pol I-derived transcripts. Total RNA was isolated after the induction of TDP1 RNAi for the indicated time, cDNA was made and qPCR performed to monitor transcript levels from various loci. ( A ) Schematic of T. brucei BF T3-TDP1 that stably expresses VSGT3 in the active ES, which is selected for with blasticidin (Blast). ES promoters are indicated with flags, relevant genes with boxes and transcription with an arrow. TDP1 RNAi is expressed from opposing tetracycline inducible T7 promoters (arrows). ( B ) Analysis of Pol II transcripts after induction of TDP1 RNAi with tetracycline (Tet) for the time indicated below. Transcripts analysed are: TDP1 , actin, γ-tubulin (γ-tub) and Pol I and precursor transcripts of α-tubulin and Pol I. Data shown in this panel are not normalized to the levels of another transcript, with the exception of the TDP1 transcript, which is normalized to actin. ( C ) Schematic of the rDNA locus. The promoter is indicated with a flag and various rRNA genes with boxes. Precursor rRNA transcripts as determined previously ( 34 ) are indicated below, where P1 is 3.4 kb, P2 is 5.8 kb and P3 is 5.0 kb. Regions analysed by qPCR are shown with lettered brackets. ( D ) Reduction in Pol I-derived transcripts after induction of TDP1 RNAi. Relative transcript amounts were quantitated with the primers indicated in panel C. Levels of rRNA precursor transcript or transcript from VSGT3 (in the active ES) or VSG121 (in a silent ES) were also monitored. Data shown have been normalized against values for the actin transcript shown in panel B. Relative transcript levels were calculated by dividing the value for the level of transcript at any given time point by the level present in uninduced (0 h) samples. Results are the mean of triplicate independent experiments, with standard deviation indicated with error bars.
We next investigated the effect of TDP1 knockdown on various Pol I transcripts. Functional rRNAs are processed from long precursor rRNA transcripts through a series of cleavage steps. We designed a series of qPCR primers that would be expected to recognize rRNA precursor transcripts as characterized previously ( 34 ), rather than stable rRNA ( Figure 5 C). After inducing TDP1 RNAi, we observed a decrease in rRNA precursor transcripts ( Supplementary Table S3 ). TDP1 knockdown for 48 h resulted in a particularly striking decrease in rRNA precursor transcript extending down to the end of the rDNA transcription unit, with levels falling to ∼10–20% normal levels after 48 h (primers ‘2n’, ‘2o’ and ‘2p’ in Figure 5 D and Supplementary Table S3 ). In the case of the 3.4-kb precursor transcript extending immediately downstream of the rDNA promoter (primer ‘2m’ in Figure 5 D), levels were reduced to 60% normal levels.
We also monitored the levels of VSG transcript from the active VSGT3 ES and the silent VSG121 ES . Levels of both the VSGT3 and the VSG121 transcripts fell to ∼30% normal levels after 24 h induction of TDP1 RNAi ( Figure 5 D and Supplementary Table S3 ). These results show a reduction in fully processive transcription of Pol I transcribed loci after the depletion of TDP1. This reduction in Pol I-derived transcripts was observed not only for transcripts from the active VSGT3 ES, but also for transcripts derived from ‘silent’ ESs ( VSG121 ES), which are known to show a low level of transcriptional activity ( 35 ). These results indicate that the inverse distribution of TDP1 with histones is not merely a secondary consequence of transcription status, but that TDP1 plays a role in facilitating Pol I transcription.
TDP1 depletion results in an increase in histones at Pol I transcription units
We next tried to determine whether TDP1 functions in a complex. To identify potential TDP1 binding partners, we tagged TDP1 with the PTP epitope in procyclic form T. brucei ( 20 ), generating the T. brucei TAP-TDP1.1 and TAP-TDP1.2 ( Supplementary Figure S6A ). We verified that the tagged TDP1 protein was present in the nucleus, including the nucleolus, whereas the control protein TAP-NLP seemed to be excluded from the nucleolus ( Supplementary Figure S6B ) ( 25 ). However, we did not see clear areas of subnuclear enrichment of TDP1, as seen with HA-tagged TDP1 using either anti-TDP1 or anti-HA antibodies. We next purified TDP1 from crude extracts under native non-denaturing conditions as previously described ( 20 ) ( Supplementary Figure S6C ). We did not find evidence that TDP1 functions in a complex. We found that TDP1 interacts with the core histones, although the relatively small number of peptides identified ( Supplementary Figure S6D ) could indicate that these interactions are transient. However, unfortunately, we were not able to determine whether the TAP-tagged TDP1 protein was functional in these cells. We have been unable to knockout even a single copy of TDP1 in wild-type T. brucei , indicating haplo-insufficiency. These observations are supported by the Western blot analyses in Figure 1 E, where even relatively minor knockdown of TDP1 in the first 24 h was sufficient to result in a severe growth arrest. We, therefore, cannot rule out the possibility that TAP-TDP1 is not fully functional; and interacts with histones differently compared with wild-type TDP1.
We next determined how TDP1 affects nucleosome abundance in various regions of the T. brucei genome. Using ChIP, we determined the distribution of the core histones H3 and H2A, as well as the linker histone H1 in cells where TDP1 RNAi had been induced for 24 h ( Figure 6 ). Using qPCR analysis, we first compared histone abundance in Pol I transcribed regions. As had been shown earlier, active ESs are highly depleted of histones compared with silent ESs ( Figure 6 A) ( 16 , 17 ). Knockdown of TDP1 synthesis for 24 h results in a statistically significant increase in abundance of histones H3, H2A and H1 on the active VSGT3 ES ( Figure 6 A and Supplementary Figure S7 ). Histones are relatively abundant on the silent VSG221 ES, and knockdown of TDP1 did not result in a significant change in their levels.
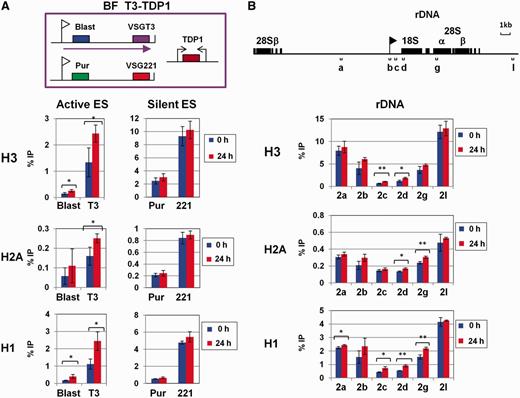
TDP1 depletion results in increased histone abundance at Pol I transcription units. ( A ) Increased histone abundance on the active ES after TDP1 knockdown. A schematic of T. brucei BF T3-TDP1 is shown, which is labelled as in Figure 5 , only a silent VSG221 ES with a puromycin resistance gene (Pur) behind the ES promoter is shown. ChIP was performed using antibodies for the core histones H3 and H2A or the linker histone H1 after the induction of TDP1 RNAi for 0 or 24 h. Graphs show the percentage of input material precipitated (% IP), presented as the mean of three independent experiments with the standard deviation indicated with error bars. Statistically significant differences between the two time points are indicated with asterisks (* P < 0.05; ** P < 0.01). ( B ) Increased abundance of histones at the rDNA transcription units after TDP1 depletion. A schematic of the rDNA locus is shown with the promoter indicated with a flag, and rDNA genes are indicated with boxes. Regions used for qPCR analysis are indicated with lettered brackets. ChIP was performed using antibodies against histones H3, H2A and linker histone H1, which was analysed and quantitated as in panel A.
Similar to as seen at ESs, histones H3, H2A and H1 are relatively depleted within the rDNA transcription units ( Figure 6 B) ( 16 , 17 ). Knockdown of TDP1 resulted in a statistically significant increase in histone abundance at the rDNA loci, particularly within the rDNA transcription units themselves ( Figure 6 B, primer pairs ‘2c’, ‘2d’ and ‘2g’) ( Supplementary Table S4 ). This indicates that TDP1 could be an architectural chromatin protein replacing nucleosomes on highly transcribed regions of the T. brucei genome. There was no statistically significant change in levels of histones H3 and H2A observed in different Pol II or Pol III transcription units after TDP1 knockdown ( Supplementary Figure S7 ). Levels of the linker histone H1 decreased in some Pol II transcription units after TDP1 knockdown, but this was not always the case and was not observed in Pol III transcription units.
DISCUSSION
We show here that TDP1 is an essential HMG box protein, which is highly enriched on Pol I transcription units in T. brucei . This is the first architectural chromatin protein shown to facilitate Pol I transcription of rDNA and ESs in T. brucei . High levels of TDP1 were found binding the active VSG ES (0.8–1.2% input immunoprecipitated). TDP1 levels immediately downstream of the ES promoter were 3.7- to 5.4-fold enriched at the active compared with the silent ES and 1.8- to 14.7-fold higher at the telomere of the active ES compared with the silent ES. Similarly, TDP1 was highly enriched in the rDNA transcription unit (up to 0.8% input), with particularly high levels found immediately downstream of the rDNA promoter. TDP1 was also found binding non-transcribed regions like the 50-bp repeat sequences, and Pol II and Pol III transcription units, but was relatively enriched on active Pol I transcription units. This TDP1 enrichment on Pol I transcription units shows a striking inverse correlation with histone distribution. We postulate that TDP1 is a chromatin architectural protein replacing histones on the highly transcribed Pol I transcription units in T. brucei . This is supported by the observation that TDP1 knockdown results in an increase in histones H3, H2A and H1 both at the active ES and immediately downstream of the rDNA promoter. In addition to being enriched on Pol I transcription units, TDP1 seems to facilitate Pol I transcription, as TDP1 depletion results in a reduction in ES transcripts as well as rRNA precursor transcripts. This necessity of TDP1 for Pol I transcription could explain the observed acute lethality of TDP1 knockdown in T. brucei.
HMG proteins are the most abundant architectural chromatin proteins in eukaryotes after histones ( 36 , 37 ). TDP1 seems to be a T. brucei HMGB protein on the basis of the tandem-conserved HMG box DNA-binding motifs ( 29 ). HMGB proteins are highly dynamic nuclear proteins, which can modulate changes in chromatin ( 38 ). HMGB proteins bind non-canonical DNA structures (including bent or unwound DNA) with high affinity, and they can distort or bend DNA ( 29 , 39 ). HMGB proteins bind the entry/exit site of the nucleosome similar to the linker histone H1. However, in contrast to histone H1 (which stabilizes chromatin and makes it less accessible to transcription factors), HMGB binding decreases the compactness of chromatin and facilitates recruitment of transcription factors ( 37 ). It is thought that HMG proteins compete with histone H1 for DNA binding, and that this yin–yang relationship results in a mutually exclusive distribution modulating nucleosome accessibility in different chromatin domains ( 37 , 40 , 41 ).
In S. cerevisiae , the actively transcribed rDNA genes are thought to be largely devoid of histone molecules and are instead coated with the HMG protein Hmo1 ( 10 ). S. cerevisiae Hmo1 is an HMGB protein, which is part of the rDNA transcription apparatus ( 42 , 43 ). Hmo1 binds the rDNA locus, particularly within the rRNA transcription units, and is necessary for rRNA transcription and processing ( 44 ). Hmo1 is, therefore, an important constituent of transcriptionally active rRNA chromatin in S. cerevisiae ( 10 ).
Is TDP1 the T. brucei functional equivalent of Hmo1? Our data would indicate that there are clear similarities. Similar to Hmo1 in S. cerevisiae , TDP1 is enriched at rDNA transcription units in T. brucei . However, in addition, we see a striking enrichment of TDP1 on the active VSG ES, which is a Pol I transcription unit with protein coding genes. TDP1 depletion in T. brucei also results in a reduction in Pol I-derived precursor transcripts, similar to as seen after Hmo1 depletion in S. cerevisiae ( 44 ). In yeast, it has been proposed that a competitive interplay between Hmo1 and histone H1 results in Hmo1 localizing to Pol I transcription units, which are depleted of this histone ( 40 ). We have evidence for this mutually exclusive relationship occurring in T. brucei. Depletion of TDP1 within the cell results in an increase in the linker histone H1 as well as the core histones H3 and H2A at both the active VSG ES and within the rDNA transcription units.
The active VSG ES in T. brucei is transcribed at a high rate by Pol I, and it is also highly depleted of nucleosomes ( 16 , 17 ). Our ChIP results show that TDP1 is highly abundant on these transcriptionally active ES sequences, indicating that the active VSG ES is not present as naked DNA but is coated with TDP1. One function of TDP1 could be as an architectural chromatin protein preventing DNA damage occurring on these highly transcribed DNA sequences, which are to a great extent stripped of nucleosomes. However, an additional function of TDP1 could be to recruit chromatin remodelers, which increase chromatin accessibility, thereby allowing high rates of Pol I transcription. These results are in contrast to those described for the elongator protein 3b, which is also specifically localized to nucleoli (but not the ESB) and seems to negatively regulate rDNA transcription in T. brucei ( 45 ).
Another HMG box containing protein facilitating rDNA transcription is mammalian upstream binding factor (UBF), which has been proposed to function in an analogous fashion to S. cerevisiae Hmo1 ( 42 , 44 ). In mammals, UBF contains five HMG box domains and is a component of the Pol I transcription machinery ( 46 , 47 ). UBF is involved in formation of the rRNA pre-initiation complex, but it binds throughout the rDNA transcription unit ( 48 ). Targeting of UBF to heterochromatin induces a large-scale de-condensation of chromatin ( 49 ). It has also been shown that UBF (similar to Hmo1) outcompetes histone H1 for binding to nucleosomal cores and displaces H1 from the nucleosomes ( 40 , 50 ).
Typically, no more than 50% of the rDNA loci are transcribed at a time ( 5 , 51 ). UBF depletion leads to a reduction in the number of rDNA loci that are transcriptionally active, and it results in stable silencing by promoting the assembly of histone H1-associated transcriptionally inactive chromatin on some of these rDNA transcription units ( 52 ). TDP1 shares some features with UBF but has only two HMG boxes compared with the five to six HMG boxes present in UBF, and it does not contain the typically metazoan HMGB feature of an acidic C-terminal tail characteristic of UBF ( 28 ). In addition, TDP1 contains the DNA-binding domain DEK-C. However, despite some differences, T. brucei TDP1 shares similarities with S. cerevisiae Hmo1 and mammalian UBF, in being an HMG box-containing chromatin architectural protein, which is key for active transcription of Pol I transcription units.
The active ES is highly depleted of nucleosomes compared with silent ESs, and it is increasingly clear that chromatin remodelling plays a key role in VSG ES control ( 53 , 54 ). Chromatin remodelers with a key role in ES silencing include the SNF2 domain containing protein TbISWI, the nucleoplasmin-like protein NLP, and the FACT complex ( 19 , 25 , 55 ). In addition, the RAP1 chromatin protein is key for ES silencing extending from the T. brucei telomere ( 56 ); and different histone deacetylases and methyltransferases play a role in modulating ES expression and rates of VSG switching ( 57 , 58 ). Here, we describe the first chromatin architectural protein facilitating Pol I transcription in T. brucei . We postulate that T. brucei TDP1 is functionally related to S. cerevisiae Hmo1, and that it takes the place of histones on the highly open chromatin of the transcriptionally active Pol I transcription units, including the active ES and the active rDNA transcription units.
In S. cerevisiae , null mutants of Hmo1 are viable, although there is a restriction on growth ( 42 , 59 ). In contrast, TDP1 depletion is highly lethal in bloodstream form T. brucei. This difference in phenotypes could be a consequence of the necessity for continuous high levels of Pol I transcription of the surface protein genes in the active VSG ES in T. brucei . We have shown that TDP1 knockdown results in a decrease in rRNA precursors, and presumably levels of functional ribosomes. It is possible that because of this requirement for high levels of expression of the surface proteins, even a minor reduction in efficiency of Pol I transcription in bloodstream form T. brucei is enough to create a dramatically lethal phenotype. This observation means that chemical inhibitors that specifically target the Pol I transcription machinery of African trypanosomes (including proteins like TDP1 in T. brucei ) could provide promising lead drug compounds for tackling this evasive parasite.
FUNDING
Wellcome Trust, G.R. is a Wellcome Senior Fellow in the Basic Biomedical Sciences; Clarendon Fund and the Queen’s College Graduate Scholarship, Oxford (to M.S.N.). Funding for open access charge: The Wellcome Trust.
Conflict of interest statement . None declared.
ACKNOWLEDGEMENTS
The authors are grateful to Klaus Ersfeld, Megan Povelones, Viola Denninger, Kathrin Witmer, Anna Trenaman, Sarah Khawaja and Vlad Sandu-Dragu for discussions and comments on the manuscript. They thank Klaus Ersfeld for sharing information on TDP1 and providing TDP1 antibody. They are grateful to Arthur Günzl for help with the PTP protein affinity purification experiments. They thank Miguel Navarro for the TbRPA1 antibody, Keith Gull for the L1C6 antibody and Jay Bangs for BiP antibody. They thank Matthew Wand and Andrew Voak for making DNA constructs and Thomas Seebeck for epitope tagging constructs.

Comments