


Abstract
Methylation of DNA at CpG dinucleotides represents one of the most important epigenetic mechanisms involved in the control of gene expression in vertebrate cells. In this report, we conducted nucleosome reconstitution experiments in conjunction with high-throughput sequencing on 572 KB of human DNA and 668 KB of mouse DNA that was unmethylated or methylated in order to investigate the effects of this epigenetic modification on the positioning and stability of nucleosomes. The results demonstrated that a subset of nucleosomes positioned by nucleotide sequence was sensitive to methylation where the modification increased the affinity of these sequences for the histone octamer. The features that distinguished these nucleosomes from the bulk of the methylation-insensitive nucleosomes were an increase in the frequency of CpG dinucleotides and a unique rotational orientation of CpGs such that their minor grooves tended to face toward the histones in the nucleosome rather than away. These methylation-sensitive nucleosomes were preferentially associated with exons as compared to introns while unmethylated CpG islands near transcription start sites became enriched in nucleosomes upon methylation. The results of this study suggest that the effects of DNA methylation on nucleosome stability in vitro can recapitulate what has been observed in the cell and provide a direct link between DNA methylation and the structure and function of chromatin.
INTRODUCTION
The methylation of DNA is essential for normal development and cellular differentiation and has been implicated in a number of processes including genomic imprinting, stabilization of the inactivated X-chromosome and suppression of repetitive sequences ( 1–3 ). DNA methylation during normal development is also associated with gene silencing in a tissue-specific manner whereas aberrant methylation patterns are thought to play a causative role in the induction of abnormal gene expression during cancer ( 1 , 4–7 ). The informational content for the control of gene expression by DNA methylation ultimately resides within the DNA sequence ( 8 ), but precisely how the sequence dictates the patterns of differential DNA methylation in a gene, tissue and developmental stage-specific manner have not been clearly defined. Moreover, there is no universal agreement on the mechanisms by which alterations in DNA methylation patterns lead to changes in gene expression, yet an understanding of the processes is critical to the elucidation of gene regulatory circuits in higher organisms.
A common feature of the processes that are influenced by DNA methylation is the correlation between methylation and chromatin compaction, and at least some of these processes can be traced to the level of the nucleosome. For example, the promoters for housekeeping genes in mammals frequently reside within regions referred to as CpG islands (CpGIs), which are rich in G+Cs and especially CpG dinucleotides. These regions usually remain unmethylated and nucleosome free or associated with loosely bound nucleosomes in somatic cells whereas the bulk of the CpGs in the remainder of the genome are heavily methylated ( 1 , 4–9 ). During cancer, a small subset of the CpGIs become methylated and packaged into nucleosomes, and this mechanism has been evoked to explain the transcriptional silencing of some tumor suppressor genes ( 1 ).
The mechanisms by which methylation is targeted to specific regions of the chromosome remain a central question in the epigenetic control of the genome. The methylation status of transcription factor binding sites or other sites recognized by regulatory proteins may be involved in this effect, and this idea is particularly appealing since it could provide a way for transacting factors to control developmental processes in a gene and tissue-specific manner. Recent studies have strongly pointed to this mechanism in the establishment of the methylation status of CpGIs ( 8 , 9 ). Another important question is the mechanism by which methylation leads to gene silencing. A common view for the this effector arm of the silencing process is that the mCpG serves as a marker for methyl cytosine binding domain (MBD) proteins, which recruit co-repressor protein complexes that alter the structure and function of chromatin ( 10 , 11 ).
A few studies have pointed to an alternative direct action of methylation on DNA in chromatin. Methylation has been reported to promote the compaction and stabilization of the nucleosome by causing the overwrapping of the DNA around the histone octamer ( 12 , 13 ). Methylation also increased the affinity of the octamer for DNA sequences that have a short stretch of CGG/CCG repeats ( 14 ). Alterations in nucleosome assembly mediated by CGG/CCG expansions and DNA methylation presumably generate a compact chromatin structure which has been suggested to be the major cause of fragile X syndrome ( 15 ). In contrast, it has been demonstrated that the methylation of a single CpG triplet located at −15 bp from the nucleosome dyad caused a dramatic reduction in the affinity and positioning activity of a nucleosome assembled onto the promoter region of the adult beta globin gene ( 16 ). This site has been reported to be a major region in the nucleosome for DNA distortion and studies have shown that it is required for high nucleosome stability and positioning ( 17 , 18 ). Still other experiments have reported that methylation has little or no effect on nucleosome stability or positioning ( 19 , 20 ). It is conceivable that these seemingly contradictory results are due to different properties of the nucleosomes under study. This possibility was examined in this report by assessing the role of DNA methylation on the stability and positioning of a large ensemble of nucleosomes.
MATERIALS AND METHODS
Sample preparation
BAC clones ( Supplementary Figures S1 and Supplementary Data ) on LB agar stabs were obtained from the BACPAC Resources Center and were grown according to instructions provided by the supplier. BAC DNAs were isolated from cleared lysates by two polyethylene glycol precipitations followed by several phenol/chloroform extractions and ethanol precipitations. Purity was assessed by EcoRI restriction digests of the individual BAC clones on a 0.8% agarose gel ( Supplementary Figure S3A ). Equal molar mixtures of the BAC DNAs were prepared based on their optical densities and sequence lengths, sheared 10 times through a 26 gauge needle, and reconstituted into nucleosomes under selective pressure for nucleosome-favoring sequences. The DNA was mixed with core histones isolated from H1/H5-stripped chicken erythrocyte nucleosomes as described previously ( 21 ) in 2.0 M NaCl at a DNA–histone mass ratio of 5:1 with 60 µg of DNA in a volume of 150 µl. Nucleosome reconstitution was carried out by gradient dialysis (2.0 M NaCl to 0.01 M NaCl) over a period of 16 h at 4°C. Samples (30 µg DNA in 2 parallel reactions) were digested with micrococcal nuclease (MNase) using 1 Worthington unit at 37°C for 5 min with 1 mM CaCl 2 in a volume of 200 µl. The samples were then deproteinized, protected fragments were extracted, and mononucleosome-length DNA was isolated by gel electrophoresis on a 5% polyacrylamide gel ( Supplementary Figure S3C ).
The CpGs in unsheared, equal molar mixtures of the BAC DNAs were methylated by treatment with CpG Methyltransferase (M.SssI) from New England Biolabs (2 Units of Methyltransferase/µg DNA overnight at 30°C), which is claimed to methylate all cytosine residues in CpG dinucleotides. Completion of CpG methylation was verified by resistance to digestion with methylation-specific endonucleases (BstUI and HhaI) with subsequent analysis on an agarose gel ( Supplementary Figure S3B ). The hypermethylated BAC DNAs were extracted, sheared 10 times through a 26 gauge needle, reconstituted into nucleosomes, and mononucleosome-length DNA was isolated as described above ( Supplementary Figure S3D ). For controls, naked DNA was fragmented to a length of ∼150 bp with a Covaris sonicator, and naked DNA (30 µg) was digested separately with MNase using 0.3 Worthington units at 37°C for 5 min with 1 mM CaCl 2 in a volume of 120 µl. These controls were then size-selected on a 5% polyacrylamide gel ( Supplementary Figures S3E and Supplementary Data ). All nucleosome samples were biological, not technical replicates, and replicates were produced on different days. For the human data, there were three unmethylated and two methylated nucleosome samples, and for the mouse data, there were two unmethylated and two methylated nucleosome samples ( Supplementary Tables S1 and Supplementary Data ).
DNA sequencing and midpoint localization
The unmethylated/methylated nucleosome and control samples for both human and mouse were submitted to the Purdue Genomics Core Facility where these 14 samples were end-repaired, barcoded, amplified and simultaneously sequenced with the SOLiD paired-end sequencing technology in a single run on a quarter slide, and reads were mapped to the reference sequence with the Bioscope software. Information in the output SAM files were used to identify and localize the midpoints of properly paired reads with desired insert lengths (141–155 bp) to exclude severely over and under digested nucleosomal DNA. Only properly paired reads with the following SAM flags were utilized: 83, 99, 147, 163, 1107, 1123, 1171 and 1187. We defined the midpoint of a paired-end read by adding int((insert length − 1)/2) to the left-most coordinate of the paired-end read (int = integer truncation). Therefore, if a read was 147 bp in length, the midpoint would be located 73 bp downstream from the left-most coordinate. The number of properly paired reads at midpoints was then determined at each position for each individual library ( Supplementary Tables S1 and Supplementary Data ). Escherichia coli contamination in the samples is discussed in the Supplementary Methods .
Differential nucleosome affinity analysis
The properly paired read counts in the three unmethylated and two methylated human nucleosome libraries at each position were normalized by the average number of reads at midpoints per base pair, which is equal to the total number of reads in a library divided by the combined lengths of the BACs. To account for midpoint discrepancies, the counts were converted to 3 bp sliding window sums. After normalization and conversion to 3 bp sums, the combined unmethylated and methylated libraries were produced by adding the counts at each position together and then dividing by three and two, which are the number of unmethylated and methylated libraries, respectively. A total of 11 448 nucleosome positions were then generated by non-specific filtering and a custom peak-finding algorithm, using the combined unmethylated and methylated libraries. For each position in the reference sequence, if the center of an 11 bp sliding window contained the maximum number of reads in either the combined unmethylated or methylated libraries AND if the nucleosome midpoint possessed >10 normalized reads, then that position was considered a peak and used for analysis of differential nucleosome affinity between the unmethylated and methylated states. For each of these positions, the fractional difference (FD) between the combined unmethylated and methylated libraries was computed by dividing the absolute difference between the unmethylated and methylated peaks by the larger peak of the two and multiplying by −1 if the larger peak was from the unmethylated library.
For differential nucleosome affinity analysis, the statistical software package DESeq was utilized, which is implemented in R and distributed by the Bioconductor project ( 22 ). DESeq fits count data to a negative binomial model and is typically used to test for differential gene expression in RNA-Seq datasets with small sample sizes. In the present study, the number of normalized reads in 3 bp sums (rounded to the nearest integer) from the three individual unmethylated and the two individual methylated replicates at the 11 448 nucleosome midpoint positions were used as the count dataset input into DESeq. Since the data were already normalized, DESeq’s normalization step was not used, and the size factors for the 5 libraries were set to 1. With the ‘estimateVarianceFunctions’ and ‘nbinomtest’ commands, DESeq assigned P -values to the 11 448 positions, and these P -values were used to identify differential nucleosome affinity at specific sites between the unmethylated and methylated conditions. Adjusted P -values were computed using the Benjamini–Hochburg method.
External data acquisition and processing
The yeast nucleosomal DNA sequence library was derived from an in vitro nucleosome occupancy experiment ( 23 ). These data were acquired from the Gene Expression Omnibus (GEO) under accession number GSE13622 (GSM351491). The information from this source provided the yeast genome coordinates (the 5′ ends of each read with directionality) as well as the number of reads for each procured sequence. The Caenorhabditis elegans nucleosome data ( 24 ) were obtained from the Short Read Archive (SRA) under accession number SRA001023 (SRX000425). The Arabidopsis nucleosome data ( 25 ) were obtained from GEO/SRA under accession number GSE21673 (SRX021423 and SRX021424). Processed BS-seq data from human peripheral blood mononuclear cells ( 26 ) were obtained from GEO under accession number GSE17972.
The short reads from the nucleosome studies in C. elegans and Arabidopsis were mapped using the Bowtie software ( 27 ) to the ce6 and tair9 assemblies, respectively. A two mismatch threshold was applied along with the ‘‘–m 1’’ reporting mode to ensure that only unique, confidently mapped reads were utilized. The color space option was used for the SOLiD reads. With these inputs, 33% of ∼110 million C. elegans reads and 10.45% of ∼236 million Arabidopsis reads were reported. Nucleosome midpoints were determined by adding or subtracting 73 bp from the left-most or right-most coordinate of the forward and reverse reads, respectively. For Arabidopsis , nucleosome sequences from the mitochondria and chloroplast chromosomes were not analysed.
In order to examine the DNA sequence context of unmethylated and methylated CpG dinucleotides in Arabidopsis nucleosomes, methylated and unmethylated nucleosome sub-libraries were produced by overlapping cytosine methylation levels with nucleosome coordinates. A text file containing the methylation level of each cytosine in Arabidopsis aerial tissues, which was derived from a BS-seq experiment ( 28 ), was provided by Matteo Pellegrini, and the coordinates were converted to match the tair9 assembly. In the methylated nucleosome sub-library, only nucleosomes with at least one symmetrically methylated CpG with a methylation level >80% were utilized. In the unmethylated nucleosome sub-library, only nucleosomes with 0% methylation levels were utilized. The resulting unmethylated and methylated nucleosome sub-libraries contained ∼9 and 8 million reads, respectively. Unmethylated CpG dinucleotides (methylation levels <80%) within the methylated nucleosome sub-library were not counted as methylated CpGs in frequency profiles. Unmethylated CpG dinucleotides within the methylated nucleosome sub-library displayed an outward-facing periodicity in contrast to the methylated CpG dinucleotides (data not shown).
RESULTS
Preparation of the nucleosome and control libraries
DNA from the human chromosomal loci used in this study was provided in the form of 3 BAC clones that contained 10 CpGIs and 12 genes ( Supplementary Figure S1 ) ( 29 , 30 ). The BAC from chromosome 4 contains 3 genes from the serum albumin family, the BAC from chromosome 8 contains 2 CpGIs and the MYC gene, and the BAC from chromosome 17 contains 8 CpGIs and 8 genes including the tumor suppressor TP53. Mouse BAC clones corresponding to these human sequences were also examined ( Supplementary Figure S2 ) ( 29 , 30 ). These loci were chosen because their epigenetic regulations have been extensively studied in normal and cancer cells ( 31–33 ).
To investigate the effects of DNA methylation on nucleosome positioning at these loci, the strategy entailed methylating all CpGs in an equal molar mixture of the BAC DNAs using CpG methyltransferase. Nucleosome reconstitution was then carried out for methylated and unmethylated DNA by gradient dialysis (from high salt to low salt) in moderate DNA excess, using chicken erythrocyte core histones. These samples were digested with MNase, and protected mononucleosome-length DNA was isolated. For two controls, naked DNA was sonicated or digested with MNase prior to size selection to ∼150 bp. The unmethylated/methylated nucleosome and control samples were simultaneously sequenced with the SOLiD paired-end technology (see Materials and Methods section). Insert length distributions of properly paired reads for the human nucleosome libraries display strong peaks at 147 and 149 bp, which are consistent with nucleosome core fragment sizes, whereas the control libraries do not ( Supplementary Figure S4A ). Additionally, normalized read density functions indicate that the sonicated library is less variable than the nucleosome and MNase control libraries ( Supplementary Figure S4B ). The average numbers of high quality, properly paired reads for the human unmethylated and methylated libraries corresponded to 195X and 225X coverages by 147 bp nucleosome footprints, respectively. This relatively high coverage in limited sequence space permitted an accurate assessment of nucleosome midpoint positions.
Translational positioning versus nucleosome occupancy
Before studying differences between the unmethylated and methylated nucleosome libraries, we sought to distinguish the nucleosome libraries from the sonicated and MNase controls and to assess the resolution of nucleosome positioning attained in this study. We first characterized the libraries by comparing maps among the unmethylated/methylated nucleosome and control libraries for both the human and mouse data in a range of low to high resolutions. These analyses revealed that the positioning of nucleosomes in this study regardless of methylation status was highly reproducible and that translational positions of nucleosomes at midpoints could be identified at +/− 1 bp resolution ( Figures 1 A and B). A common low resolution method for comparing nucleosome maps, which has been debated ( 23 , 34–38 ), is plotting the normalized nucleosome occupancies at each position of one library against another and determining the Pearson’s correlation coefficient ( r ). Normalized nucleosome occupancy is typically calculated by taking the log ratio of the number of raw 147 bp reads covering a certain position over the average number of 147 bp reads that occupy each bp. Alternatively, for a higher resolution comparison, one can instead compare the log ratios of the number of raw reads at midpoints over the average number of reads at midpoints per bp at each position.
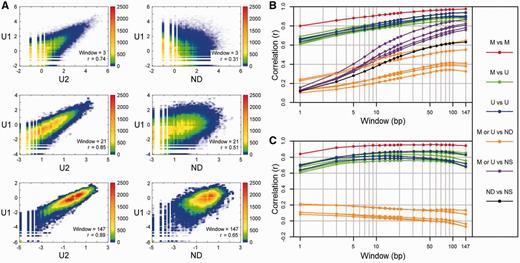
Low to high resolution comparisons among the human nucleosome and control libraries. ( A ) 2D color-coded scatter plot comparisons between two unmethylated nucleosome libraries ( U 1 versus U 2) and between one unmethylated nucleosome library and the naked MNase-digested DNA library ( U 1 versus ND). For each comparison at high, medium and low resolutions using windows of 3, 21 and 147 bp, respectively, the numbers of normalized reads in log ratios at each position were plotted, and the colors over the scatter plot represent the numbers of positions that are plotted within small square regions of the plot. The log ratio at each position is equal to log( x + c) − log( y + c) where ‘ x ’ is the number of reads of a given window length (symmetrically extended from midpoints) overlapping a certain position, ‘ y ’ is the average number of reads of a given window length in the library overlapping each position and ‘c’ is a small constant to avoid undefined values associated with ‘zero’ data. Therefore, a log ratio of 0 indicates that the number of reads of a given window length overlapping a certain position is equal to the average number of reads in the library for the given window. Pearson’s correlation coefficients ( r ) are indicated. ( B ) Correlations ( r ) as a function of window width for the 21 possible individual library comparisons. For different window widths, r- values derived from comparisons as in (A) between the methylated nucleosome libraries ( M , red), between the unmethylated nucleosome libraries ( U , blue), between the unmethylated and methylated nucleosome libraries (green), between the nucleosome libraries and the naked MNase-digested DNA library (ND, orange), between the nucleosome libraries and the naked sonicated DNA library (NS, purple), and between the two controls (black) are plotted. ( C ) Correlations ( r ) as a function of window width after removing the sonicated data as background. Same as in (B) except comparisons between libraries were made after the sonicated data were subtracted from the nucleosome and MNase control libraries as background ( Supplementary Methods ).
In our comparisons, for window widths of 1–147, which correspond to high to low resolutions, the occupancy of a read was gradually extended symmetrically from the midpoint depending on the size of the window width. For each window width, r -values were then determined for log ratio comparisons between individual libraries at each position ( Figures 1 A and B, Supplementary Figure S5 ). At high resolution (window width = 3), pair-wise comparisons among the human nucleosome libraries yielded high correlations (∼0.7 < r < ∼0.9) whereas comparisons between the nucleosome libraries and the control libraries did not (∼0.1 < r < ∼0.3). However, at low resolution (window width = 147), the MNase and sonicated control libraries were more correlated with the nucleosome libraries with approximate r- value ranges of 0.3–0.65 and 0.75–0.85, respectively ( Figures 1 A and B). Similar results were obtained with the mouse data ( Supplementary Figure S5 ).
The similarities between the nucleosome and control libraries at larger window widths are most likely due to underlying sequence biases in the SOLiD technology and/or amplification biases before sequencing as evidenced by the lower than expected read frequencies in regions of extreme base composition within the sonicated library ( Supplementary Figure S6 ) ( 37 ). At lower resolutions, the lower correlations observed between the nucleosome libraries and the MNase control library as compared to those with the sonicated control library are likely due to hot spots of MNase-specificity that do not correspond to nucleosome boundaries. The results in Supplementary Figure S4B support this view since preferred sites of MNase specificity were detected in the naked MNase-treated DNA as compared to the library prepared by sonication. We then re-evaluated the correlations from the human data by subtracting the sonicated data as background from the nucleosome and MNase control libraries ( Supplementary Methods ). The results showed that the MNase control library was no longer correlated with the nucleosome libraries at low resolution and that correlations among the nucleosome libraries remained high for all window widths ( Figure 1 C).
A hallmark of positioned nucleosomes is the ∼10 bp periodicity of certain dinucleotides, and it was suggested long ago that this arrangement facilitates the winding of DNA around the histone octamer ( 39 , 40 ). Our recent studies that used a combination of experimental and bioinformatic approaches demonstrated that essentially all nucleosome dinucleotide periodicities in genome-wide libraries could be described in terms of eight tetranucleotide consensus sequences, which were proposed to be important for establishing both the rotational orientation of the DNA relative to the histone surface and the preferred formation of nucleosomes at specific sites along DNA in vitro ( 41 ). In order to provide further evidence that the high-read positions identified in the unmethylated and methylated nucleosome libraries in the present study correspond to authentic nucleosome positions, we compared the frequency profiles of the eight tetranucleotide consensus sequences in the nucleosome libraries with the sonicated and MNase control libraries ( Supplementary Figures S7 and Supplementary Data ), and comparisons with two of these tetranucleotide consensus sequences, AnTm and RGCY, are displayed in Figure 2 .
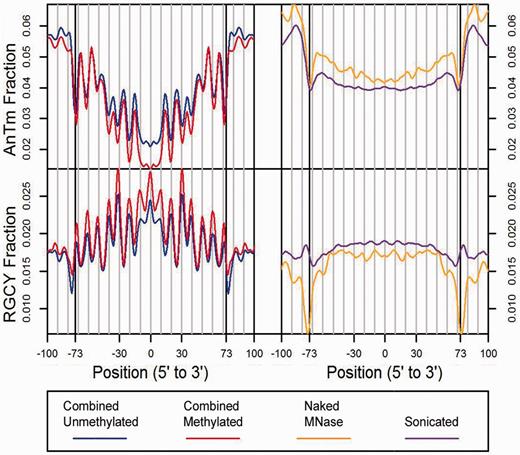
Frequency profiles of the AnTm and RGCY tetranucleotide consensus sequences in the nucleosome and control libraries for the human data. The tetranucleotide fractions of occurrence for AnTm ( n + m = 4, no TA steps) and RGCY were generated from forward and reverse complement sequences centered on midpoints for the combined unmethylated nucleosome library (blue), the combined methylated nucleosome library (red), the naked MNase-digested DNA library (orange), and the naked sonicated DNA library (purple).
The results show that the characteristic profiles of these tetranucleotides displayed by the nucleosome libraries are strikingly similar to the tetranucleotide consensus sequence profiles previously identified in whole genome libraries from yeast and C. elegans ( 41 ). These similarities included identities in the rotational orientation of each consensus sequence as well as relative occurrences at certain positions in intranucleosome regions. In contrast, no discernable patterns in tetranucleotide occurrences were seen in the sonicated and MNase control libraries ( Figure 2 , Supplementary Figures S7 and Supplementary Data ). In agreement with previous sequence analyses of reconstituted nucleosomes in yeast ( 41 ), the vast majority of the dinucleotide 10.2 bp periodic signal in the present study can be attributed to the eight tetranucleotide consensus sequences ( Supplementary Figure S9 ).
Differences between the unmethylated and methylated nucleosome libraries
The numbers of normalized reads at nucleosome midpoints in the unmethylated and methylated libraries were compared in order to identify high-affinity nucleosome sequences that are dependent upon methylation. Examples of methylation-sensitive (MS) and methylation-insensitive (MI) nucleosomes are present in a 1000 bp segment of the human TP53 gene ( Figure 3 A). This region encodes a portion of the DNA-binding domain of the p53 protein and is considered to be the single most significant mutational target in human cancer ( 42 ). The plot shows two strongly positioned nucleosomes. One of these nucleosomes is a MI nucleosome that overlaps the 7th exon of TP53, and the other is a MS nucleosome that occupies the 8th exon. Over 90% of the cytosines in the CpGs in both exons are methylated in human fibroblasts, which is similar to the essentially fully methylated status of most of the p53 gene body in adult human tissues ( 43 ).
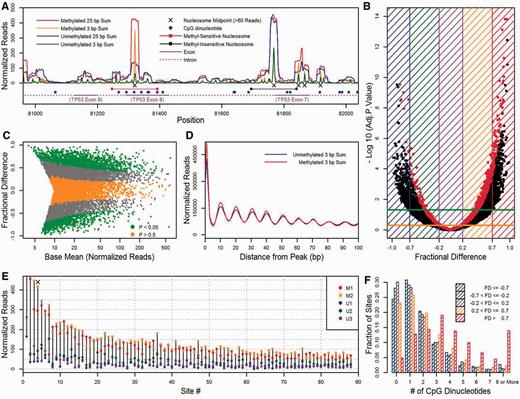
Differential nucleosome positioning between the unmethylated and methylated conditions for the human data. ( A ) An example from the data. One strongly positioned, methylation-sensitive (MS) nucleosome identified by DESeq overlaps the 8th exon in the TP53 gene while another strongly positioned but methylation-insensitive (MI) nucleosome occupies part of the 7th exon. The numbers of normalized reads from nucleosomes at midpoints in 3 and 25 bp sliding window sums are plotted as a function of position for the combined unmethylated (green and blue) and methylated (orange and red) libraries. The positions reflect BAC coordinates. ( B , C ) Differential nucleosome affinity analysis by DESeq. In (B), the negative log (base 10) of the adjusted P -values that resulted from tests between the 3 unmethylated and 2 methylated libraries for 11 448 positions are plotted against fractional difference (FD). The green and orange horizontal lines represent adjusted P -values of 0.05 and 0.5, respectively. Nucleosomes in red have >60 normalized reads in one of the combined unmethylated or methylated libraries. In (C), FD is plotted against the base mean of normalized reads for the five libraries. Nucleosomes in green and orange have adjusted P -values <0.05 and >0.5, respectively. ( D ) Position cluster analysis. For all peaks at the 11 448 nucleosome midpoint positions, the numbers of normalized reads at midpoints in 3 bp sums for the combined unmethylated and methylated nucleosome libraries were cumulatively added according to the distance at which they occurred. Note that since the data are in 3 bp sums, the highest peak occurs at position 1 rather than position 0. ( E ) Eighty-eight MS sites sorted by affinity. The number of normalized reads from each nucleosome library is plotted where the FD is >0.7 and the number of normalized reads in the combined methylated library is >60. The ‘X’ above Site #4 represents the MS nucleosome in the 8th exon of TP53 ( Figure 1 A). ( F ) CpG frequency analysis. For five FD ranges indicated by the key, the fraction of sites that contain the indicated number of CpGs is plotted.
In order to analyse differential nucleosome positioning (or affinity) between the unmethylated and methylated states, 11 448 nucleosome midpoint positions were generated by non-specific filtering (10 read threshold) and a custom peak-finding algorithm with the human data (see Materials and Methods section). To evaluate differences, the statistical software package DESeq was utilized ( 22 ), and the numbers of reads from the three unmethylated and the two methylated biological replicates at the 11 448 nucleosome midpoint positions were used as the count dataset input into DESeq (see Materials and Methods section). To visualize the fit of DESeq’s model, a volcano plot ( Figure 3 B) and a difference plot ( Figure 3 C) are presented. A positive FD represents a methylated over unmethylated ( M > U ) nucleosome. Using an adjusted P -value cut-off of 0.05, DESeq identified 1723 M > U and 877 U > M nucleosomes, which represent ∼15.0% and ∼7.6% of the 11 448 nucleosomes, respectively. We refer to these nucleosomes with adjusted P -values < 0.05 as M > U and U > M nucleosomes whereas 3600 nucleosomes with adjusted P -values > 0.5 are designated as U = M . It should be noted that many of these 11 448 nucleosomes, which are represented as peaks at midpoints, occur in overlapping 147 bp frames or position clusters ( Figure 3 A). The occurrence of nucleosome position clusters observed in high-throughput sequencing data represent the phenomenon where the positions of nucleosomes along DNA at certain loci differ among individual copies of reconstituted DNA in vitro or among individual cells of the same population in vivo ( 44 ). Quantification of nucleosome spacing at midpoints around the 11 448 peaks demonstrate that in position clusters, dominant peaks are typically surrounded by minor peaks in 10 bp intervals ( Figure 3 D).
Within the >0.7 FD range, 88 nucleosomes possessed >60 normalized reads in the combined methylated library. This read threshold represents the top 10% highest peaks for the 11 448 positions. For these 88 sites, a dot plot is presented to display the reproducibility between the 2 methylated libraries and between the 3 unmethylated libraries ( Figure 3 E) where an ‘X’ at site #4 represents the M > U nucleosome in the 8th exon of TP53 ( Figure 3 A). Only 10 nucleosomes with a FD < −0.7 possessed >60 normalized reads where the unmethylated peaks exceeded the heights of the methylated peaks, and there was more variability in read frequencies in this sequence set (data not shown) as compared to the M > U nucleosomes in Figure 3 E. An additional feature observed in the Figures 3 A and E and implied from the correlations in Figure 1 is the coincidence of peaks locations in the libraries regardless of methylation status. Over 80% of the nucleosomes in the unmethylated libraries at the midpoint locations in Figure 3 E had >10 normalized reads. These results suggest that, for the most part, methylation increases the affinity of the histone octamer for DNA in nucleosomes that are already positioned by nucleotide sequence.
CpG content and rotational orientation
As a first step in elucidating the sequence features responsible for methylation sensitivity, we analysed CpG frequency in different FD ranges ( Figure 3 F). For 514 nucleosomes in the >0.7 FD range, which all possessed adjusted P -values < 0.05, the mean frequency of CpG was 4.2 per nucleosome, and 95% of these nucleosomes had at least 1 CpG. For the other FD ranges, the mean frequency of CpGs was 1.8 per nucleosome, and ∼25% of those sites had 0 CpGs. The average numbers of CpGs in the human genome and in the reference BAC sequences are ∼1.3 and 1.8 CpGs per 147 bp, respectively. Similar enrichment of CpG was detected for the mouse data but was not when the analysis was carried out with naked methylated and unmethylated MNase-digested DNA ( Supplementary Figure S10 ). Furthermore, CpG enrichment in the >0.7 FD range for the human data was also observed despite subtracting the MNase or sonicated controls as background from the combined unmethylated and methylated nucleosome libraries ( Supplementary Figure S11 ). These results show that the M > U nucleosomes are enriched in CpG dinucleotides and point to the importance of the density of this sequence motif in MS nucleosome positioning. The 100 bp of DNA flanking these M > U MS nucleosomes was also enriched in CpGs, but this enrichment was less than the CpG enrichment in the nucleosome core DNA (data not shown). In addition to high frequency CpG, the results in Figure 3 F indicate that other factors are required for conferring methylation sensitivity since ∼30% of the sites in the <0.7 FD ranges have 3 or more CpGs per nucleosome.
Genome-wide studies have revealed that the minor grooves of unmethylated CpG dinucleotides in yeast ( 23 ), C. elegans ( 24 ), and Arabidopsis thaliana ( 25 ) tend to face outwards away from the histone surface, which are indicated by peaks in frequency profiles of CpGs located near positions 0, ±10, ±20, ±30, ±40, ±50 and ±60 relative to the dyad. However, in the M > U nucleosomes, the minor grooves of CpGs face inwards (out of phase by 5 bp) as opposed to facing outwards ( Figure 4 A, red). This unique CpG nucleosomal DNA sequence pattern was previously identified for mCpGs in Arabidopsis nucleosomes in vivo ( 25 ). Although the CpGs face outwards in the U > M nucleosomes ( Figure 4 A, blue), no rotational orientation preference was observed for the U = M nucleosomes ( Supplementary Figure S12 ).
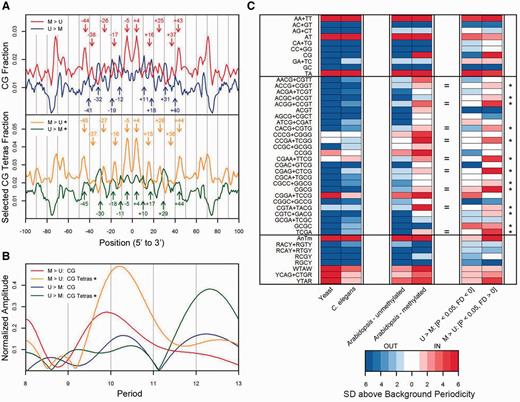
Periodicities and rotational orientations of dinucleotides and tetranucleotides in unmethylated and methylated nucleosomes. ( A ) Occurrences of CpG and selected CpG-tetranucleotides in methylation-sensitive nucleosomes. The CpG fractional occurrences along nucleosomal DNA from the unmethylated over methylated ( U > M ) nucleosomes (blue, P -value < 0.05, FD < 0) and methylated over unmethylated ( M > U ) nucleosomes (red, P -value < 0.05, FD > 0) are plotted. The frequency profiles of CpG from the U > M nucleosomes exhibit an outward-facing minor groove periodicity whereas the M > U nucleosomes face inward. The selected CpG tetranucleotides are indicated by the asterices, which designate 13 CpG tetranucleotides that face inward in the M > U nucleosomes ( Figure 4 C), and their occurrences along nucleosomal DNA from the U > M nucleosomes (green) and the M > U nucleosomes (orange) are plotted. ( B ) Fourier transform spectra from frequency profiles in Figure 4 A (using corresponding colors). The normalized amplitudes ( Supplementary Methods ) versus period are graphed for the U > M and M > U CpG and selected CpG tetranucleotide profiles. ( C ) Rotational orientation strengths of dinucleotides, CpG tetranucleotides and the eight tetranucleotide consensus sequences. The strengths of the outward (blue) and inward (red) periodicities are indicated in the level plot for the six libraries ( Supplementary Methods ). The nine equal signs next to the CpG tetranucleotides designate those that possess inward-facing periodicities in both the methylated Arabidopsis nucleosomes and the M > U nucleosomes. The prevalence of whites and pale reds/blues for the tetranucleotides in our study likely reflects the limited sequence space ( Figure 4 C).
In order to characterize the sequence context of the CpG dinucleotides, we examined the rotational orientations of all unique CpG-containing tetranucleotides in M > U and U > M nucleosomes ( Figure 4 ). The results demonstrated that 13 of the 26 CpG tetranucleotides in the M > U nucleosomes had inward-facing minor grooves whereas only 4 were outward-facing. For these 13 tetranucleotides, the combined frequency profiles for M > U nucleosomes show a stronger inward-facing ∼10 bp periodicity as compared to the CpG M > U profile ( Figure 4 A), which is indicated by the corresponding Fourier transform spectra ( Figure 4 B). No rotational orientation preference is observed for these 13 CpG tetranucleotides in U > M nucleosomes ( Figures 4 A and B). These data are compared to the rotational orientations of dinucleotides and tetranucleotides from yeast and C. elegans , which lack significant CpG methylation, and to methylated and unmethylated nucleosomes from Arabidopsis ( Figure 4 C). The minor grooves of nearly all CpG tetranucleotides that exhibit strong periodicities from the libraries deficient in methylation face outward. Of the 15 CpG tetranucleotides that had inward-facing minor groves in the methylated Arabidopsis nucleosomes, 9 were shared with M > U nucleosomes ( Figure 4 C). The eight tetranucleotide consensus sequences, which have been proposed to be important for establishing both rotational orientation and preferred nucleosome formation at specific sites along DNA, had the same rotational orientations (with the exception of RCGY) in all six libraries ( 41 ).
Exons, introns and CpG islands
The G + C content and levels of CpGs in exons, introns and CpGIs in the human DNA used in our studies are given in Supplementary Table S3 . Also shown in the table are the % methylation levels of these CpGs in peripheral blood mononuclear cells ( 26 ). The levels of CpGs are, on average, ∼2-fold greater in exons as compared to introns while ∼65% of the CpGs are methylated outside of CpGIs in vivo in both sequence groups. The CpGIs displayed features characteristic of these sequences as a group including high CpG and G + C content with low levels of methylation (∼4%). In order to see if there was a relationship between these parameters and nucleosome residency, we determined the relative distributions of the nucleosome types in exons, introns and CpGIs.
There was a 2–3-fold enrichment in M > U nucleosomes in exons as compared to introns whereas U > M and U = M nucleosomes were not enriched in exon sequences ( Figure 5 A). The CpGIs in the U > M and U = M sub-libraries appear deficient in positioned nucleosomes in agreement with previous genome-wide studies ( 45 , 46 ). However, the high G + C content in some CpGIs resulted in a paucity of coverage in these regions due to biased base composition as evidenced by the lower than expected read frequencies in the sonicated library ( Supplementary Figures S6 and Supplementary Data ). It is likely that unmethylated CpGIs are indeed refractory to nucleosome formation since in vitro studies demonstrated that CpGI fragments displayed very low nucleosome forming activity ( 47 ). However, our data and corresponding data with mouse sequences ( Figure 5 A, Supplementary Figures S13 and Supplementary Data ) show that the nucleosomes are preferentially associated with methylated CpGIs, which suggest that the inability of CpGIs to be assembled into nucleosomes can be reversed by DNA methylation.
![Nucleosome positioning of MI and MS nucleosomes for the human data. ( A ) Nucleosome position enrichment within features. For the U > M [ P < 0.05, FD < 0], U = M [ P > 0.5], M > U [ P < 0.05, FD > 0], and M > U [FD > 0.7] nucleosome sub-libraries, there were 877, 3600, 1723 and 514 nucleosomes, respectively. With these nucleosome numbers and the numbers of positions that certain features occupied within the reference sequence, ratios of actual over expected numbers of nucleosome occurrence at midpoints were calculated within features. ( B ) Nucleosome positioning near TSSs. Strongly positioned MS and MI nucleosomes with high affinity and translational positioning activity are displayed near the TSSs of the 12 genes ( Supplementary Figure S1 ) within the reference sequence. Nucleosomes with small numbers of reads and/or low translational positioning activity are not displayed ( Supplementary Methods ). The numbers above nucleosomes are adjusted P -values obtained from DESeq.](https://oup.silverchair-cdn.com/oup/backfile/Content_public/Journal/nar/41/5/10.1093_nar_gks893/2/m_gks893f5p.jpeg?Expires=1750743624&Signature=UoT0Mw~U1zkIsfgFz0uCo4tP~JoLmlf6porVO7x04PugjtvPU4Bs6cGsGB3-Y6vQrnDYWMMrhFMIlzwwujpkTa5WGCcU51RUlh-5QULMJpM7NQb--ei2WNeiwMkgTkyQ-nqkqBEQepeH68m0WyrXFGdRFGpdUBm-Wd-aa-DRLuE6U0turo8Xpnaw5lukedfnRa6vAY30DxxNOvuJzAjOEy8piFYvzPVz0jKO9tyHYa4I1Nlkxa8jb809RYjJ2XRy4dXyuomX~si9FGDZiOsEPiugipD9St1hRn-7gPWAde2Vr-gN1vT5qCAyh25ZS1lP6ge1WY-Ov5M6EFQk7MnYjg__&Key-Pair-Id=APKAIE5G5CRDK6RD3PGA)
Nucleosome positioning of MI and MS nucleosomes for the human data. ( A ) Nucleosome position enrichment within features. For the U > M [ P < 0.05, FD < 0], U = M [ P > 0.5], M > U [ P < 0.05, FD > 0], and M > U [FD > 0.7] nucleosome sub-libraries, there were 877, 3600, 1723 and 514 nucleosomes, respectively. With these nucleosome numbers and the numbers of positions that certain features occupied within the reference sequence, ratios of actual over expected numbers of nucleosome occurrence at midpoints were calculated within features. ( B ) Nucleosome positioning near TSSs. Strongly positioned MS and MI nucleosomes with high affinity and translational positioning activity are displayed near the TSSs of the 12 genes ( Supplementary Figure S1 ) within the reference sequence. Nucleosomes with small numbers of reads and/or low translational positioning activity are not displayed ( Supplementary Methods ). The numbers above nucleosomes are adjusted P -values obtained from DESeq.
Isochores are large DNA segments that are characterized by marked consistency in base composition. G + C-rich isochores are generally enriched in housekeeping genes and deficient in developmentally regulated genes whereas the reverse is true for G + C-poor isochores ( 48 ). The human chromosomal loci within the three BACs analysed in the present studies are found within three distinct isochores. The albumin gene family resides within a G + C-poor isochore (37.6% G + C) whereas the MYC (44.1% G + C) and TP53 (50.4% G + C) genes are located in G + C-rich isochores. The base compositions of the human DNA in each of the BACs used in our studies are within 1% of these values. The relative numbers of MI nucleosomes are approximately the same in each BAC. In contrast, significant M > U nucleosome enrichment was observed in the TP53 BAC whereas the albumin BAC was depleted, and this variation was correlated with CpG content ( Figure 6 A, Supplementary Table S4 ).
![Nucleosome enrichment of MS nucleosomes for the human data. ( A ) Nucleosome enrichment within BACs. For this analysis, the MS nucleosomes were from the M > U [ P < 0.05, FD > 0] nucleosome sub-library, containing 1723 nucleosomes, and the remaining 9725 (11 448 − 1723) nucleosomes were defined as being MI. With these nucleosome numbers and the numbers of positions that the BACs occupied within the reference sequence, ratios of actual over expected numbers of nucleosome occurrence at midpoints were calculated. CG and G + C (-CG) enrichment was calculated with respect to the CG and G + C (-CG) content for the entire reference sequence or the three BACs combined. ( B ) Nucleosome enrichment within exons of individual genes. For the 12 genes, the numbers of MI and MS nucleosomes were computed in exons. With these nucleosome numbers and the numbers of positions that the exons of certain genes occupied within the reference sequence, ratios of actual over expected numbers of nucleosome midpoint occurrence were calculated. Again, CG and G + C (-CG) enrichment was calculated with respect to the CG and G + C (-CG) content for the entire reference sequence. ( C ) Nucleosome exon-over-intron enrichment for individual genes. For the 12 genes, the numbers of MI and MS nucleosomes were computed in exons and introns. With these nucleosome numbers and the numbers of positions that the exons and introns of certain genes occupied, ratios of nucleosomes per exon length over nucleosomes per intron length were calculated. CG and G + C (-CG) exon-over-intron enrichment was calculated for each individual gene.](https://oup.silverchair-cdn.com/oup/backfile/Content_public/Journal/nar/41/5/10.1093_nar_gks893/2/m_gks893f6p.jpeg?Expires=1750743624&Signature=LiWjzGa2kQHGImROfeYL~Yb40zyY7cbIjPAviMgyxTPXopT2Kqy4ZOQt1XqxvtSt5ZWKg03SI~K3ZCXklBh4LyLzp16kJAugaR~uVDL2bSTxwxmOhHRQ61pVEHH5D09-s~FzndjFMuglKXNKk8pSaozXreMYMALGBt9uTjH1qlmh0r6OV3fPti~qTi6gLr9mLUbO~QiZLJXNj0JS9CQbh2NocXeHmUcxnNx6LSW65sQSwUvrMS1qOlYGPGqo7ZBRrGRbnrW1d8P3UNsHEOvv9X7L~F3Udn6bJNqZjBB5AVA1nBcc7xfjrrTjDtY2SKD5~stdbL~Trh9yZyZg4BpITg__&Key-Pair-Id=APKAIE5G5CRDK6RD3PGA)
Nucleosome enrichment of MS nucleosomes for the human data. ( A ) Nucleosome enrichment within BACs. For this analysis, the MS nucleosomes were from the M > U [ P < 0.05, FD > 0] nucleosome sub-library, containing 1723 nucleosomes, and the remaining 9725 (11 448 − 1723) nucleosomes were defined as being MI. With these nucleosome numbers and the numbers of positions that the BACs occupied within the reference sequence, ratios of actual over expected numbers of nucleosome occurrence at midpoints were calculated. CG and G + C (-CG) enrichment was calculated with respect to the CG and G + C (-CG) content for the entire reference sequence or the three BACs combined. ( B ) Nucleosome enrichment within exons of individual genes. For the 12 genes, the numbers of MI and MS nucleosomes were computed in exons. With these nucleosome numbers and the numbers of positions that the exons of certain genes occupied within the reference sequence, ratios of actual over expected numbers of nucleosome midpoint occurrence were calculated. Again, CG and G + C (-CG) enrichment was calculated with respect to the CG and G + C (-CG) content for the entire reference sequence. ( C ) Nucleosome exon-over-intron enrichment for individual genes. For the 12 genes, the numbers of MI and MS nucleosomes were computed in exons and introns. With these nucleosome numbers and the numbers of positions that the exons and introns of certain genes occupied, ratios of nucleosomes per exon length over nucleosomes per intron length were calculated. CG and G + C (-CG) exon-over-intron enrichment was calculated for each individual gene.
These variations extend to ±500 bp regions surrounding TSSs of the 12 genes in the 3 human BACs as shown in Figure 5 B where only nucleosomes with high affinity and translational positioning activity are displayed ( Supplementary Methods ). The three sequences from the albumin family lack M > U nucleosomes while eight of nine segments from the MYC and TP53 BACs contain at least one M > U nucleosome, and five of these eight segments contain more than one M > U nucleosome. The same general trends were observed at individual gene levels where the results show that M > U nucleosome enrichment in exons and in exons over introns are correlated with the levels of CpG ( Figures 6 B and C). Figure 6 B shows that the enrichment of M > U nucleosomes in exons within the 12 genes are correlated with CpG content ( r = 0.76) and less so with G + C (-CpG) content ( r = 0.50) while MI nucleosomes are not correlated with CpG nor G + C (-CpG) content ( r = 0.25 and 0.27, respectively). As shown in Figure 6 C, exon-over-intron enrichment is observed for the M > U nucleosomes (  = 1.99 ± 0.18) and for CpG content (
  = 1.87 ± 0.20) but not for MI nucleosomes (
  = 1.16 ± 0.10) and less so for G + C (-CpG) content (
  = 1.07 ± 0.03). With this data, a P -value of 7 × 10 −4 results from a two-tailed t -test, comparing exon-over-intron enrichment for the 12 genes between M > U and MI nucleosomes.
DISCUSSION
A common approach for the study of nucleosome distributions from high-throughput sequencing data entails the quantification of nucleosome occupancy, which gives the histone density at each bp position using a sliding window width of 147 bp. Measurement of nucleosome occupancy has led to the suggestion that G + C-richness is responsible for high histone density, and that the histone octamer prefers GC-rich sequences ( 49 ). However, naturally occurring nucleosome positioning sequences as well as sequences that have been selected for high histone octamer affinity from genomic and synthetic sequence pools are not necessarily rich in G + C bp ( 50–52 ). Recent studies have also shown that naked DNA digested by MNase is highly correlated with nucleosome occupancy data leading to the suggestion that the similarities arise because of the known AT-sequence specificity of this enzyme in naked DNA and/or to base compositional biases that are characteristic of deep sequencing methods ( 38 , 53 ). However, at high resolution, our nucleosome data were not correlated with the MNase controls ( Figure 1 , Supplementary Figure S5 ), and other high resolution analyses comparing MNase-generated nucleosome positions with those prepared by caspase-activated DNase ( 54 ) and by chemical cleavage ( 55 ) provide even stronger evidence that ‘MNase does not substantially bias nucleosome mapping.’
An alternative approach for accessing nucleosome residency involves the localization of nucleosomes at precise translational positions. Estimation of nucleosome positions at midpoints has been successfully applied to resolve global patterns such as nucleosome phasing near transcription start sites ( 56 , 57 ). Midpoint analysis has also been used to reveal unique nucleosome spacing, which has been found to vary within differentially expressed genes, specific epigenetic domains and different species ( 58 , 59 ). However, due to relatively low coverages, the use of nucleosome occupancy is often required when presenting nucleosome data from large eukaryotic genomes at individual loci, especially when single-end sequencing data is used. On the other hand, high resolution nucleosome maps can more easily be achieved in small genomes, and well-defined position clusters have been reported with paired-end sequence data from nucleosomes in yeast ( 44 ).
In the present study, the high coverage obtained with 572 KB of DNA from 3 BAC clones, which represent ∼0.02% of the human genome, and the use of paired-end sequencing enabled us to identify positioned nucleosomes at specific sites along the DNA, which, in turn, allowed us to detect MS nucleosomes. Through non-specific filtering and a custom peak-finding algorithm, 11 448 positions at nucleosome midpoints were generated, and position cluster analysis around these positions revealed that dominant nucleosome positions were characteristically surrounded by minor ones rotationally positioned at distances in multiples of 10 bp ( Figure 3 D). Although G + C content in the human nucleosome libraries was 3–5% and 1–3% higher than the G + C content in the reference sequence and sonicated control library, respectively, the numbers of reads in the combined methylated and unmethylated libraries at the 11 448 positions were not correlated with G + C content ( r = 0.14 and −0.06, respectively) nor were they related to the specificity of MNase for naked DNA sites ( Figures 1 and 2 ).
Rather, it is likely that the translational positioning and rotational orientations of these sequences are more associated with the ∼10 bp periodic arrangements of the eight tetranucleotide consensus sequences ( Supplementary Figures S7–S9 ). The rules for development of these consensus sequences were derived from whole genome in vitro and in vivo studies from yeast and C. elegans ( 41 ). The observation that these same sequence patterns are found in the human and mouse nucleosome libraries extends the importance of these sequence motifs to mammals. Although the DNA sequence specificity of nucleosome reconstitution reactions in vitro can be influenced by the ratio of DNA to histones ( 60 ), the similarities in the sequence profiles reported in Supplementary Figures S7 and Supplementary Data to those seen in vivo ( 41 ) where the DNA is not in excess implies that the in vitro reconstitution procedure used in this report captures sequence-dependent features for nucleosome positioning that are operable in the cell. The co-enrichment of mCpG and positioned nucleosomes in exons and CpGIs ( Figures 5 and 6 , Supplementary Figures S13 and Supplementary Data ) are also predicted by in vivo studies ( 1 , 5–9 , 25 ). Additionally, the similarities in the rotational orientation of mCpGs in the in vitro assembled M > U nucleosomes ( Figure 4 ) to that observed in the methylated Arabidopsis in vivo assembled nucleosomes ( 25 ) provide further evidence for the physiological relevance of the studies described in this report.
In our analyses, we focused on the nucleosome positioning sequences that displayed an increased affinity for the histone octamer in response to DNA methylation ( M > U nucleosomes), and this effect seems to be consistent with the well-known effects of DNA methylation on promoting heterochromatin formation and gene silencing. There were several reasons for emphasizing these nucleosomes as compared to the U > M nucleosomes. First, there were twice as many and 9 times as many M > U nucleosomes than U > M nucleosomes that contained >10 reads and >60 reads, respectively ( Figure 3 ). These differences are also reflected in the results given in Figure 5 B, which show that there were 15 M > U nucleosomes but only one U > M nucleosome in the vicinity of transcription start sites. Second, the M > U nucleosomes were enriched in CpGs as compared to the bulk of the nucleosomes whereas the U > M nucleosomes were not ( Figure 3 F). Approximately 5% of the M > U nucleosomes whereas 25% of the U > M nucleosomes lacked CpGs, and the latter value is similar to the bulk of the nucleosomes. The single U > M nucleosome downstream of the TSS of the AFM gene falls within this category while each of the 15 M > U nucleosomes contain multiple CpGs with an average number of 7.2 per sequence ( Figure 5 B). Third, the M > U , unlike the U > M nucleosomes, were also preferentially enriched in exons and CpGIs as compared to the bulk of the nucleosomes ( Figures 5 and 6 , Supplementary Figures S13 and Supplementary Data ). In fact, the only detectable characteristic of the U > M nucleosomes that distinguishes them from the bulk of the nucleosomes is the rotational orientation of the CpGs where their minor grooves tend to face away from the histone octamer ( Figure 4 A). These results raise the question as to the mechanism that is responsible for the origin of the U > M nucleosomes. Perhaps the most straightforward explanation is that the U > M nucleosomes are indirectly produced by DNA methylation. That is, our results show that the histone octamer is preferentially associated with sequences that are rich in CpG in the methylated libraries, and these CpGs assume the unusual rotational orientation with their minor grooves facing toward the octamer when the DNA is packaged into a nucleosome. Since the experiments were performed in moderate DNA excess, this effect should result in fewer octamers associating with CpG poor regions and especially in those regions where the minor grooves of the CpG face away from the histone surface in the nucleosome.
Previous studies have shown that mCpGs are preferentially found in nucleosome core DNA as opposed to internucleosomal sequences ( 25 , 61 ). Our studies have shown that the M > U nucleosomes were enriched in CpG dinucleotides as compared to the remaining positioned nucleosomes in the human and mouse libraries ( Figure 3 F, Supplementary Figure S10 ). The M > U nucleosomes also displayed a unique rotational orientation of CpGs such that their minor grooves tended to face toward the histones in the nucleosome rather than away ( Figure 4 ). This unusual rotational orientation of the CpGs was first identified in Arabidopsis nucleosomes containing methylated DNA, and it was suggested that DNA methyltransferases preferentially target the major groove of CpG dinucleotides in nucleosome-bound DNA ( 25 ). MBD proteins also interact with methylated CpGs in the DNA major groove ( 62 , 63 ). These observations may point to global mechanisms where the methylation of CpGs in the outward-facing grooves of the nucleosome enhance the affinity of the DNA for the histone octamer while these nucleosomal mCpGs also serve as a marker for MBD proteins that in turn recruit co-repressor protein complexes.
Our studies raise the question as to the mechanism by which methylation enhances the affinity of DNA for histones. A plausible mechanism relates to the flexible nature of YR steps, which can bend into the major or minor groove depending on the local environment ( 64 ). Strong bending or kinking of TpA and TpG/CpA dinucleotides into minor grooves at histone docking sites has been inferred from X-ray crystallography ( 65 ) and solution studies ( 17 , 18 ), and this action has been shown to enhance nucleosome stability. The two bulky, hydrophobic methyl groups on adjacent Cs in a CpG dinucleotide should prevent bending into the major groove and thus might favor the narrowing of the minor grove. Compression of the minor groove should promote anisotropic bending or kinking into this groove, thereby increasing nucleosome stability. Although most X-ray diffraction and solution NMR studies have indicated that cytosine methylation has little effect on DNA structure ( 66 , 67 ), it has been reported that CpG flanked by A-T tracts undergoes a severe narrowing of the CpG minor groove upon methylation in the major groove ( 68 ).
Genome-wide studies have revealed that nucleosomes are preferentially associated with exons as compared to introns, and this phenomenon has been implicated in co-transcriptional splicing events ( 25 , 45 , 69 ). CpGIs that characterize promoters for housekeeping genes are generally deficient in tightly bound nucleosomes, and this feature presumably enhances their accessibility to RNA polymerase. Certain CpGIs become occupied by nucleosomes during normal development and during cancer, and these events are likely to be important in the silencing of these loci ( 1 , 5–9 ). These variations have been related to a number of factors including intrinsic DNA sequence preferences, G + C content, and epigenetic events including DNA methylation, histone modifications, chromatin remodelling and promoter occupancy by RNA polymerase ( 4 , 45 , 70–72 ). However, it has been difficult to access which of these factors are primary and which secondary in the establishment of non-random nucleosome distributions in the cell.
The results in our studies show that DNA methylation and in vitro nucleosome assembly can reproduce these variations. The results show that exons are enriched in M > U nucleosomes relative to introns and that this effect is most likely due to the enrichment of CpGs in exon sequences rather than to an increase in exon G + C content per se. The results also suggest that CpGIs are deficient in nucleosomes in the unmethylated state but become nucleosome enriched upon methylation ( Figures 5 and 6 , Supplementary Figures S13 and Supplementary Data ). This observation is consistent with studies that demonstrated that a methylated CpGI promoter, but not the unmethylated counterpart, becomes packaged into nucleosomal arrays following injection into Xenopus oocytes ( 73 ). Similar results using bacterial DNA introduced into a mammalian genome by transfection suggest that methyl cytosines themselves are responsible for producing a close chromatin structure regardless of sequence context ( 7 , 74 ).
ACCESSION NUMBERS
All high-throughput sequencing data have been deposited at GEO ( http://www.ncbi.nlm.nih.gov/geo/ ) under accession number GSE37224.
FUNDING
Purdue Research Foundation Graduate Fellowship (to C.K.C.); the Department of Biological Sciences, a Purdue College of Science Research Grant (to P.J.W.); NIH NLM Grant [5R01LM008626 to P.J.W. PI, J.N.A. CoPI].
Conflict of interest statement . None declared.
ACKNOWLEDGEMENTS
The authors thank Phillip SanMiguel, Paul Parker, Viktoria Krasnyanskya and Rick Westerman at the Purdue Genomics Core Facility for discussions and running the sequencing. We thank Olga Vitek and Xi Tan for discussions regarding data analysis. All authors jointly conceived and designed the experiments; C.K.C. and J.N.A. performed the wet-lab experiments and the analyses. All authors discussed and developed methods of analysis, C.K.C. and J.N.A. wrote the manuscript, and all authors commented on and amended it.

Comments