


Abstract
Linker histones (LHs) bind to the DNA entry/exit points of nucleosomes and demonstrate preference for AT-rich DNA, although the recognized sequence patterns remain unknown. These patterns are expected to be more pronounced in metazoan nucleosomes with abundant LHs, compared to yeast nucleosomes with few LHs. To test this hypothesis, we compared the nucleosome core particle (NCP) sequences from chicken, Drosophila and yeast, extending them by the flanking sequences extracted from the genomes. We found that the known ∼10-bp periodic oscillation of AT-rich elements goes beyond the ends of yeast nucleosomes, but is distorted in metazoan sequences where the ‘out-of-phase’ AT-peaks appear at the NCP ends. The observed difference is likely to be associated with sequence-specific LH binding. We therefore propose a new structural model for LH binding to metazoan nucleosomes, postulating that the highly conserved nonpolar ‘wing’ region of the LH globular domain (tetrapeptide GVGA) recognizes AT-rich fragments through hydrophobic interactions with the thymine methyl groups. These interactions lead to DNA bending at the NCP ends and formation of a ‘stem-like’ structure. The same mechanism accounts for the high affinity of LH to methylated DNA—a feature critical for stabilization of the higher-order structure of chromatin and for repression of transcription.
INTRODUCTION
Linker histones (LHs) are critical for the formation of higher-order chromatin structure (1). According to the current paradigm, the topology of the ‘30 nm’ chromatin fiber and the degree of its compactness is regulated by LH abundance (2,3). At the nucleosomal level, an LH binds to the DNA entry/exit points and protects ∼20 bp of flanking DNA (4). Earlier studies (5,6) showed that LHs exhibit a general preference for AT-rich DNA regions (7). However, it is still unclear whether the nucleosomal ends (or the DNA flanking regions) are distinguished by any sequence patterns associated with the LH binding.
To elucidate such sequence patterns (if they exist), one needs to compare nucleosome positions established at single-nucleotide resolution. Despite recent progress in genome-wide analyses of chromatin organization (8–11), high-resolution data still remain limited. The earliest set of nucleosome core particle (NCP) DNA fragments satisfying the above criteria was derived from chicken erythrocytes in the pioneering work by Satchwell et al. (12). Chicken NCP sequences, extracted in the course of micrococcal nuclease (MNase) cleavage of chromatin, are characterized by a strong ∼10-bp periodicity in the occurrence of the AA:TT dinucleotides along the core DNA. This is consistent with the observation made earlier by Trifonov and Sussman (13), who analyzed genomic sequences and suggested that periodic AA:TT oscillation is critical for the stabilization of nucleosomes. Recently, a very similar pattern was identified in a set of NCP fragments from yeast obtained by Segal et al. (9), also using MNase cleavage. In both cases, AT-rich dimers preferentially occur at the sites of DNA bending into the minor groove, while GC-rich fragments are found at the sites where DNA is bent toward the major groove (9,12). Based on this similarity between chicken and yeast core DNAs, the authors (9) suggested that the structural code governing the rotational nucleosome positioning is essentially the same in the two species.
On the other hand, chicken and yeast chromatins are drastically different at the level beyond the core particle. For example, the nucleosome repeat length in yeast is much shorter than in chicken, ∼165 bp versus ∼205 bp (14). In accord with the general tendency mentioned above, the chromatin compactness is closely related to LH stoichiometry (3): chicken erythrocyte nucleosomes have ∼1.3 linker histone molecules (H1 + H5) on average (15), while in yeast, the H1 analog protein Hho1p is found in one of 4 to ∼40 nucleosomes (16,17). Therefore, it is natural to assume that the two sets of sequences may differ at the sites of LH binding, that is, near the DNA entry/exit points of nucleosomes. In other words, one would expect that the chicken NCP ends would be enriched by certain as-yet-unidentified LH-specific sequences [presumably AT-rich (4–6)], while in yeast these sequences would be much less frequent (or undetectable).
To test this hypothesis, we aligned chicken and yeast NCPs to the corresponding genomes and extracted flanking sequences at both ends. Analyzing the positioning of various AT-rich elements along the ‘extended’ nucleosomal sequences, we found that the chicken and yeast NCP sequences are characterized by different sequence patterns in the terminal regions. In addition, we analyzed two sets of H2A.Z-containing NCP sequences, also obtained at single-nucleotide resolution—one from yeast (10) and the other from Drosophila (11). We found that the Drosophila nucleosomes reveal the same AT-rich pattern as the chicken ones, clearly distinctive from the pattern observed in the yeast nucleosomes (both major-type and H2A.Z). In particular, the known 10–11-bp periodic oscillation goes beyond the end points of the yeast nucleosomes, in contrast to the chicken and Drosophila nucleosomes where ‘out-of-phase’ AT peaks are observed at the ends.
This difference, in our opinion, reflects an inherent difference in the sequence organization of nucleosomes in these species, which, in turn, is related to higher LH abundance in metazoans compared to yeast. Based on these findings, we propose a new structural model of LH binding to nucleosomes, connecting the observed AT-rich patterns in the terminal regions of metazoan nucleosomes with the general preference of LHs for AT-rich DNA. According to the model, binding of linker histones to the AT-rich fragments (driven by hydrophobic interactions in the major groove) facilitates additional DNA bending at the ends of nucleosomes and compaction of the chromatin fiber. The same model also explains preferential LH binding to methylated DNA, which is more pronounced for the H10/H5 histones compared to other members of the H1 family.
METHODS
To extract the genomic sequences flanking chicken (12) and yeast (9) nucleosomes, the NCP sequences were BLASTed (18) against their corresponding genomes (chicken genome Build 1 and yeast genome Build 2.1). All the default settings were used except that the Filter setting was switched from ‘low complexity’ to ‘none’, to avoid filtering out simple repeats such as An:Tn.
Out of the 177 chicken sequences, 174 had one or more hits, while three sequences were not found in the genome. For the multiple-hit sequences, the first hit with the highest Identity score was selected. Next, we sorted out the sequences with the number of matches <135 (which is equivalent to Identity score <93%). Under this restriction, 169 chicken sequences were selected for further analysis.
Out of the 199 yeast sequences, 180 had one or more hits in the genome. The Identity score was 100% for all these sequences except two, which had the score 99%. The remaining 19 sequences were found in the Saccharomyces cerevisiae 2-micron circular plasmid; they were sorted out. Out of these 180 sequences, 13 were aligned to the same location in Chromosome XII; 12 of these 13 were omitted. As a result, 168 (168 = 180 – 12) unique yeast sequences were selected for further analysis.
The ‘selected’ NCP sequences were then extended at both ends by the flanking fragments found in the genomes (Figure 1, Supplementary Tables S1 and S2). There was no additional realignment of the ‘extended’ nucleosomal sequences. That is, we used the ‘default’ center alignment based on the ‘original’ sequences reported by Satchwell et al. (12) and Segal et al. (9).
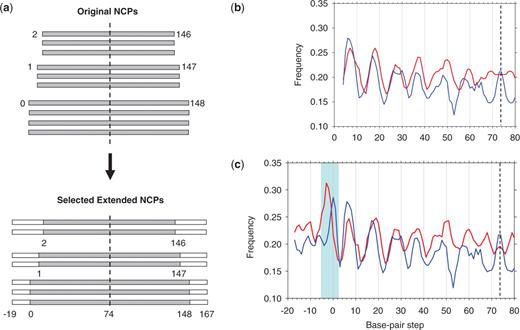
Extension of chicken and yeast nucleosomes with genomic flanking sequences. (a) Scheme for generating ‘selected extended’ sequences from the ‘original’ NCPs. The sequences are represented by rectangles: gray for the ‘original’ NCPs and white for the flanking fragments in genomes. Note that ‘selected’ sequences are less numerous than the ‘original’ NCPs (see ‘Methods’ section). The sequences are center-aligned to the 147-bp core DNA template, such that the dyad is located at position 74. The base-pair positions in the ‘extended’ sequences are numbered −19, −18 … −1, 0, 1, … 147, 148, … 167. (b and c) Frequencies of occurrence of AA:TT dimers versus base-pair step position in the original (b) and selected (c) sets of ‘extended’ nucleosomal sequences. Running 3-point averages of the frequencies are shown in blue (for chicken) and red (for yeast). In (b and c), the ‘dimeric’ numbering scheme is used. That is, the dimer (x, x + 1) is assigned to position x. So, dimeric step positions in the 147-bp core are numbered from 1 to 146 (with the dyad corresponding to base-pair step 73.5). Accordingly, the resulting frequencies are ‘symmetrized’ with respect to the dyad (dashed line).
In addition, we used two sets of H2A.Z-containing nucleosomal sequences, one from yeast (10) and the other from Drosophila (11) (Pugh,F., personal communication). The yeast-H2A.Z set contains 2024 nucleosomes (each 147 bp in length), and has only 10 sequences in common with the yeast-H2A set (9), so these two sets of yeast NCPs were considered independently. For direct comparison with the yeast-H2A.Z sequences, we analyzed 8810 NCP fragments from Drosophila, each 147-bp long (11). As a control set, we used 59 612 Drosophila sequences with the length from 144 to 150 bp (11).
For molecular modeling of the LH-nucleosome complex, we used the high-resolution crystal structures of NCP (19) and histone H5 globular domain, GH5 (20). The DNA linkers (10-bp in length) were built with DNAminiCarlo (21) and CompDNA (22) at the ends of 147-bp fragment co-crystallized with histone octamer (19). At one end of nucleosome, the DNA linker was bent by 20° into the major groove; there was no bend at the other end. The GH5 domain was manually docked to the ‘extended’ nucleosome using DS Visualizer 1.6 (Accelrys). The Helix 3 of GH5 (site I) was placed in the major groove ∼5 bp from the nucleosome dyad in orientation approximately parallel to the sugar-phosphate backbone. Specifically, the angle between the axis of the α-helix and the local DNA axis was made ∼45°, which is intermediate between ∼35° in the protein–DNA complex Zif268 (23) and ∼60° in TRF1/TRF2 (24). There was no steric hindrance between protein and DNA (all distances between the α-helix Cα atoms and the DNA phosphate oxygens exceeded 5 Å). The GH5 domain was then rotated and translated along the Helix 3 axis so that the residues R94 and K97 (site II) would be in the vicinity of DNA backbone (the distances between the arginine guanidinium group (and the lysine ε-amino group) and the DNA phosphate group were ∼4 Å). The docking of the sites I and II placed the GH5 ‘wing’ domain close to the DNA entry/exit point where the linker was bent into the major groove.
RESULTS AND DISCUSSION
Distinctive positioning of AT-rich fragments
The chicken (12) and yeast (9) NCP sequences were mapped to the corresponding genomes as described in ‘Methods’ section (Figure 1a). As shown in Figure 1b and c, periodic oscillations in the frequency of occurrence of the AA:TT dimers observed in the ‘original’ NCPs (9,12) are reproduced in the ‘selected’ sequences; this indicates that the ‘selected’ genomic sequences faithfully represent the ‘original’ NCP sets. On the other hand, there is a significant difference between the ‘extended’ chicken and yeast nucleosomal sequences that was not visible earlier—note the shaded area close to the nucleosome end in Figure 1c.
To elucidate the nuances in positioning of the AT-rich fragments in the ‘extended’ nucleosomes, we analyzed various AT-containing dimers (AA:TT, AA:TT + AT) and trimers (AAA:TTT, AAA:TTT + AAT:ATT). The distributions of these fragments along the NCP sequences are generally consistent with each other. For brevity, only the results for AA:TT and AT dimers (denoted as AT2 below) are described in detail. The AA:TT and AT were combined because they reveal similar structural features—in particular, the DNA fragments containing these dimers (the so-called AnTm runs) have a narrow minor groove and promote DNA curvature in solution (25,26).
Overall, the variation in occurrence of the AT2 dimers follows a well-known sinusoidal pattern, oscillating with ∼10-bp periodicity between positions ∼5 and ∼50 (Figure 2a and b). This is consistent with earlier observations (9,12)—namely, AT-rich dimers are more numerous at the sites where DNA bends into the minor groove (thereby facilitating DNA wrapping around the histone octamer). However, at the ends of this ‘periodic oscillation’ interval, the two sets of sequences behave differently. At the dyad position, chicken nucleosomes have a strong peak in the AT2 occurrence (Figure 2a), while in the yeast nucleosomes this peak is missing (Figure 2b).
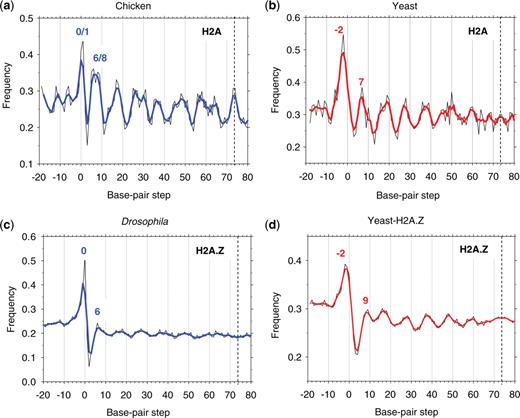
Combined frequency of occurrence of AT2 dimers (AA:TT + AT) versus base-pair step position in ‘extended’ nucleosomal sequences: chicken (a), yeast (b), Drosophila (c) and yeast-H2A.Z (d) (thin black lines). The 3-point averages are shown in thick blue (for chicken and Drosophila) and red lines (for yeast). The resulting frequencies are ‘symmetrized’ with respect to the dyad at base-pair step 73.5 (vertical dashed lines). In Figures 2c and 4c, the data are presented for 147-bp long NCPs from Drosophila (see ‘Methods’ section).
In the terminal region, the ‘extended’ nucleosomal sequences also have distinctive AT2 profiles. For chicken nucleosomes, the AT2 peak is located at positions 0/1, compared to position −2 in yeast sequences (Figure 2). A similar shift of ∼2 bp between the two terminal peaks is observed for the AT3 profiles (Supplementary Figure S1). Importantly, positioning of these peaks is consistent with the sizes of the nucleosomal DNA fragments. The average yeast NCP length, 149 bp, exceeds that for chicken NCP, 145 bp (Figure 3). Thus, we see that the ‘more distal’ positioning of the AT2/AT3 peaks in the yeast nucleosomes correlates with the longer yeast NCP sequences.
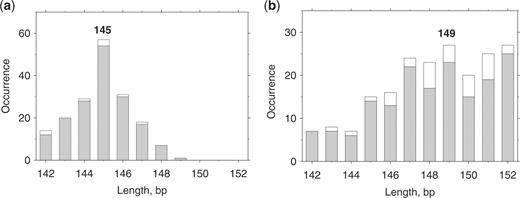
Length distribution of the chicken (a) and yeast (b) NCP sequences. Occurrences versus length are shown for the ‘original’ and ‘selected’ sets of NCP sequences (white and gray bars, respectively). The ‘original’ chicken (12) and yeast (9) sets contained 177 and 199 NCPs respectively. The ‘selected’ sets were chosen as described in ‘Methods’ section; these sets contain 169 chicken and 168 yeast NCP sequences. Note that the distributions are essentially the same for the ‘original’ NCP sets and for the nucleosomal sequences found in the genomes, indicating that the ‘selected’ sequences faithfully represent the ‘original’ sets.
An additional argument in favor of this interpretation follows from the comparison of the ‘widths’ of the AT2 peaks. In the case of chicken NCPs, the terminal AT2 peak is relatively narrow (from −2 to 2), which is consistent with the narrow length distribution of the chicken NCPs (Figure 3a). On the other hand, the terminal AT2 peak in yeast has a broader base (from −8 to +2), in accord with the wider distribution in the yeast NCP length (Figure 3b).
Because the NCP fragments are the products of MNase digestion, we asked whether the observed AT2/AT3 peaks at the NCP ends are related to sequence preference of MNase cleavage (27,28). We found that in both the chicken and yeast data sets the MNase consensus can be defined as WWW|TGC, where the vertical bar denotes the cutting position and W stands for A or T (Table S3). This is in accord with the earlier results for free DNA (27,28), where the strongest MNase cleavage was also observed at the junctions between the AT-rich and GC-rich elements. Thus, we see that the terminal peaks in the AT2 and AT3 profiles (Figure 2, Supplementary Figures S1 and S2) are indeed associated with MNase treatment. This assessment is consistent with recent work by Field et al. (29) who observed a cleavage consensus of WW for large set of yeast nucleosomes. It remains unclear, however, if the differential positioning of AT-rich sequences at the ends of chicken and yeast nucleosomes actually represents a novel sequence pattern differentiating the two chromatins, or is a consequence of limited (and biased) sampling and/or specific alignment method used.
To clarify the issue, we examined the AT2 and AT3 distributions in two recently published sets of H2A.Z nucleosomes from yeast (10) and Drosophila (11). Previous studies have shown that at the structural level, the H2A.Z nucleosomes are similar to major-type nucleosomes (30). We therefore anticipated that the two sets of nucleosomes (H2A.Z and major-type H2A) would exhibit similar features at the DNA sequence level. Indeed, for Drosophila H2A.Z nucleosomes, the highest occurrence of AT2 dimers corresponds to position 0 (Figures 2c and Supplementary S2), which is in the same position as in the chicken H2A nucleosomes (Figure 2a).
In this regard, it is important that both chicken and Drosophila are multicellular eukaryotes sharing the same types of linker histones (31), different from the yeast histone Hho1p (32,33). In the case of the yeast H2A.Z nucleosomes, the AT2 peak is observed at position −2 (Figure 2d), similar to the yeast major-type H2A set described above (Figure 2b).
These results indicate that nucleosomes from different genomic regions in yeast show no difference in the positioning of the ‘terminal’ AT2 peak, suggesting that this may represent a sequence pattern common to yeast nucleosomes in general. [Note that the H2A.Z-containing nucleosomes are mostly localized in the promoter regions (10), while the nucleosomes containing major-type H2A are found throughout the whole genome (9).] The 2–3-bp shift between the terminal AT2 and AT3 peaks observed in the chicken and yeast nucleosomes is confirmed by two additional datasets (10,11), each containing thousands of sequences (Figure 2, Supplementary Figures S1 and S2). Therefore, this shift cannot be explained solely by statistical errors arising from the small sample sizes.
Note that the amplitudes of the terminal AT2 peaks in Figure 2 were obtained after symmetrization. For example, the frequencies of occurrence of AT2 dimers at the ends of the chicken and Drosophila nucleosomes, 44% and 50% respectively, are the averages for two ends. The fraction of nucleosomes having the AT2 dimer at least at one end is nearly twice as high, 77% for chicken and 87% for Drosophila. [These values reflect the AT2 occurrence in the intervals (0, 1) for chicken and (−1, 0) for Drosophila, see Figure 2a and c.] In other words, more than three-fourths of the metazoan nucleosomes have the AT-rich terminal motif positioned in such a way that it distinguishes them from the yeast nucleosomes.
In addition, we analyzed the genome-wide set of nucleosomes from the nematode Caenorhabditis elegans (34). This set contains ∼160 000 sequences comprising 146-bp ‘presumed’ core DNA and 60-bp flanking DNA. The strong terminal AT2 peak was found in position 0, directly confirming the results for chicken and Drosophila nucleosomes (data not shown).
Distance autocorrelation between terminal AT2 dimers
In principle, it is possible that the relative shift in positioning of AT2 dimers in the analyzed sets of nucleosomes is due to imperfect alignment of the sequences. To rule out this possibility, we applied the distance autocorrelation function, P(n), representing the frequency of occurrence of two AT2 dimers with distance n between them (13,35). The advantage of using this function is that the results are not dependent on specific alignment of the DNA fragments, but instead reflect organization of the individual sequences per se.
The P(n) profiles calculated for the terminal regions of ‘extended’ nucleosomes (i.e. for positions −8 to 12) demonstrate a clear difference between the metazoan (chicken and Drosophila) and yeast nucleosomes (Figure 4). For the chicken and Drosophila sequences, the autocorrelation function has two maxima, at n = 6/7 and n = 11/12 (Figures 4a, c and Supplementary S2). In other words, the AT2 dimers are most frequently separated either by a helical pitch of the DNA duplex [reflecting the ‘canonical’ periodicity observed in genomic sequences (13)], or by a half-pitch, which is unusual and suggests that a substantial fraction of AT2 dimers is arranged in an ‘out-of-phase’ mode. Note that the P(n) maximum at n = 6/7 corresponds to two terminal AT2 peaks at positions 0/1 and 6/8 (Figure 2a and c).
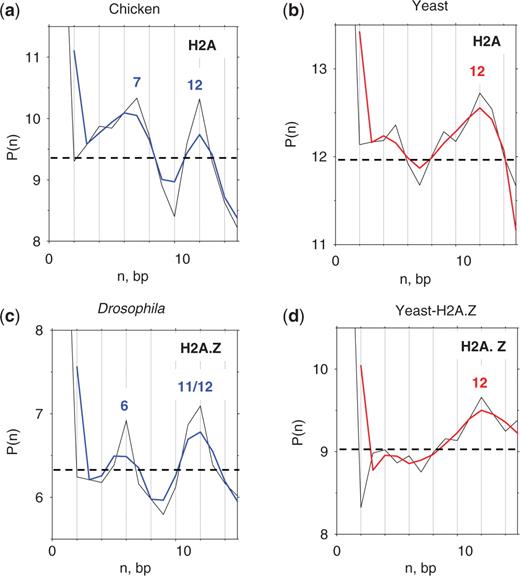
Autocorrelation between AT2 dimers located in terminal regions of nucleosomes. The distance autocorrelation function, P(n), represents the frequency of occurrence of two AT2 dimers with distance n between them (13,35). The intervals from −8 to +12 in both strands were used to calculate the autocorrelation for the chicken (a), yeast (b), Drosophila (c) and yeast-H2A.Z (d) sequences. Dashed lines represent the P(n) averages (n = 1 to 15) over 1000 implementations of the same number of ‘random’ sequences as in the original NCP sets. The tri-nucleotide composition was the same as in the corresponding genomic fragments in the intervals (–8, +12). None of the standard deviations of randomly generated P(n) values exceeded 0.15. Therefore, all the peaks observed at n = 6/7 and n = 11/12 have Z-score values 4.5 and higher (the significance level is P < 10–5).
In contrast, for the yeast sequences (both H2A and H2A.Z sets), the only pronounced peak is located at n = 12 (Figure 4b and d). This is consistent with the two AT2 peaks occurring at positions −2 and 7/9 (Figure 2b and d), indicating that most of the AT2 dimers are in phase with each other in the terminal regions of yeast nucleosomes.
In summary, our results confirm that the yeast and metazoan (chicken and Drosophila) nucleosomes differ in positioning of AT2 dimers in the end regions, this positioning being ‘more distal’ in yeast (compare with Figure 3). The observed difference is not due to the specific way the sequences are ‘center-aligned’. Rather, this difference reflects inherent trends in the sequence organization of nucleosomes in multi-cellular eukaryotes that are not found in yeast. Finally, note that the human α-satellite DNA fragments crystallized with the yeast, chicken and Drosophila histones (36–38) have practically indistinguishable trajectories at the ends of NCPs (the distances between the corresponding base-pair centers do not exceed 1.2 Å; data not shown). Therefore, it is unlikely that the distinctive positioning of the terminal AT-rich elements described above is related to the NCP structure per se. The more likely cause of the observed difference lies beyond the core particle, and involves interactions with linker histones (see below).
In structural terms, the shift between AT-peaks at the ends of nucleosomes can be interpreted as follows. In the yeast nucleosomes, the terminal AT2 (or AT3) peak is in phase with the periodic pattern observed inside the nucleosome core (Figures 2b, d, Supplementary Figure S1b and S1d)—that is, the ∼10-bp periodic oscillation goes beyond the end points of the yeast nucleosomes, which is consistent with the idea that the linker DNA extends the superhelical trajectory of the nucleosomal DNA (39). In the chicken and Drosophila nucleosomes, however, the sequence periodicity is interrupted at the ends, the terminal AT-peak being shifted by 2–3 bp (Figure 2a, c and Supplementary Figure S1a and S1c). The ‘out-of-phase’ positioning of this peak may reflect distortions of the regular DNA superhelix at the entry/exit points of nucleosomes, where linker histones presumably interact with nucleosomal DNA (4).
Structural model for linker histone globular domain binding to nucleosomal DNA
As shown above, the core DNAs extracted from various organisms differ in positioning of the AT2 and AT3 fragments at the NCP ends (Figure 2 and Supplementary Figure S1). Note in this regard that linker histones bind to DNA flanking regions (4) and demonstrate preference for AT-rich sequences (5–7). The abundance of linker histones varies substantially in these species: Drosophila nucleosomes have one LH on average (14), chicken erythrocyte nucleosomes have ∼1.3 linker histone molecules (H1 + H5) on average, while in yeast, the H1-analog Hho1p is found in one of 4 to ∼40 nucleosomes (16,17). We therefore suggest that the observed difference reflects selective LH interactions with the AT-rich fragments at the ‘entry-exit’ points in a relatively high fraction of the metazoan nucleosomes (as opposed to yeast, where the sequence-specific Hho1p–DNA interactions are either absent, or present in a tiny fraction of nucleosomes).
Before proceeding to the structural interpretation of our results, note that only one protein from the H1 family has been crystallized so far—namely, the globular domain of the chicken histone H5 (GH5) (20). Most of the data for LH binding to DNA was obtained for the chicken H5 (40,41) and for murine H10 (42). Due to a very high homology between the H5 and H10 sequences, the data for murine H10 is interpreted based on the X-ray structure of the chicken GH5 (20). By contrast, the sequence homology between Drosophila H1 and chicken H5 is less significant, hence a structural modeling of the Drosophila LH is a serious problem deserving a special investigation. Therefore, below we limit ourselves to the case of LH binding to nucleosomal DNA in vertebrates, and propose a model accounting for much of the biochemical data accumulated for H5 in vitro (40,41) and H10in vivo (42).
Traditionally, most of the DNA-binding residues are grouped in sites I and II (40), well separated on the surface of the globular domain of the H10/H5 histone (Figure 5a). Various structural models for LH binding to nucleosomal DNA have been proposed recently based on the GH5 structure (20). These models differ in the specific location of sites I and II on nucleosomal DNA (Figure 6). For example, Zhou et al. (43) and Bharath et al. (44) proposed that site II interacts with DNA close to the dyad, while site I interacts with the linker DNA (Figure 6b). In contrast, Brown et al. (42) suggested a reverse orientation of the LH domain, where site I binds DNA close to the dyad and site II binds linker DNA (Figure 6c). Note that LH–DNA interaction is assumed to be sequence-independent in these models. To account for the (limited) AT-specificity of the linker histones, we propose yet another model, also based on the X-ray structure of GH5 (20). In our model (Figure 6d), the position of GH5 relative to the nucleosomal dyad is close to that proposed by Zhou et al. (43), but orientation of the globular domain is similar to that in the Brown et al. model (42).
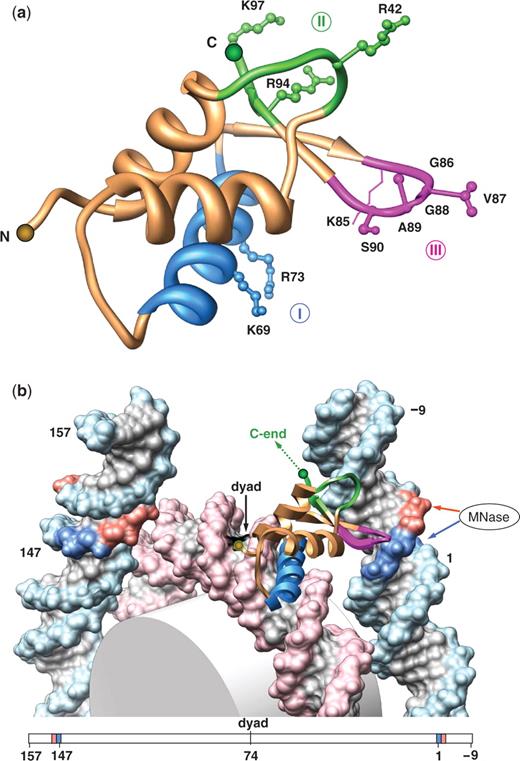
Structural model for LH globular domain binding to nucleosomal DNA. (a) DNA-binding sites in GH5 in various models for LH globular domain binding to nucleosomal DNA. The GH5 X-ray structure is shown (monomer A in ref. 20: Helix 1 and Helix 2, ochre; Helix 3, blue). The DNA-binding residues corroborated both in vivo (42) and in vitro (40,41) are traditionally divided into two groups—site I (K69 and R73 shown in blue) and site II (R42, R94 and K97 shown in green). In the model proposed by Zhou et al. (43), only R42 in site II is close to DNA. Site III (identified in this study) is highlighted in magenta. Note that K85 is traditionally viewed as part of site I. We propose that it may belong to site III (see ‘Discussion’ section); therefore, it is shown in magenta. The LH residues are numbered based on the GH5 sequence (20). (b) Molecular model of GH5 location within the nucleosome. The 147-bp core DNA (19), indexed from 1 to 147, is extended at each end by ‘ideal’ B-DNA fragments representing linkers. At one end (at the base-pair step 0/1), DNA is bent by 20° into the major groove; the other end of the nucleosomal DNA is ‘straight’. The 10-bp linker DNA fragments are numbered −9, −8, … 0 at one end, and 148, 149, … 157 at the other end. The positions 0/1 and 147/148 are colored in blue, corresponding to the ‘terminal’ AT2 peak in chicken (Figure 2a), while positions −2/−1 and 149/150 are colored in red, corresponding to the ‘terminal’ peak in yeast (Figure 2b). GH5 is represented with the same color code as in (A). The arrows on the right indicate accessibility of the DNA minor groove for MNase cleavage: red arrow, at positions −2/−1; blue arrow, at positions 0/1. The figure was prepared with Chimera (72); the H5 carboxyl end is shown by a dashed line.
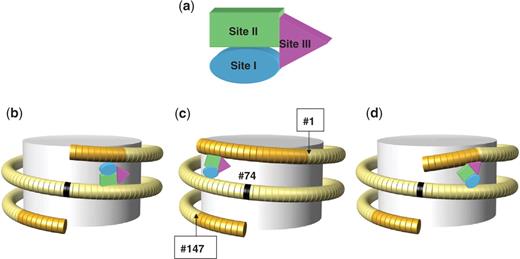
Different positioning of LH globular domain in the three models for linker histone binding to nucleosomal DNA. (a) The three DNA-binding sites in the globular domain GH10/GH5 are shown schematically, using the same color code as in Figure 5: site I is in blue, site II in green and site III (wing) in magenta. Three cartoons illustrate different positioning of the LH globular domain with regard to the nucleosomal dyad proposed by Zhou et al. (43) (b), Brown et al. (42) (c) and in our model (d). Note that in our model, the position of GH10/GH5 relative to the nucleosomal dyad is close to that proposed by Zhou et al. (43), but orientation of the globular domain is similar to that in the Brown et al. model (42). In addition, we postulate that the ‘wing’ domain interacts with DNA in the major groove, thereby facilitating bending of the linker toward the dyad. According to our model, LH–DNA interactions in the major groove are hydrophobic and sequence specific, involving, on the histone side, four nonpolar residues, GVGA, and on the DNA side, thymines or methylated cytosines (see Figure 5b).
We found that placement of site I (Helix 3 of GH5) in the major groove half a turn away from the nucleosome dyad, in such a way that site II is close to DNA backbone, brings the GH5 ‘wing’ domain in the vicinity of the DNA entry/exit point, also in the major groove (Figure 5b); see ‘Methods’ section for details. The ‘wing’ domain contains four nonpolar residues, G86, V87, G88 and A89 (Figure 5a). Since AT-rich DNA has hydrophobic patches in the major groove formed by thymine methyl groups, the aliphatic side chains of the tetrapeptide GVGA would prefer direct contacts with the AT-rich fragment located at the NCP end (positions 0/1, highlighted in blue in Figure 5b). The detailed energy minimization of the GH5–NCP complex suggests that valine-87 in the ‘wing’ domain can favorably interact with thymines in both DNA strands (F.C., Wang,D. and V.B.Z., in preparation).
Therefore, we hypothesize that the ‘wing’ domain of the linker histone serves as a previously unidentified DNA-binding site we term site III (Figure 5a) that recognizes methyl groups in the major groove near the end of nucleosomal DNA (Figure 5b). The importance of interactions between site III and DNA was demonstrated in a recent mutagenesis study by Brown et al. (42), where substitution of A89 for aspartic acid led to a severe decrease in the binding of murine histone H10 to nucleosomes in vivo. [Note, however, that according to the model proposed in that study (42), the hydrophobic ‘wing’ domain is exposed to solvent, in an energetically unfavorable arrangement.]
The yeast linker histone Hho1p has two putative globular domains (GI and GII) (31,32), each with different structural stability (45,46). Only a preliminary analysis can be made in this case, if one assumes that the first globular domain (GI) of Hho1p, whose NMR structure is available (45,47) binds to the nucleosome in the same way as GH5 (Figure 5b). The Hho1p ‘wing’ contains only three residues, GPA, compared to the pentapeptide GVGAS found in the H10/H5 ‘wing’. As a consequence, the yeast ‘wing’ domain is too short to reach the DNA entry/exit points (positions 0/1, shown in blue in Figure 5b), but instead can contact DNA at positions −2/−1 (shown in red in Figure 5b).
DNA deformations induced by linker histone binding
Protein–DNA interactions in the major groove are frequently accompanied by local B-to-A-like transitions in DNA (48,49), including positive Roll of the base pairs and DNA bending. We found that this kind of DNA bending is stabilized by electrostatic interactions between arginines R42 and R94 (site II) and the sugar-phosphate backbone. Therefore, we hypothesize that as a result of the ‘wing’ penetration into the major groove, the linker DNA is bent as shown in Figures 5b and 6d.
Although it is well established that linker histones facilitate chromatin compactness, there are only a few ‘direct’ experiments that have shed light on the 3D trajectory of nucleosomal DNA deformed in the presence of LHs. Historically, one of the first observations along this line was made by Pehrson (50), who demonstrated a difference in the site-specific formation of thymine dimers (TDs) between LH-containing and LH-stripped rat chromatins. In the author's interpretation, the increase in TD formation near the NCP ends reflects LH-induced ‘sideways bends’ of DNA directed into the major groove (50); these bends bring entering and exiting DNAs closer to each other. Later, Prunell and his co-workers (51) visualized by electron microscopy LH-containing mono-nucleosomes, and found that the C-terminal tail of H5 bridges two linkers together into a characteristic ‘stem-like’ structure. The two observations are consistent—in both cases, at least one of the two DNA linkers is bent toward the NCP dyad (for review see ref. 52).
Based on our model, we suggest the following interpretation of these results. The terminal TD peak formed in the presence of linker histones (50) is shifted by 2–3 bp ‘outwards’ (toward the linker) relative to superhelical site 7. The latter is located at position 2/3 according to our notation. Therefore, the LH-induced TD peak is located at position 0/1, where we found the highest AA:TT occurrence in the chicken NCP sequences (Figure 2). This is exactly the same position where we postulate the direct contact between the ‘wing’ domain (site III) and AT-rich DNA (Figure 5b). Penetration of the hydrophobic ‘wing’ into the major groove would induce local A-like deformations of the duplex, well documented in numerous protein–DNA complexes (48,49). These deformations include positive Roll and a decrease in helical Twist, both of which facilitate formation of pyrimidine dimers (53). Thus, our model is in quantitative agreement with the position of TDs formed in the presence of LHs (50).
In addition, Pehrson (50) observed an increase in formation of LH-induced thymine dimers close to the nucleosome dyad. As follows from our model, binding of site I (Helix 3 of LH) to the major groove about a half turn from the dyad may promote local DNA distortion (48,49)—in particular, the positive Roll consistent with TD formation.
Linker histones prefer AT-rich DNA regions and methylated DNA
It has been known for over 30 years that the linker histone H1 exhibits a general preference for AT-rich DNA (5–7). One of the best-known examples of H1 selectivity is its strong binding to AT-rich scaffold attachment regions (SARs) (54). The H1–SAR interactions are inhibited by distamycin, a minor-groove binding ligand with high specificity for AT-rich fragments (6). Another example is the differential expression of 5S RNA genes during early Xenopus development (55). Apparently, the H1-dependent selective repression of the oocyte-type 5S genes is associated with preferential binding of H1 to the AT-rich spacer between the oocyte genes, but not to the GC-rich spacer between the somatic genes (56–58). Overall, these data are consistent with the notion that linker histones preferentially bind to AT-rich fragments.
It still remains unclear, however, which part(s) of LHs are mostly responsible for the AT-rich DNA preference. Initially, it was suggested that the lysine-rich C-terminal domain may be responsible for LH selectivity, in accord with the preferential interactions of polylysine with AT-rich DNA (59). The later studies have indicated that the globular domain (60) and the N-terminal tail (61,62) may also contribute to the LH preference for AT-rich fragments. In the model proposed here, we suggest that the highly conserved, nonpolar ‘wing’ domain may favorably interact with the thymine methyl groups exposed in the major groove at nucleosome ends. However, we do not exclude the possibility that other parts of LHs also play an important role in the sequence specificity of LH binding.
Note in this regard that both the N- and C-terminal domains are critical for ‘correct’ placement of LH in nucleosome (63). It was also proposed that the intrinsically disordered C-terminal subdomains acquire secondary structures upon low sequence-specific, charge-dependent binding of LH to DNA (64). Thus, initial anchoring of the N- and C-termini of LH may place the globular domain close to the nucleosome entry/exit points and facilitate the sequence-dependent interaction between the LH ‘wing’ and AT-rich DNA, as described in our model (see Figure 5b, where the N- and C-ends of GH5 are shown as orange and green balls respectively).
From an evolutionary point of view, it is remarkable that the ‘wing’ domain mentioned above contains the tetrapeptide motif GXGA, conserved in all vertebrate linker histones (65). The H10 and H5 histones have valine in the second position, whereas serine or threonine is found in the other H1 subtypes. As a result, the H10/H5 ‘wing’ domain (containing the GVGA motif), is more hydrophobic than in the other H1 variants (G-S/T-GA), and therefore is expected to interact more favorably with the major groove of AT-rich DNA. Histones H10 and H5 occur predominantly in terminally differentiated cells as replacements for other H1 variants and play an important role in forming highly condensed chromatin (66,67). Therefore, it is plausible that the enhanced hydrophobic interaction between the H10/H5 ‘wing’ and AT-rich DNA may promote formation of the compact chromatin structure in these cells.
Furthermore, the nonpolar interactions between DNA and the LH globular domain (postulated in our model) naturally explain the high affinity of linker histones to methylated DNA (68,69) because the cytosine methyl groups increase hydrophobicity of the DNA major groove. Remarkably, the globular domain GH1 per se (without the N- and C-termini) is also able to discriminate between methylated and unmethylated DNA (69). In addition, chicken histone H5 has a stronger preference for methylated DNA than the major-type H1 (69). As follows from the discussion presented above, this effect is consistent with the H5 ‘wing’ domain being the most hydrophobic among all H1 variants.
CONCLUSION
We have observed a significant difference in distribution of the AT-rich fragments in the terminal and flanking regions of chicken, Drosophila and yeast nucleosomes, a novel pattern not visible in the original sequences. In particular, the yeast nucleosomes are characterized by a ‘more distal’ positioning of the AT2/AT3 fragments at the ends, which correlates with the longer yeast NCP sequences extracted by MNase cleavage. In yeast nucleosomes, these ‘terminal’ AT2/AT3 fragments are positioned in phase with the known 10–11-bp periodic oscillation of the AT-rich elements inside the nucleosome core. By contrast, this oscillation is distorted in metazoan (chicken and Drosophila) nucleosomes—the terminal AT2/AT3 peaks are shifted from the periodic pattern by 2–3 bp. This nonuniform sequence pattern may reflect DNA deformations at the entry/exit points of nucleosomes, such as the ‘sideways bends’ suggested by Pehrson (50). Detecting this ‘out-of-phase’ signal became possible only because we used the NCP sets obtained at single-nucleotide resolution. Importantly, distribution of AT-rich elements was the same in H2A.Z-containing nucleosomes (10,11) and major-type H2A nucleosomes (9,12).
We further connected the difference in sequence organization of the two sets of nucleosomes (metazoan and yeast) with the linker histones binding preferentially to AT-rich DNA. Note that in chicken erythrocyte chromatin (containing histone H5) and in Drosophila chromatin (histone H1) the ratio of LH to nucleosomes is at least four times higher than that of Hho1p in yeast chromatin (3,15–17). Hence, the role of linker histone binding in the sequence organization of metazoan nucleosomes is expected to be much stronger than in the case of yeast nucleosomes.
To account for the observed sequence patterns, we propose a new model for H10/H5 binding to nucleosomes, based on the X-ray structure of chicken GH5 (20). We suggest that the ‘wing’ region of the GH10/GH5 domain, containing tetrapeptide GVGA, binds to AT-rich fragments at the NCP ends through favorable hydrophobic interactions with the thymine methyl groups. In such a case, the ‘out-of-phase’ AT-rich pattern described above provides a sequence signal for the translational positioning of nucleosomes. Consideration of this signal may improve prediction of nucleosome positioning in higher eukaryotes.
Our model suggests a simple way to stabilize LH–DNA interactions, which can be useful for crystallization of chromatosome (or a complex of nucleosome with the globular domain GH10/GH5). For example, consider the well-known ‘601’ sequence (70) with the established nucleosome position. This 147-bp core DNA sequence has GC-rich ends. Based on our model (Figure 5b), we predict that insertion of a short A-tract near one end of the ‘601’ fragment would facilitate binding of a LH on one side of the nucleosome, by analogy with asymmetric LH binding in the case of the sea urchin 5S gene (71).
Finally, the nonpolar interactions between DNA and the LH globular domain may account for the high affinity of linker histones to methylated DNA (68,69) because the cytosine methyl groups also form hydrophobic patches in the major groove. Although these interactions are relatively weak, they might be important for fine-tuning of chromatin compaction in the course of cell differentiation (67). Thus, our model provides a simple molecular mechanism, explaining and linking together various properties of LHs, such as preferential binding to AT-rich clusters and methylated DNA, the latter being especially interesting due to its epigenetic effects.
FUNDING
The Intramural Research Program of the NIH, National Cancer Institute, Center for Cancer Research. Funding for open access charge: Intramural Research Program of the National Institutes of Health.
Conflict of interest statement. None declared.
ACKNOWLEDGEMENTS
We are grateful to B.F. Pugh, A.A. Travers and J. Widom for providing us with the nucleosomal sequences, to D.T. Brown and T. Misteli for sharing with us coordinates of their GH10-nucleosome model, to D.J. Clark, C. Crane-Robinson, S.A. Grigoryev and W.K. Olson for valuable discussions, to D. Wang for help with molecular modeling, and to G. Leiman for text editing.

Comments