


Abstract
Understanding how gene regulatory elements influence ovarian follicle development has important implications in clinically relevant settings. This includes understanding decreased fertility with age and understanding the short-lived graft function commonly observed after ovarian tissue cryopreservation and subsequent autologous transplantation as a fertility preservation treatment. The Assay for Transposase-Accessible Chromatin by sequencing (ATAC-seq) is a powerful tool to identify distal and proximal regulatory elements important for activity-dependent gene regulation and hormonal and environmental responses such as those involved in germ cell maturation and human fertility. Original ATAC protocols were optimized for fresh cells, a major barrier to implementing this technique for clinical tissue samples which are more often than not frozen and stored. While recent advances have improved data obtained from stored samples, this technique has yet to be applied to human ovarian follicles, perhaps due to the difficulty in isolating follicles in sufficient quantities from stored clinical samples. Further, it remains unknown whether the process of cryopreservation affects the quality of the data obtained from ovarian follicles. Here, we generate ATAC-seq data sets from matched fresh and cryopreserved human ovarian follicles. We find that data obtained from cryopreserved samples are of reduced quality but consistent with data obtained from fresh samples, suggesting that the act of cryopreservation does not significantly affect biological interpretation of chromatin accessibility data. Our study encourages the use of this method to uncover the role of chromatin regulation in a number of clinical settings with the ultimate goal of improving fertility.
Introduction
Human folliculogenesis is the process by which the female germ cell develops within the somatic cells of the ovary to mature into a reproduction-competent oocyte (Sánchez and Smitz, 2012). The follicle consists of the oocyte surrounded by a layer of granulosa cells, which expand and are encased by an additional layer of thecal cells as the follicle matures. Follicle development is under complex regulation by cytokines and hormones, resulting in the establishment of stage-specific transcription programs in both oocytes and the surrounding support cells of the follicle (Zhang et al., 2018). Understanding the regulation of these transcription programs is of high clinical relevance for assisted reproductive biology. For example, infertility can, in some cases, be attributed to impaired follicle development. Additionally, cryopreservation of ovarian tissue has been developed as a fertility preservation option for individuals facing gonadotoxic anti-cancer treatments (Donnez et al., 2004). However, subsequent autotransplantation of this tissue results in poorly understood uncontrolled follicle activation, subsequently limiting patient fertility (Dolmans et al., 2021).
Transcription programs are regulated in the context of chromatin, the physiologically relevant form of the human genome (Allis and Jenuwein, 2016). This complex of DNA and associated proteins is required to package the genome into the small physical space of the nucleus, yet fundamentally serves as a barrier to accessing information encoded in the DNA sequence. Chromatin-associated proteins cooperate to establish chromatin states that are either permissive (‘open’ chromatin) or non-permissive (‘closed’ chromatin) to the binding of transcription factors that are a major regulatory mechanism for controlling gene expression. These transcription factors bind to both distal and proximal regulatory elements (i.e. enhancers and promoters) to facilitate cell type specific transcription programs (Spitz and Furlong, 2012). Understanding how cells control chromatin access is of critical importance to understanding tissue development and homeostasis with age.
Recent advances in technology and genome sequencing have improved our ability to define regions of open chromatin (Klemm et al., 2019). Perhaps the most powerful and widely adopted tool for identifying open chromatin is the Assay for Transposase-Accessible Chromatin by sequencing, or ATAC-seq (Buenrostro et al., 2013). This technique takes advantage of a Tn5 transposase enzyme that facilitates DNA cleavage and the simultaneous ligation of short DNA sequences at hypersensitive open chromatin sites. Amplification and high throughput sequencing of these DNA fragments reveals active regulatory elements, both proximal promoters and distal enhancers, in the cell type of interest. This protocol was originally developed for fresh cells and works optimally on as few as 50 000 cells. However, many clinical samples are archivally frozen or cryopreserved and stored, and such cell numbers may not be available. Optimizations of the ATAC-seq protocol such as Omni-ATAC were developed to allow analysis of flash-frozen tissues, resulting in high-quality data from relatively small tissue sections (50 μm sections) (Corces et al., 2017). However, this technique has never been applied to human ovarian follicles, perhaps due to the difficulty in dissecting such tissues from the surrounding stromal cells and the small cell numbers that can be isolated.
Here, we provide ATAC-seq analysis of pre-antral human follicles. We provide a direct comparison between matched donor data sets obtained from fresh and cryopreserved stored follicles. Our analyses show that the data are highly consistent, particularly in detecting robust ATAC-seq signals at active promoters. These data offer a critical baseline for applying this method for clinical application and encourage the further use of the ATAC-seq method for chromatin profiling of human follicles in the context of aging and assisted reproduction technologies.
Materials and methods
Ovarian tissue procurement and processing
The Institutional Review Board of the University of Texas Southwestern Medical Center approved the use of human tissue. Written informed consent was obtained from women undergoing oophorectomy while receiving surgery for benign gynecologic indications, such as abnormal uterine bleeding or pelvic pain. Twelve women donated to the study. Out of these participants, given their age and the quality of the tissue, two participants contributed to the side-by-side comparison of ATAC-seq on fresh and frozen ovarian follicles (see Supplementary Table SI).
On average, about three 1 cm ovarian slices were obtained per sample. Samples were placed in human tubal fluid media (Cooper Surgical, USA) and transported from the operating room on ice to the laboratory for processing. Ovarian slices were sharply dissected into cortical pieces, ranging from 5 to 10 mm×10 mm×1 mm in dimension. Two pieces were submitted for histopathologic evaluation, and two pieces were used for immediate tissue digestion and follicular isolation. The remaining pieces were vitrified, and subsequently warmed, according to a previously published protocol (Silber, 2017).
Histology and immunohistochemistry
Preparation of slides occurred through the UT Southwestern Histo-Pathology Core Laboratory. Two cortical pieces from each sample were submitted for evaluation. The cortical pieces were fixed in formalin solution and processed into 5 μm slices. Images were procured at 20× magnification using a Zeiss Axioskop-2 Mot Plus microscope (Carl Zeiss, Germany). Hematoxylin and eosin (H&E)-staining was used as a secondary measure to confirm the presence of pre-antral ovarian follicles.
Ovarian tissue digestion and follicle isolation
Digestion of ovarian cortical pieces and isolation of ovarian follicles followed previously published protocols (Dolmans et al., 2006; Vanacker et al., 2011). Briefly, cortical pieces were sharply dissected into smaller pieces of about 2 mm×2 mm×2 mm in size. These were added to a 50 ml conical tube with 10 ml Dulbecco’s phosphate-buffered saline (PBS, UTSW General Store) and 0.28 Wunsch units/ml Liberase DH (Sigma-Aldrich, USA). The conical tube was sealed with parafilm and placed in a water bath at 37°C with gentle agitation. The digestion was terminated after 75 min by adding 10 ml of 10% fetal bovine serum in Dulbecco’s PBS at 4°C. The supernatant was removed, and the tissue was placed on a petri dish and inspected under a Leica M165 FC stereomicroscope. Follicles were completely isolated from the surrounding stromal tissue via careful blunt dissection. A Cook Flexipet™ (Cook Medical, USA) was used to pick up the follicles and transfer them into a 1.5 ml Eppendorf tube with 250 μl of 10% fetal bovine serum at 4°C. Given the gross isolation of the cortex and the results of H&E staining, the isolated follicles were anticipated to be no larger than early secondary stage.
Omni-ATAC transposition
Analysis of gene regulation using a modified omni-ATAC approach (Corces et al., 2017) took place on isolated follicles. Each follicle was estimated to have about 1000 cells, and reagent concentrations were adjusted accordingly, most importantly to keep the transposase: cell number ratio similar, at around 1 μl Tn5 per 20 000 cells. Follicles were resuspended in 10 mM Tris–HCl pH 7.4, 10 mM NaCl, 3 mM MgCl2.
After isolation, the follicle suspension was pelleted at 500 relative centrifugal force (RCF) for 5 min at 4°C. The supernatant was carefully removed so as to not disturb the pellet. The pellet was then resuspended in 50 μl PBS by finger tap. The suspension was then centrifuged again at 500 RCF for 5 min at 4°C. The supernatant was carefully removed. The lysis buffer was added (for most reactions; 48.5 μl resuspension buffer, 0.1% NP-40, 0.1% Tween-20, 0.01% digitonin), and the pellet was resuspended by finger tap. The suspension was incubated on ice for 3 min. A wash buffer was then added (for most reactions; 1 ml resuspension buffer, 0.1% Tween-20), and the suspension was immediately centrifuged at 500 RCF for 10 min at 4°C. The supernatant was carefully removed. The transposition reaction was then added based on estimated cell number (reaction included Illumina (USA) TDE1 Tagment DNA Enzyme, Illumina (USA) TD [Tagment DNA] Buffer, PBS, 0.1% Tween-20, 0.01% digitonin, molecular grade water). The pellet was suspended by finger tap, and the suspension was incubated on a thermomixer at 37°C with 1000 rpm of agitation for 30 min.
To stop the transposition, the suspension was subjected to immediate purification using the QIAquick PCR purification kit (Qiagen, Germany) with MinElute columns (Qiagen, Germany) (Buenrostro et al., 2015a). The purified DNA fragments were then resuspended in 15 μl molecular grade water (Sigma-Aldrich, USA), run through the column twice to ensure complete yield. To assess yield prior to library preparation, the QuBit dsDNA HS Assay (Thermo Fisher, USA) was used to analyze the DNA concentration in 1 μl of the resulting suspension.
Library preparation
The PCR amplification protocol was performed as previously reported with minor adaptations (Buenrostro et al., 2015a). The purified DNA fragments underwent an initial PCR reaction of five cycles (25 µl NEBNext® Ultra™ II Q5® Master Mix, 7 μl sample, 8 μl molecular grade water, 5 μl Nextera/Illumina (USA) Index 1 [i7] adapter, 5 μl Nextera/Illumina (USA) Index 2 [i5] adapter). The resulting product was diluted 1 μl in 1000 μl molecular grade water and underwent quantitative PCR with Power SYBR Green, following the KAPA protocol: 6 μl master mix + primer solution was added to 4 μl standard or dilute sample; samples were run in duplicate using a LightCycler® 480 Instrument II system (Roche, Switzerland). The quantitative 2nd derivative calculation was then entered into an Excel program, and the number of additional PCR cycles was calculated to achieve a final concentration of between 10 and 20 nM.
Library purification
After quantitative PCR, the libraries were purified using a double-sided bead purification protocol. The AMPure XP beads (Beckman Coulter, USA) were warmed to room temperature and vortexed into suspension. The amplified library was transferred to a new 1.5 ml Eppendorf tube, and 0.5× volume beads were added and mixed thoroughly with pipette action. The mixture was incubated at room temperature for 10 min, and then placed on a magnetic rack for 5 min. The supernatant was removed and transferred to a new 1.5 ml Eppendorf tube. Then, 1.3× volume AMPure beads were added and mixed thoroughly with pipette action. The mixture was incubated at room temperature for 10 min, and then placed on a magnetic rack for 5 min. The supernatant was carefully removed and discarded. The bead pellet was then washed with 200 μl freshly made 80% EtOH: the volume was pipetted down the opposite side of the Eppendorf tube as the pellet, covered the pellet for 30 s and was then removed. This process was repeated for a total of four washings. After the washings were completed, the Eppendorf tubes were left open for 10 min to allow evaporation of all the EtOH. The beads were then resuspended in 20 μl molecular grade water. The Eppendorf tube was placed back on the magnetic rack for 3 min, and the supernatant containing the purified library was transferred to a new 1.5 ml Eppendorf tube. The quality of the purified library was assessed using Bioanalyzer High Sensitivity Analysis on a 2200 TapeStation (Agilent, USA).
Sequencing
The purified library was quantified using a Qubit dsDNA HS Assay Kit (Thermo Fisher, USA). Libraries with unique adapter barcodes were pooled, multiplexed and sequenced on an Illumina NextSeq 500 (75-bp paired-end reads). Typical sequencing depth was at around 50 million raw reads per sample (see Supplementary Table SII for alignment details).
Omni-ATAC quality control, alignment and normalization
Quality of the ATAC-seq datasets was assessed using the FastQC tool. The ATAC-seq reads were then aligned to the human reference genome (hg19) using BWA (v.0.7.5) (Li and Durbin, 2009). For unique alignments, duplicate reads were filtered out. The resulting uniquely mapped reads were normalized to the same read depth across all samples and converted into bigWig files using BEDTools (Quinlan and Hall, 2010) for visualization in Integrative Genomics Viewer (Robinson et al., 2011). The fragment length distribution plots were generated using CollectInsertSizeMetrics tool from Picard (v 2.10.3).
Denoising
AtacWorks (v 0.3.0) was used to denoise the ATAC-seq data (Lal et al., 2021). All the fresh and cryopreserved and thawed samples were first preprocessed using the pipeline available at https://github.com/zchiang/atacworks_analysis/tree/master/preprocessing. After preprocessing, the ATAC-seq data were denoised to improve the signal-to-noise ratio using the model available from https://ngc.nvidia.com/catalog/models/nvidia:atac_bulk_lowqual_20m_20m. The denoised tracks as well as denoised peaks were obtained from AtacWorks. The denoised BigWig files were used to generate average ATAC-seq profiles and heatmaps using plotProfile and plotHeatmap tool from deepTools (v.3.4.3) (Ramírez et al., 2016).
Peak analysis
The denoised peaks across all samples in each group were merged to create a consensus peak set using HOMER mergePeaks (v.4.9) (Heinz et al., 2010) and Venn diagrams were generated using custom R scripts. Peaks were annotated to nearest genes using HOMER annotatePeaks.pl (v.4.9) with default settings (Heinz et al., 2010). The regions annotated as intronic and intergenic were combined and classified as distal peaks. Statistical analysis of peak overlap was obtained using permutation test framework regioneR (Gel et al., 2016).
Motif enrichment analysis
Motif matching and enrichment of the open chromatin regions was performed using HOMER findMotifsGenome.pl function (v.4.9).
Gene ontology
Gene ontology (GO) analyses were performed on annotated peaks using the clusterProfiler Bioconductor package.
Analysis of RNA-seq data
The primary follicle fastqs pertaining to GSE107746 was downloaded from Gene Expression Omnibus (GEO). Quality of the RNA-seq raw reads was assessed using the FastQC tool (v.0.11.2). The reads were then aligned to the human reference genome (hg19) using the spliced read aligner TopHat version v.2.0.12, transcriptome assembly was carried out using Cufflinks v.2.2.1 with default parameters, filtered transcripts were merged into distinct nonoverlapping sets using Cuffmerge, and Cuffdiff was used to calculate the FPKM of the genes (Trapnell et al., 2009). Samples used were SRR6350451–SRR6350475.
Code availability
Codes used to process data and generate figures can be found at https://github.com/utsw-medical-center-banaszynski-lab/Shannon-et-al-2022-MHR.
Results
The human ovary is composed of a highly vascular medulla and a cortex which is the site of follicular maturation (Fig. 1a). In primordial follicles, the primary oocyte is surrounded by a single layer of flattened epithelial granulosa cells. When the primordial follicle progresses to the primary follicle, the oocyte enlarges, the granulosa layer expands and the follicle develops a stromal layer called the theca. Secondary follicles continue to expand in size and cell number. Collectively, these are referred to as pre-antral follicles (Fig. 1b). Follicles continue to mature until ovulation, increasing in size and developing visible accumulations of fluid in intercellular spaces, referred to as antral follicles (Fig. 1b). For this study, we obtained human ovarian slices from five donors undergoing unrelated gynecological surgeries. While these patients were of advanced age with respect to fertility (ranging from 35 to 45 years old, see Supplementary Table SI), they represent a suitable tissue source for our comparative purposes. Ovarian slices were transported on ice and processed into cortical pieces post-surgery (Fig. 1c and d). Cortical tissue was either subject to a controlled slow freezing (vitrification) in a cryoprotective medium or processed directly for genomic assessment (Fig. 1e). We used H&E staining to confirm that these cortical pieces contained only primordial, primary and secondary follicles (Fig. 1f).
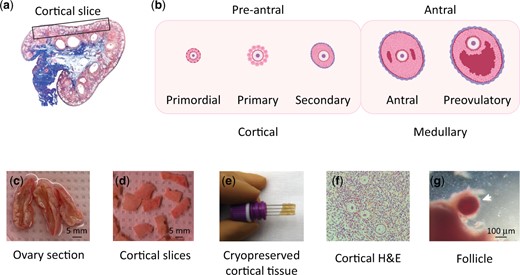
Schematic of study to measure chromatin accessibility from human follicles. (a) Drawing of human ovary section. Representative cortical tissue was dissected from the boxed area. (b) Schematic of follicle maturation. Follicles collected for study were primarily primordial, primary and early secondary. (c–g) Fresh ovary processing. (c) Tissue was obtained as ∼8 mm diameter ovarian slices. (d) Ovarian cortical pieces were dissected into 5–10 mm×10 mm×1 mm pieces. (e) Cryopreservation of cortical tissue. (f) H&E staining of pre-antral follicles in sections from cortical pieces. (g) Dissection of follicle from cortical piece for downstream Assay for Transposase Accessible Chromatin by sequencing (ATAC-seq). Note: Follicle was removed from surrounding tissue before processing.
We first performed manual dissection to isolate pre-antral follicles from fresh tissue, excluding follicles larger than 250 μm (Fig. 1g). These samples, consisting mainly of primordial, primary and early secondary follicles, were then subject to the Omni-ATAC protocol to access chromatin accessibility (Corces et al., 2017). In this assay, a Tn5 transposase enzyme cuts DNA and inserts sequencing adapters into open chromatin regions. These accessible regions are then amplified by PCR and identified using high-throughput sequencing and computational analysis. While Omni-ATAC was developed specifically to generate chromatin accessibility profiles from archival frozen samples, with tissue input as little as 20 mg, it has yet to be used for ovarian follicles. Therefore, we first individually processed and analyzed follicles isolated from fresh tissue, consisting of anywhere from 6 to 20 follicles each from four individual donors (Supplementary Table SI). To account for differences in cell number, we scaled the amount of Tn5 enzyme used based on the number of follicles isolated from each sample (see Materials and methods section and Supplementary Table SI for details). We obtained 35 million unique mapped paired-end reads from each sample (Supplementary Table SII), in line with ENCyclopedia of DNA Elements (ENCODE) project standards. The insert size distribution of sequenced fragments had a clear nucleosomal periodicity of around 200 bp, as expected (Fig. 2a). Further, data sets from all four donors were well correlated (Supplementary Fig. S1a). Of note, these data sets should identify active regulatory elements in both the oocyte and surrounding support cells.
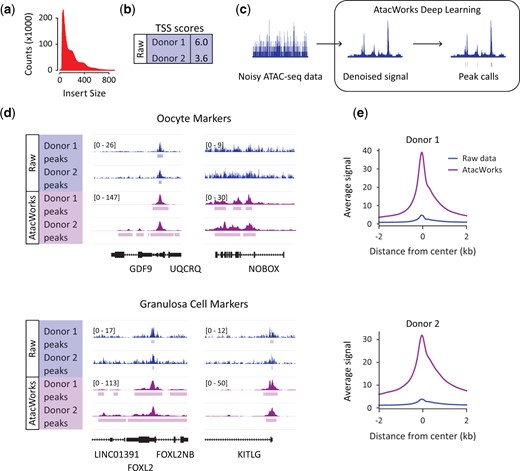
Deep learning enhancement of Assay for Transposase Accessible Chromatin by sequencing (ATAC-seq) data from human pre-antral follicles. (a) ATAC-seq fragment sizes generated from human pre-antral follicles. (b) Table showing transcription start site (TSS) score as a quality metric for ATAC-seq data sets from fresh pre-antral follicles. (c) Schematic of AtacWorks pipeline which uses machine learning to denoise ATAC-seq data sets. (d) Genome browser representation of ATAC-seq data from fresh human pre-antral follicles before (Raw data) and after (AtacWorks) denoising. Representative oocyte markers (top panel, GDF9 and NOBOX) and granulosa cell markers (bottom panel, FOXL2 and KITLG) are displayed. The y axis represents read density in reads per kilobase per million mapped (RPKM) reads. (e) ATAC-seq RefSeq TSS average profiles from fresh human follicles representing enriched regions before (Raw data) and after (AtacWorks) denoising.
The transcription start site (TSS) enrichment score is an important quality control metric that calculates signal to noise within a data set. The reads around a reference set of TSS extending 2 kb in either direction are aggregated and then normalized to the read depth at flanking regions. The value at the peak center indicates the fold-change enrichment over these flanking regions. For hg19 alignments, values from 6 to 10 are acceptable. The values for our fresh datasets ranged from 3.6 to 6.0 (Fig. 2b and Supplementary Fig. S1b and Table SII), perhaps due to the low input of our samples where we estimate that we generated libraries from as few as 5000 cells. Low-quality data is common from tissue samples, particularly clinical samples which are often limited in size (due to biopsy sizes) and quality (due to freezing and storage procedures) (Corces et al., 2017). To address this issue, a recent publication developed AtacWorks (Lal et al., 2021), a deep learning toolkit that takes low-coverage or low-quality ATAC-seq signal and denoises it to produce a higher-resolution or higher-quality signal. We used this framework to denoise our data (Fig. 2c).
We first assessed chromatin accessibility in raw and denoised data from fresh tissue at several genes that we expect to be expressed in the follicle, either in the oocyte or in granulosa cells (Fig. 2d and Supplementary Fig. S1c). When we analyze GDF9, an oocyte marker (Otsuka et al., 2011), we see obvious accessible chromatin in all datasets that does not require but is improved by the AtacWorks pipeline. However, chromatin accessibility at NOBOX, another oocyte marker (Rajkovic et al., 2004), is detectable from raw data but only identified as a peak of enrichment from denoised data. Evidence of chromatin accessibility at FOXL2 and KITLG, two markers of granulosa cells (Schmidt et al., 2004; Ernst et al., 2018), is also improved by AtacWorks. We next profiled both our raw and denoised data against all RefSeq TSS, with enrichment at the TSS far more obvious after AtacWorks (Fig. 2e and Supplementary Fig. S1d). Further, after denoising, we observe a substantial increase in the number of peaks identified as enriched in accessible chromatin from fresh samples (7671 vs 62 271). Generally, regions of enrichment identified before denoising are a subset of those identified after AtacWorks (7385/7671).
We next proceeded with isolation of pre-antral follicles from thawed cryopreserved tissue. As with the fresh tissue isolation, these follicles were manually limited to <250 μm, thus consisted mainly of primordial, primary and early secondary follicles. Observationally, the process of cryopreservation increased the stiffness of the tissue, making follicle isolation more difficult. Regardless, we were able to isolate 22 and 16 follicles from matched cryopreserved samples from Donor 1 and Donor 2, respectively. We also isolated an additional five follicles from a donor sample not used for the collection of fresh follicles (Donor 5). Datasets from cryopreserved follicles were highly correlated (Supplementary Fig. S2a). We subjected these samples to the Omni-ATAC protocol and obtained 40 million mapped paired-end reads per sample (Supplementary Table SII). Our initial assessment of data sets obtained from cryopreserved tissue revealed lower TSS scores compared to datasets obtained from matched fresh samples (6.0 vs 2.7 for Donor 1 and 3.6 vs 2.0 for Donor 2; 2.3 for Donor 5), but consistent with previous values from cryopreserved tissue (Corces et al., 2017; Fujiwara et al., 2019). We therefore processed the data from cryopreserved samples through the AtacWorks pipeline with similar improvements in signal to noise as observed for our fresh tissue datasets (Supplementary Fig. S2b and c).
We moved forward with comparative analysis of datasets obtained from fresh or cryopreserved tissue from matched donors (i.e. Donors 1 and 2). We first compared overall regions of ATAC signal and found that all datasets were highly correlated (Fig. 3a). We next wanted to compare regions identified as enriched in accessible chromatin from both the fresh and the cryopreserved tissue. We used the peak calling algorithm in the AtacWorks package to identify enriched regions common to both donor samples in either the fresh datasets or the cryopreserved datasets. Overall, we observe significant overlap (P = 2.2×10⁻⁴) in commonly accessible regions, although we do observe more regions of open chromatin from the cryopreserved samples, perhaps due to increased noise in these data sets (Fig. 3b). We next used HOMER annotation to determine the genomic distribution of peaks from both fresh and cryopreserved follicles (Fig. 3c). While the distribution indicates a larger percentage of non-promoter peaks in cryopreserved tissue, overall, the number of promoters identified from fresh and cryopreserved samples is comparable (6902 for fresh and 6672 for cryopreserved) and shows significant overlap (P = 2.2×10⁻⁴, Fig. 3d). The distal regulatory elements observed from fresh tissue are largely a subset of those identified from cryopreserved tissue (Fig. 3e). Because the quality score of the fresh follicle datasets was higher than the cryopreserved follicle datasets, we next used peaks identified from fresh follicles to profile signal enrichment at these regions across all datasets. We first profiled ATAC-seq signal at promoters and found that both fresh and cryopreserved follicle data sets show good enrichment at these regions (Fig. 3f and Supplementary Fig. S3a). Next, we profiled distal regions of enrichment and again observed good enrichment at these regions in all datasets (Fig. 3g and Supplementary Fig. S3b).
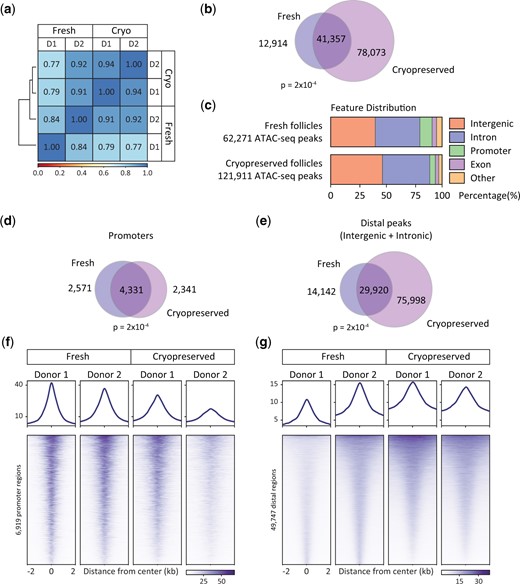
Comparison of Assay for Transposase Accessible Chromatin by sequencing (ATAC-seq) data sets from fresh and cryopreserved human pre-antral follicles. (a) Correlation between ATAC-seq datasets generated from fresh and cryopreserved (Cryo) human follicles from multiple donors (D1 and D2). (b) Venn diagram representing overlap of accessible regions identified from fresh and cryopreserved preantral follicle ATAC-seq data sets. P = 2×10⁻⁴, Z-score 363. (c) Distribution of accessible regions across the genome in each condition determined using HOMER. (d and e) Venn diagrams representing overlap of accessible regions identified from fresh and cryopreserved pre-antral follicles annotated as (d) promoters (P = 2×10⁻⁴, Z-score 436) or (e) distal regulatory elements (P = 2×10⁻⁴, Z-score 324). (f and g) ATAC-seq average profile and heat map showing chromatin accessibility in fresh and cryopreserved pre-antral follicles at regions identified as accessible (f) promoters and (g) distal regulatory elements in ATAC-seq data sets from fresh tissue.
Considering that the number and identity of peaks were somewhat different between fresh and cryopreserved tissue, we wanted to further examine whether the tissue preservation may affect the more general biological interpretation of the ATAC-seq data. We performed GO analysis to gain insight into biological functions of genes identified as having accessible proximal regulatory elements. We used ontology analysis from the fresh follicles to anchor our analysis and asked whether these terms were also enriched in data sets from cryopreserved follicles. For all GO categories, the top enriched terms showed a very similar enrichment pattern from fresh and cryopreserved conditions, although there were several terms that were identified from fresh follicles, only (Fig. 4). Biological process analysis revealed terms associated with the processing of RNA and mitochondrial function (Fig. 4a), the latter of which was also represented in cellular component analysis (Fig. 4b). In addition, both cellular component analysis and molecular function analysis were enriched with terms associated with ribosome function and RNA translation (Fig. 4b and c). These observations are in line with the reliance of the oocyte on translation as a mechanism of gene regulation rather than transcription and high mitochondrial activity in the oocyte (Richter and Lasko, 2011; Babayev and Seli, 2015). Overall, the ontology analysis from fresh and cryopreserved follicle data sets is highly concordant, suggesting that broad biological interpretation of these data sets is not greatly affected by the act of cryopreservation.
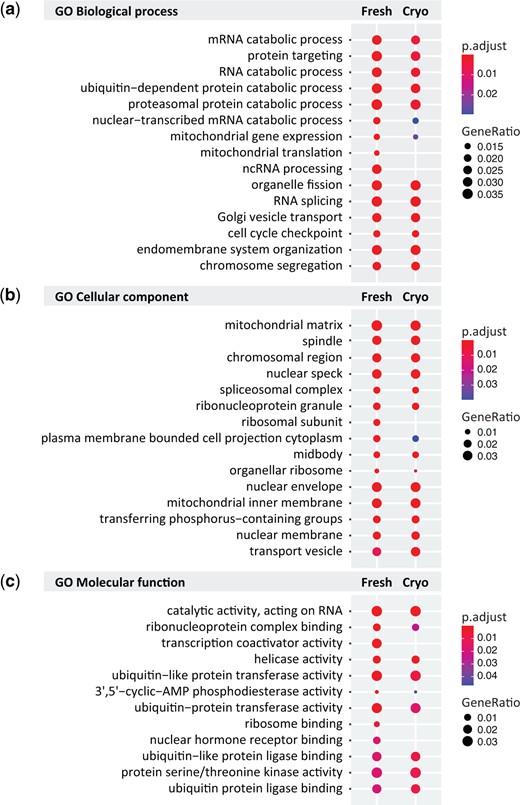
Gene ontology (GO) analysis of pre-antral follicle Assay for Transposase Accessible Chromatin by sequencing (ATAC-seq data). (a–c) Top ten GO terms for (a) biological process, (b) cellular component and (c) molecular function in fresh and cryopreserved samples, with the fresh condition used as a reference. Colors indicate adjusted P-values and dot size corresponds to gene ratio.
To further probe for sequence bias in ATAC-seq data that may have arisen as a consequence of tissue cryopreservation, we used HOMER motif analysis to assess the enrichment of transcription factor binding sites in both promoters and distal regulatory elements (i.e. enhancers) identified from both fresh and cryopreserved follicles. We again anchored our data to motifs identified from promoters and enhancers from fresh follicles and asked whether these same motifs were enriched from our data sets from cryopreserved follicles. As with our ontology analysis, the motifs identified from fresh and cryopreserved follicles were highly similar (Fig. 5). At promoters, we identified motifs for many members of Sp1-like/KLF family of transcription factors (Fig. 5a). These transcription factors regulate a large number of GC-rich promoters and are involved in virtually all aspects of cellular function (Kaczynski et al., 2003). We also observed motifs for transcription factors reported to play a role in germ cell biology. For example, we identified Ronin, an oocyte-specific transcription factor that fine-tunes the expression of ribosomal proteins and governs metabolic capacity (Dejosez et al., 2008; Salewskij et al., 2021). We also found enrichment of the NRF1 motif, a transcription factor associated with mitochondrial function in the oocyte (May-Panloup et al., 2005). Transcription factors involved broadly in cellular functions, including reproductive biology, were also identified at distal regulatory elements, for example the AP1 family member JunB (Shaulian and Karin, 2001) and Fos-associated transcription factors Fosl2, Fra1 and Fra2 (Renaud et al., 2014). Motifs for transcription factors with known roles in early embryo biology were also identified from distal regulatory regions. For example, distal ATAC-seq peaks were enriched with the zinc finger X-chromosomal protein (ZFX) motif, a transcription factor that was shown to regulate oocyte number in a mouse model (Luoh et al., 1997). These regions were also enriched with Nr5a2 motifs, an orphan nuclear receptor whose expression in granulosa cells of antral follicles is essential for fertility (Bertolin et al., 2014). Overall, these analyses are consistent with the literature regarding the identity of the cell types sequenced (mainly oocytes and granulosa cells). Further, these analyses support the conclusion that the ability to identify putative regulators of follicle biology is unaffected by the act of tissue cryopreservation.
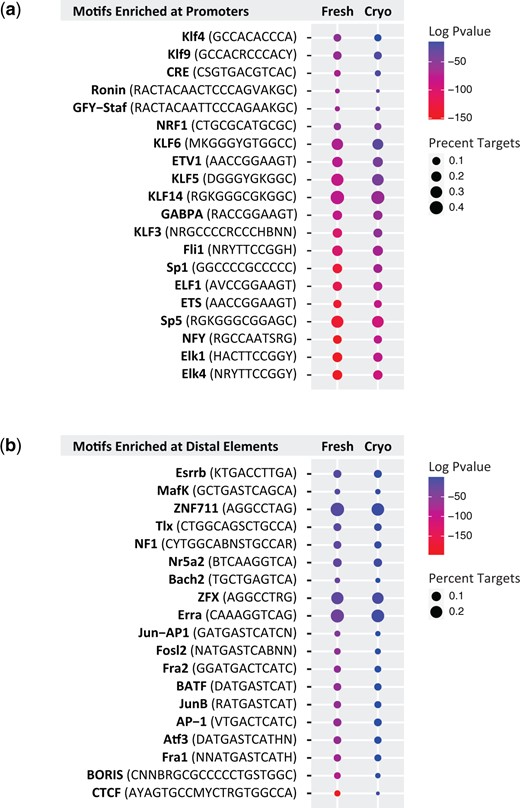
Motif analysis of pre-antral follicle Assay for Transposase Accessible Chromatin by sequencing (ATAC-seq) data. (a and b) Dotplot shows the top transcription factor binding motifs in fresh and cryopreserved human pre-antral follicles at (a) promoters and (b) distal accessible regions, with the fresh condition used as a reference. Colors indicate log adjusted P-values and dot size corresponds to percent target.
To determine whether the open chromatin regions we identify from ATAC-seq capture actively transcribed regions, we integrated our data sets with existing RNA-seq data sets from staged human follicles (Zhang et al., 2018). First, we binned transcripts from primary follicles into quartiles of expression (Fig. 6a). We then divided genes into high (top quartile), medium (second and third quartiles) and low (bottom quartile) expression groups. GO analysis confirms that highly expressed genes are involved in RNA processing and translation (Supplementary Fig. S4a), in line with ontology analysis from our ATAC-seq data and the literature, as discussed above. We then profiled our ATAC-seq data on these gene sets, demonstrating that the level of gene expression is related to the chromatin accessibility at the promoters of these genes (Fig. 6b and Supplementary Fig. S4b and c). Further, we find that 91% of highly expressed genes and 85% of mid-expressed genes are within 1.5 kb of an ATAC-seq peak from our follicle datasets, while the same is true for only 47% of lowly expressed genes (Fig. 6c). Finally, we asked whether transcription factors that bind to motifs identified from accessible promoters were expressed in primary follicles. Importantly, we find that the majority of these transcription factors fall within the mid- to highly expressed gene groups defined by RNA-seq analysis (Fig. 6d).
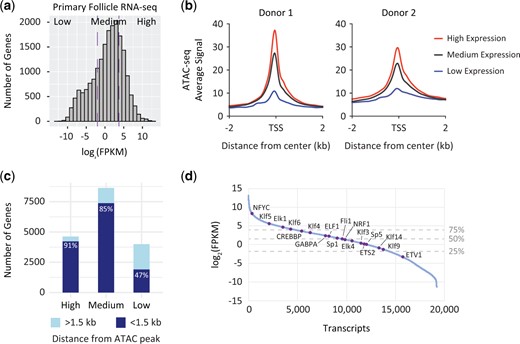
Integration of Assay for Transposase Accessible Chromatin by sequencing (ATAC-seq) data with RNA-seq. (a) Histogram of transcripts identified from primary human follicle RNA-seq data sets (Zhang et al., 2018). Purple dashed lines represent the 25% (left) and 75% (right) level of expression. FPKM, fragments per kilobase per million mapped fragments. (b) ATAC-seq average profiles from fresh human follicles for promoters of genes binned by expression based on RNA-seq. TSS, transcription start site. (c) Proportion of low, medium and highly expressed genes that are within 1.5 kb of an accessible region identified from ATAC-seq. Light blue regions represent genes >1.5 kb from an ATAC-seq peak and dark blue regions represent genes <1.5 kb from an ATAC-seq peak. (d) Log2(FPKM) expression of transcripts in primary human follicles from RNA-seq data sets (Zhang et al., 2018). Expression of transcription factors whose motifs were identified as enriched at promoters from ATAC-seq data are indicated in purple and labeled. Horizontal dashed lines represent the 25% (bottom) and 75% (top) expression levels, respectively.
Discussion
Here, we provide genomic analysis of active regulatory elements in ovarian pre-antral follicles using the ATAC-seq assay. Our study shows that these regions can be successfully identified from both fresh and cryopreserved tissue. While cryopreservation affected tissue and data quality, our analyses imply that the broad biological interpretation of chromatin accessibility data from such samples will faithfully recapitulate the regulatory landscape of fresh samples.
Given the lack of access to fresh clinical samples, it is imperative to demonstrate that data sets obtained from cryopreserved and stored samples will be congruent with data sets obtained from fresh samples. The cryopreserved sample was less pliable than fresh cortical tissue, increasing the difficulty of the dissection. Data obtained from cryopreserved follicles was noisier compared to data from fresh follicles, evidenced by a reduced percentage of total reads that could be assigned to TSSs. Further, we identified more regions of distal enrichment from cryopreserved ATAC-seq data sets, perhaps indicative of the reduced sample quality. Regardless, promoters identified from fresh or cryopreserved follicles were highly overlapping, suggesting that identification of these regions is quite robust despite the reduced data quality after cryopreservation. Additionally, we found that the data obtained from fresh and cryopreserved samples resulted in highly similar ontology analysis of promoters and motif enrichment analysis at both enhancers and promoters. Overall, these observations support the development of this method for the analysis of cryopreserved ovarian tissue.
Our study is of note because it is the first to identify active regulatory elements from human follicles. Analysis of the top 20 enriched promoter motifs identified a number of transcription factors that have previously been associated with oocyte function. For example, NRF1 is associated with mitochondrial respiration and has also been implicated in oocyte activation post-fertilization (May-Panloup et al., 2005). Further, NRF1 may function to regulate genetic stability through regulation of the kinetochore and spindle assembly (Oh et al., 2012), dysfunction of which can occur in aged oocytes (Ma et al., 2020). In addition, Ronin is a transcription factor that is highly expressed in the oocyte and plays a role in establishing the metabolic state of this cell (Dejosez et al., 2008; Salewskij et al., 2021). Transcription factor binding motifs enriched at enhancers identified in follicles are also representative of the literature, where transcription factors such as Esrrb, Nr5a2, ZFX and Fosl2 all have reported roles in follicle maturation (Luoh et al., 1997; Bertolin et al., 2014; Festuccia et al., 2018). However, our knowledge of the follicle regulatory network is not complete, and our data begin to provide a road map for understanding factors that have not previously been implicated in oocyte biology. Understanding the regulatory landscape of human follicles will not only improve our ability to direct folliculogenesis for assisted reproductive technologies but may also contribute to our ability to mimic the ooplasm for in vitro germ cell derivation (Hamazaki et al., 2021).
This study was particularly challenging due to the limited amount of human tissue available for follicle isolation. Because of this, pre-antral follicles were obtained as a collective group, rather than in stage-specific groups. By manually restricting the size of the follicles harvested and isolating follicles only from a cortical section, we anticipate that most follicles sequenced will be from a primary to early secondary stage. While access to tissue may be a difficult barrier to overcome, one group recently was able to obtain sufficient material for RNA-seq from human follicles spanning five stages of development, from primordial to preovulatory stage (Zhang et al., 2018). While our bulk ATAC-seq analysis is consistent with gene expression identified from these data sets, the ability to obtain staged follicles for ATAC-seq would greatly improve our understanding of the regulatory elements involved in follicle development. Due to technical limitations, we have not separated oocytes from granulosa cells, and our data sets will reflect active regulatory elements in both cell types. Single cell ATAC-seq (scATAC-seq) would no doubt prove useful in this respect. However, the tissue in question still represents a formidable challenge for such application due to the large number of initial cells required for scATAC-seq library preparation using the 10× Genomics platform and the relative difficulty of obtaining such large numbers of follicles from human donors. Therefore, future studies will surely benefit from improvements in scATAC-seq methods and advances in data processing (Buenrostro et al., 2015b; Cusanovich et al., 2015).
Overall, our research provides a first glimpse into the chromatin accessibility profile of gene regulatory elements in ovarian follicles. Our study provides critical proof of principle that these types of data sets can be acquired from cryopreserved tissues that have been stored for clinical purposes such as fertility treatment. Adapting ATAC-seq for such samples will lead to the identification of epigenetic features that may influence our ability to clinically promote fertility.
Supplementary data
Supplementary data are available at Molecular Human Reproduction online.
Data availability
Data files have been deposited in the Gene Expression Omnibus database under accession number GSE165637.
Acknowledgements
We thank UTSW BioHPC for computational infrastructure; UTSW McDermott Center for providing next-generation sequencing services; UTSW Histo Pathology Core for tissue processing. LAB. is a Virginia Murchison Linthicum Scholar in Medical Research (UTSW Endowed Scholars Program) and an American Cancer Society Research Scholar (RSG DMC-134230).
Authors’ roles
JS conceived the project and performed the experiments. AS analyzed the ATAC-seq data. ZJ provided invaluable experience in the cryopreservation and thaw of ovarian cortical tissue. KD and SC provided microscopic recording of ovarian cortical tissue. OB, BC and LAB conceived the project and provided funding for the work. JS and LAB wrote the manuscript with input from all authors.
Funding
This work was funded by NIGMS R35124958, ACS RSG DMC-134230, and the Welch Foundation I-2025 (LAB), the Department of Obstetrics and Gynecology and the Green Center for Reproductive Biology Sciences.
Conflict of interest
None to disclose.
References
Author notes
Jennifer Shannon and Aishwarya Sundaresan contributed equally to this study.
